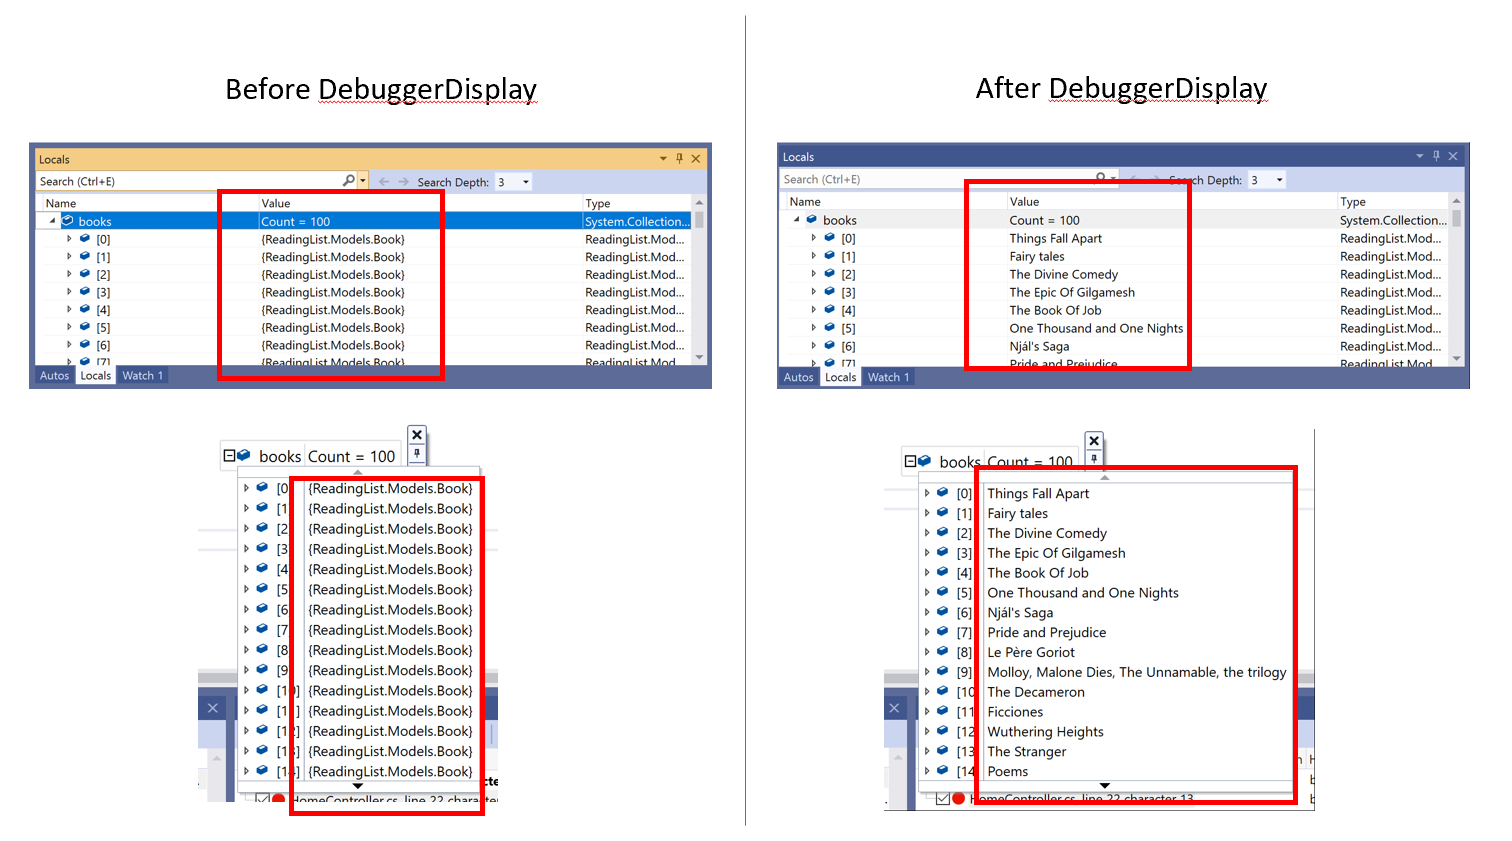
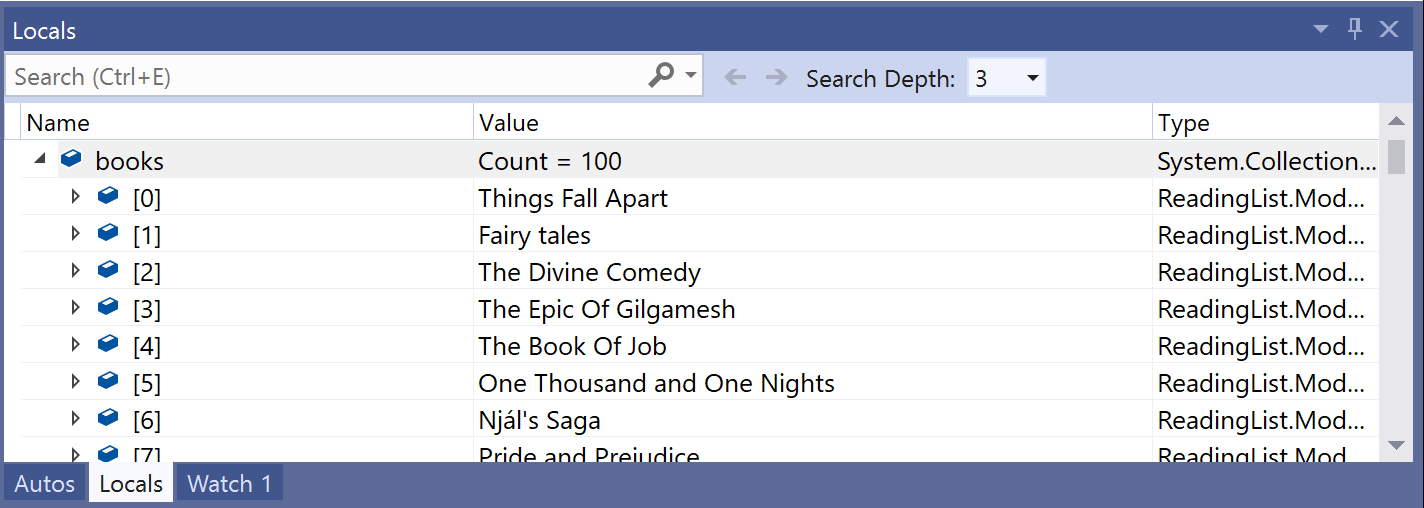
Have you ever stared at objects in a debugger window and wished that you could view those objects by something other than their type? I certainly have! Expanding items to determine each one’s identity can become tiresome very fast. Ideally, it would be great to quickly locate them by a particular property value. Luckily for us, Visual Studio has two not-so-well-known attributes known as DebuggerDisplay for managed users, and Natvis for native C++ users. These attributes let you customize how you view objects in debugger windows such as the Watch, Autos, Locals, and datatips!

What is the DebuggerDisplay attribute?
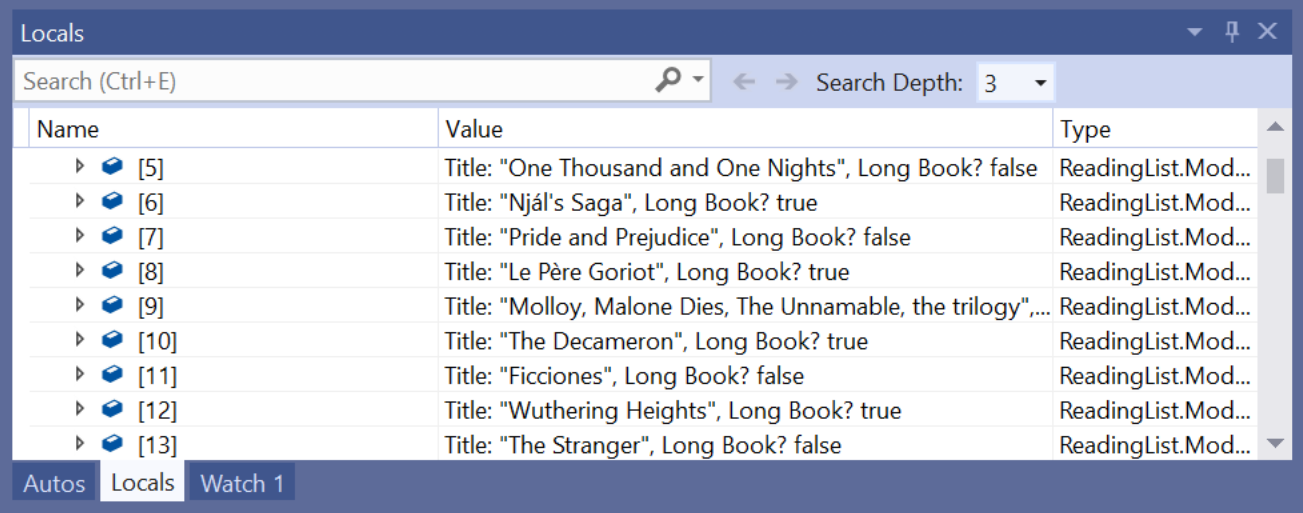
By writing DebuggerDisplay syntax at the top of a class, you can choose what strings and properties you want at the top of each object node in debugger windows. Besides displaying strings in debugger windows, adding curly brackets ({}) to the DebuggerDisplay attribute allows Visual Studio to display the value of a property or method that you specify. You can also add format specifiers to DebuggerDisplay in order to further change how values are displayed and formatted in the debugger windows. In Figure 2, DebuggerDisplay appends the format specifier “nq” (no quotes). The resulting display shows the string property Title without the surrounding quotation marks.


One previous workaround for performing this task is overriding a class’s ToString() method. In contrast, DebuggerDisplay controls how an item is displayed without overriding that method. So, if you don’t want debugging-related content in your ToString() method (especially when that method is called in your actual program), DebuggerDisplay is the way to go!
Can I display expressions for each object in debugger windows?
There may be times when you want to display expressions in debugger windows. Good news: you can display expressions using the DebuggerDisplay attribute!


Bad news: DebuggerDisplay expressions can cause additional issues when debugging your code. Potential issues include performance hits for large or complex expressions, compilation and runtime errors when the expression’s language differs from the language being debugged, and application state changes when expressions mutate properties.


But fear not! One way to reduce these potential issues with expressions is by creating a private property or method that returns the string of an executed expression and telling DebuggerDisplay to display that property.


What is the feature equivalent to DebuggerDisplay for C++ users?
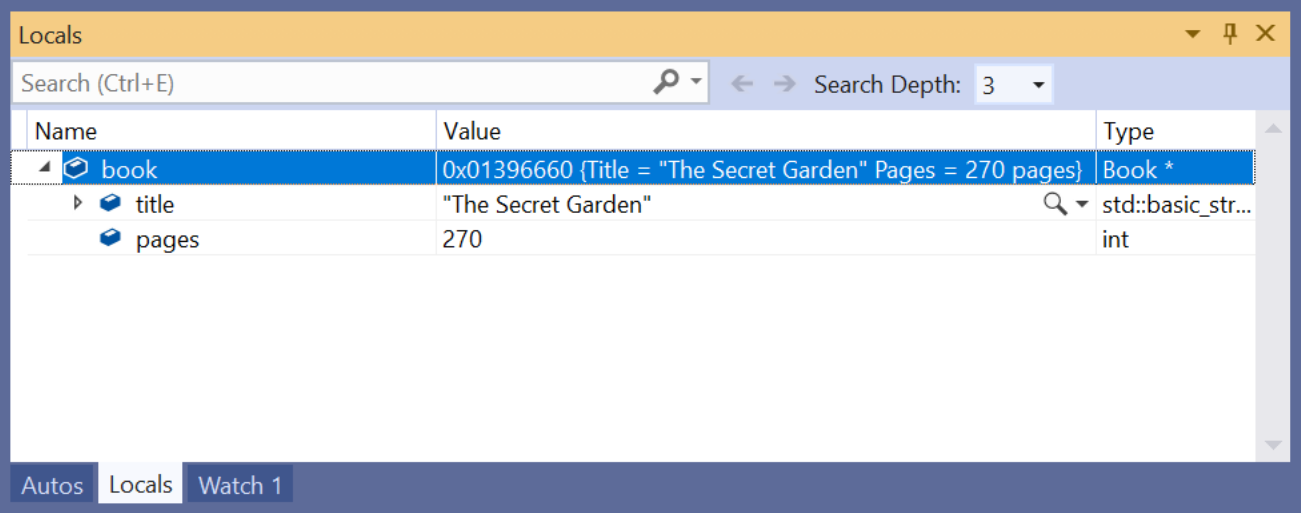
DebuggerDisplay is compatible with C#, F#, and Visual Basic, but if you’re debugging in C++, Natvis is a great alternative! Though not as simple as adding syntax to the top of a class like DebuggerDisplay, adding a .natvis file to a project lets you customize how objects are displayed.

Right-click the C++ project node in Solution Explorer, select Add > New Item, and select Visual C++ > Utility > Debugger visualization file (.natvis). The result is an XML file where you can control which properties are displayed while debugging.

To learn more about using Natvis while debugging C++ projects, check out the documentation.
These features are awesome and will save me lots of time! How can I help share DebuggerDisplay and Natvis with others?
Fun fact: both DebuggerDisplay and Natvis attributes have been in Visual Studio for years! These attributes are extremely useful to most developers but are still not as discoverable and well-known as they could be. As a result, we are currently working to provide an easier method to discover these attributes better, and your feedback will help make this happen! Please complete this survey which will give us insight in providing an improved experience when using these attributes.
The post Customize object displays in the Visual Studio debugger YOUR way appeared first on The Visual Studio Blog.