Several years ago, we decided that it was time to support SIMD code in .NET. We introduced the System.Numerics namespace with Vector2, Vector3, Vector4, Vector<T>, and related types. These types expose a general-purpose API for creating, accessing, and operating on them using hardware vector instructions (when available). They also provide a software fallback for when the hardware does not provide the appropriate instructions. This enabled a number of common algorithms to be vectorized, often with only minor refactorings. However, the generality of this approach made it difficult for programs to take full advantage of all vector instructions available on modern hardware. Additionally, modern hardware often exposes a number of specialized non-vector instructions that can dramatically improve performance. In this blog post, I’m exploring how we’ve addressed this limitation in .NET Core 3.0.
What are hardware intrinsics?
In .NET Core 3.0, we added a new feature called hardware intrinsics. Hardware intrinsics provide access to many of these hardware specific instructions that can’t easily be exposed in a more general-purpose mechanism. They differ from the existing SIMD intrinsics in that they are not general-purpose (the new hardware intrinsics are not cross-platform and the architecture does not provide a software fallback) and instead directly expose platform and hardware specific functionality to the .NET developer. The existing SIMD intrinsics, in comparison, are cross-platform, provide a software fallback, and are slightly abstracted from the underlying hardware. That abstraction can come at a cost and prevent certain functionality from being exposed (when said functionality does not exist or is not easily emulated on all target hardware).
The new intrinsics and supporting types are exposed under the System.Runtime.Intrinsics namespace. For .NET Core 3.0 there currently exists one namespace: System.Runtime.Intrinsics.X86. We are working on exposing hardware intrinsics for other platforms, such as System.Runtime.Intrinsics.Arm.
Under the platform specific namespaces, intrinsics are grouped into classes which represent logical hardware instruction groups (frequently referred to as Instruction Set Architectures or ISAs). Each class then exposes an IsSupported property that indicates whether the hardware you are currently executing on supports that instruction set. Each class then also exposes a set of methods that map to the underlying instructions exposed by that instruction set. There is sometimes additionally a subclass that is part of the same instruction set but that may be limited to specific hardware. For example, the Lzcnt class provides access to the leading zero count instructions. There is then a subclass named X64 which exposes the forms of the instruction that are only usable on 64-bit machines.
Some of the classes are also hierarchical in nature. For example, if Lzcnt.X64.IsSupported returns true, then Lzcnt.IsSupported must also return true since it is an explicit subclass. Likewise, if Sse2.IsSupported returns true, then Sse.IsSupported must also return true because Sse2 explicitly inherits from the Sseclass. However, it is worth noting that just because classes have similar names does not mean they are definitely hierarchical. For example, Bmi2 does not inherit from Bmi1 and so the IsSupported checks for the two instruction sets are distinct from each other. The design philosophy of these types is to truthfully represent the ISA specification. SSE2 requires to support SSE1, so we exposed a subclass and since BMI2 doesn’t require supporting BMI1, we didn’t use inheritance.
An example of the API shape described above is the following:
You can also see a more complete list by browsing the source code on source.dot.net or dotnet/coreclr on GitHub.
The IsSupported checks are treated as runtime constants by the JIT (when optimizations are enabled) and so you do not need to cross-compile to support multiple different ISAs, platforms, or architectures. Instead, you just write your code using if-statements and the unused code paths (any code path which is not executed, due to the condition for the branch being false or an earlier branch being taken instead) are dropped from the generated code (the native assembly code generated by the JIT at runtime).
It is essential that you guard usage of hardware intrinsics with the appropriate IsSupported check. If your code is unguarded and runs on a machine or architecture/platform that doesn’t support the intrinsic, a PlatformNotSupportedException is thrown by the runtime.
What benefits do these provide me?
Hardware Intrinsics definitely aren’t for everyone, but they can be used to boost perf in some computationally heavy workloads. Frameworks such as CoreFX or ML.NET take advantage of these methods to help accelerate things like copying memory, searching for the index of an item in an array/string, resizing images, or working with vectors, matrices, and tensors. Manually vectorizing some code that has been identified as a bottleneck can also be easier than it seems. Vectorizing your code is really all about performing multiple operations at once, generally using Single-Instruction Multiple Data (SIMD) instructions.
It is important to profile your code before vectorizing to ensure that the code you are optimizing is part of a hot spot (and therefore the optimization will be impactful). It is also important to profile while you are iterating on the vectorized code, as not all code will benefit from vectorization.
Vectorizing a simple algorithm
Take for example an algorithm which sums all elements in an array or span. This code is a perfect candidate for vectorization because it does the same unconditional operation every iteration of the loop and those operations are fairly trivial in nature.
An example of such an algorithm might look like the following:
The code is simple and understandable, but it is also not particularly fast for large inputs since you are only doing a single trivial operation per loop iteration.
| Method | Count | Mean | Error | StdDev |
|---|---|---|---|---|
| Sum | 1 | 2.477 ns | 0.0192 ns | 0.0179 ns |
| Sum | 2 | 2.164 ns | 0.0265 ns | 0.0235 ns |
| Sum | 4 | 3.224 ns | 0.0302 ns | 0.0267 ns |
| Sum | 8 | 4.347 ns | 0.0665 ns | 0.0622 ns |
| Sum | 16 | 8.444 ns | 0.2042 ns | 0.3734 ns |
| Sum | 32 | 13.963 ns | 0.2182 ns | 0.2041 ns |
| Sum | 64 | 50.374 ns | 0.2955 ns | 0.2620 ns |
| Sum | 128 | 60.139 ns | 0.3890 ns | 0.3639 ns |
| Sum | 256 | 106.416 ns | 0.6404 ns | 0.5990 ns |
| Sum | 512 | 291.450 ns | 3.5148 ns | 3.2878 ns |
| Sum | 1024 | 574.243 ns | 9.5851 ns | 8.4970 ns |
| Sum | 2048 | 1,137.819 ns | 5.9363 ns | 5.5529 ns |
| Sum | 4096 | 2,228.341 ns | 22.8882 ns | 21.4097 ns |
| Sum | 8192 | 2,973.040 ns | 14.2863 ns | 12.6644 ns |
| Sum | 16384 | 5,883.504 ns | 15.9619 ns | 14.9308 ns |
| Sum | 32768 | 11,699.237 ns | 104.0970 ns | 97.3724 ns |
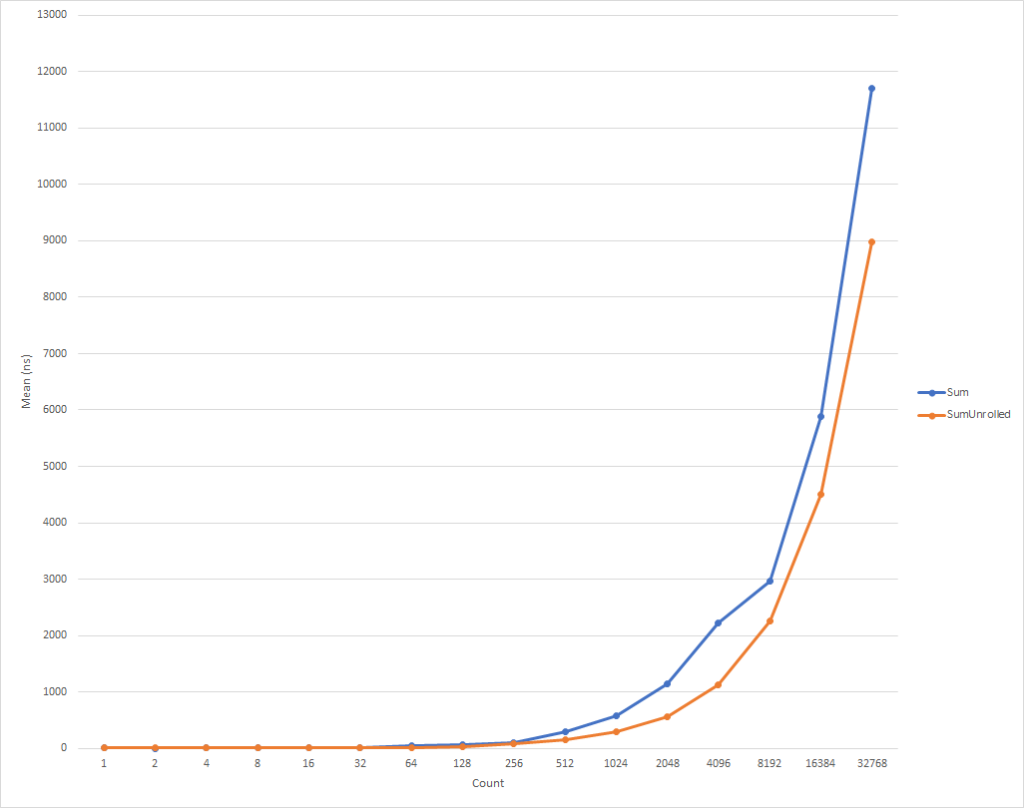
Improving the perf by unrolling the loop
Modern CPUs have many ways of increasing the throughput at which it executes your code. For single-threaded applications, one of the ways it can do this is by executing multiple primitive operations in a single cycle (a cycle is the basic unit of time in a CPU).
Most modern CPUs can execute about 4 add operations in a single cycle (under optimal conditions), so by laying out your code correctly and profiling it, you can sometimes optimize your code to have better performance, even when only executing on a single-thread.
While the JIT can perform loop unrolling itself, it is conservative in deciding when to do so due to the larger codegen it produces. So, it can be beneficial to manually unroll the loop in your source code instead.
You might unroll your code like the following:
The code is slightly more complicated but takes better advantage of your hardware.
For really small loops, the code ends up being slightly slower, but that normalizes itself for inputs that have 8 elements and then starts getting faster for inputs with even more elements (taking 26% less time at 32k elements). It’s also worth noting that this optimization doesn’t always improve performance. For example, when handling float, the unrolled version is practically the same speed as the original version, so it’s important to profile your code accordingly.
| Method | Count | Mean | Error | StdDev |
|---|---|---|---|---|
| SumUnrolled | 1 | 2.922 ns | 0.0651 ns | 0.0609 ns |
| SumUnrolled | 2 | 3.576 ns | 0.0116 ns | 0.0109 ns |
| SumUnrolled | 4 | 3.708 ns | 0.0157 ns | 0.0139 ns |
| SumUnrolled | 8 | 4.832 ns | 0.0486 ns | 0.0454 ns |
| SumUnrolled | 16 | 7.490 ns | 0.1131 ns | 0.1058 ns |
| SumUnrolled | 32 | 11.277 ns | 0.0910 ns | 0.0851 ns |
| SumUnrolled | 64 | 19.761 ns | 0.2016 ns | 0.1885 ns |
| SumUnrolled | 128 | 36.639 ns | 0.3043 ns | 0.2847 ns |
| SumUnrolled | 256 | 77.969 ns | 0.8409 ns | 0.7866 ns |
| SumUnrolled | 512 | 146.357 ns | 1.3209 ns | 1.2356 ns |
| SumUnrolled | 1024 | 287.354 ns | 0.9223 ns | 0.8627 ns |
| SumUnrolled | 2048 | 566.405 ns | 4.0155 ns | 3.5596 ns |
| SumUnrolled | 4096 | 1,131.016 ns | 7.3601 ns | 6.5246 ns |
| SumUnrolled | 8192 | 2,259.836 ns | 8.6539 ns | 8.0949 ns |
| SumUnrolled | 16384 | 4,501.295 ns | 6.4186 ns | 6.0040 ns |
| SumUnrolled | 32768 | 8,979.690 ns | 19.5265 ns | 18.2651 ns |
Improving the perf by vectorizing the loop
However, we can still optimize the code a bit more. SIMD instructions are another way modern CPUs allow you to improve throughput. Using a single instruction they allow you to perform multiple operations in a single cycle. This can be better than the loop unrolling because it performs essentially the same operation, but with smaller generated code.
To elaborate a bit, each one of the add instructions from the unrolled loop is 4 bytes in size, so it takes 16-bytes of space to have all 4 adds in the unrolled form. However, the SIMD add instruction also performs 4 additions, but it only takes 4 bytes to encode. This means there are less instructions for the CPU to decode and execute each iteration of the loop. There are also other things the CPU can assume and optimize around for this single instruction, but those are out of scope for this blog post. What’s even better is that modern CPUs can also execute more than one SIMD instruction per cycle, so in certain cases you can then unroll your vectorized code to improve the performance further.
You should generally start by looking at whether the general-purpose Vector<T> class will suit your needs. It, like the newer hardware intrinsics, will emit SIMD instructions, but given that it is general-purpose you can reduce the amount of code you need to write/maintain.
The code might look like:
The code is faster, but we have to fall back to accessing individual elements when computing the overall sum. Vector<T> also does not have a well-defined size and can vary based on the hardware you are running against. The hardware intrinsics provide some additional functionality that can make this code a bit nicer and faster still (at the cost of additional code complexity and maintainence requirements).
| Method | Count | Mean | Error | StdDev |
|---|---|---|---|---|
| SumVectorT | 1 | 4.517 ns | 0.0752 ns | 0.0703 ns |
| SumVectorT | 2 | 4.853 ns | 0.0609 ns | 0.0570 ns |
| SumVectorT | 4 | 5.047 ns | 0.0909 ns | 0.0850 ns |
| SumVectorT | 8 | 5.671 ns | 0.0251 ns | 0.0223 ns |
| SumVectorT | 16 | 6.579 ns | 0.0330 ns | 0.0276 ns |
| SumVectorT | 32 | 10.460 ns | 0.0241 ns | 0.0226 ns |
| SumVectorT | 64 | 17.148 ns | 0.0407 ns | 0.0381 ns |
| SumVectorT | 128 | 23.239 ns | 0.0853 ns | 0.0756 ns |
| SumVectorT | 256 | 62.146 ns | 0.8319 ns | 0.7782 ns |
| SumVectorT | 512 | 114.863 ns | 0.4175 ns | 0.3906 ns |
| SumVectorT | 1024 | 172.129 ns | 1.8673 ns | 1.7467 ns |
| SumVectorT | 2048 | 429.722 ns | 1.0461 ns | 0.9786 ns |
| SumVectorT | 4096 | 654.209 ns | 3.6215 ns | 3.0241 ns |
| SumVectorT | 8192 | 1,675.046 ns | 14.5231 ns | 13.5849 ns |
| SumVectorT | 16384 | 2,514.778 ns | 5.3369 ns | 4.9921 ns |
| SumVectorT | 32768 | 6,689.829 ns | 13.9947 ns | 13.0906 ns |

NOTE: For the purposes of this blogpost, I forced the size of Vector<T> to 16-bytes using an internal configuration knob (COMPlus_SIMD16ByteOnly=1). This normalized the results when comparing SumVectorT to SumVectorizedSse and kept the latter code simpler. Namely, it avoided the need to write an if (Avx2.IsSupported) { } code path. Such a code path is nearly identical to the Sse2 path, but deals with Vector256<T> (32-bytes) and processes even more elements per loop iteration.
So, you might take advantage of the new hardware intrinsics like so:
The code is again slightly more complicated, but it’s significantly faster for all but the smallest workloads. At 32k elements, it’s taking 75% less time than the unrolled loop and 81% less than the original code.
You’ll notice that we have a few IsSupported checks. The first checks if the hardware intrinsics are supported for the current platform at all and falls back to the unrolled loop if they aren’t. This path will currently be hit for platforms like ARM/ARM64 which don’t have hardware intrinsics or if someone disables them for any reason. The second IsSupported check is in the SumVectorizedSse method and is used to produce slightly better codegen on newer hardware that additionally supports the Ssse3 instruction set.
Otherwise, most of the logic is essentially the same as what we had done for the unrolled version. Vector128<T> is a 128-bit type that contains Vector128<T>.Count elements. In the case of uint, which is itself 32-bits, you have 4 (128 / 32) elements, which is exactly how much we unrolled the loop by.
| Method | Count | Mean | Error | StdDev |
|---|---|---|---|---|
| SumVectorized | 1 | 4.555 ns | 0.0192 ns | 0.0179 ns |
| SumVectorized | 2 | 4.848 ns | 0.0147 ns | 0.0137 ns |
| SumVectorized | 4 | 5.381 ns | 0.0210 ns | 0.0186 ns |
| SumVectorized | 8 | 4.838 ns | 0.0209 ns | 0.0186 ns |
| SumVectorized | 16 | 5.107 ns | 0.0175 ns | 0.0146 ns |
| SumVectorized | 32 | 5.646 ns | 0.0230 ns | 0.0204 ns |
| SumVectorized | 64 | 6.763 ns | 0.0338 ns | 0.0316 ns |
| SumVectorized | 128 | 9.308 ns | 0.1041 ns | 0.0870 ns |
| SumVectorized | 256 | 15.634 ns | 0.0927 ns | 0.0821 ns |
| SumVectorized | 512 | 34.706 ns | 0.2851 ns | 0.2381 ns |
| SumVectorized | 1024 | 68.110 ns | 0.4016 ns | 0.3756 ns |
| SumVectorized | 2048 | 136.533 ns | 1.3104 ns | 1.2257 ns |
| SumVectorized | 4096 | 277.930 ns | 0.5913 ns | 0.5531 ns |
| SumVectorized | 8192 | 554.720 ns | 3.5133 ns | 3.2864 ns |
| SumVectorized | 16384 | 1,110.730 ns | 3.3043 ns | 3.0909 ns |
| SumVectorized | 32768 | 2,200.996 ns | 21.0538 ns | 19.6938 ns |

Summary
The new hardware intrinsics allow you to take advantage of platform-specific functionality for the machine you’re running on. There are approximately 1,500 APIs for x86 and x64 spread across 15 instruction sets and far too many to cover in a single blog post. By profiling your code to identify hot spots you can also potentially identify areas of your code that would benefit from vectorization and see some pretty good performance gains. There are multiple scenarios where vectorization can be applied and loop unrolling is just the beginning.
Anyone wanting to see more examples can search for uses of the intrinsics in the framework (see the dotnet and aspnet organizations) or in various other blog posts written by the community. And while the currently exposed intrinsics are extensive, there is still a lot of functionality that could be exposed. If you have functionality you would like exposed, feel free to log an API request against dotnet/corefx on GitHub. The API review process is detailed here and there is a good example for the API Request template listed under Step 1.
Special Thanks
A special thanks to our community members Fei Peng (@fiigii) and Jacek Blaszczynski (@4creators) who helped implement the hardware intrinsics. Also to all the community members who have provided valuable feedback to the design, implementation, and usability of the feature.
The post Hardware Intrinsics in .NET Core appeared first on .NET Blog.