Have you ever accidentally shipped a log statement to production? Are you tired of cleaning up log statements while debugging? The tool to solve your problems has been here all along!
Do you use log statements to debug?
Let’s be honest we have all done it at some point. Whether it be Debug.WriteLine(), console.log(), print(), etc. logging output to the console is a common practice that leads to what some might call “immediate feedback”. But what seems like a simple and enjoyable approach to debugging quickly turns into a lot of cleanup work because the log statements are now littered through your code. After all no one wants to see your log statements shipped to production.
Do you find code cleanup tedious?
If so, then Tracepoints are a great tool you can use in Visual Studio. This feature allows you to log desired information without modifying your code and is initialized in a similar fashion to breakpoints. When you are done debugging simply click on a tracepoint to remove it.
The solution has been here all along
Tracepoints are not a new feature. In fact, they have existed in Visual Studio since 2005, but we feel that many developers do not know about this capability. In this post, we will go over what tracepoints can do, how to use them, and why they are a feature worth using.
For an even more thorough explanation of tracepoints, see our docs page: https://docs.microsoft.com/en-us/visualstudio/debugger/using-tracepoints?view=vs-2019.
Let’s look at an example
The following program is a for loop with a counter variable increasing by one each time the loop iterates. Let’s say we wanted to print out the value of counter for each iteration of the for loop. One solution is to use a log statement such as Debug.WriteLine(counter) to print out the values. Let’s see what that would look like:
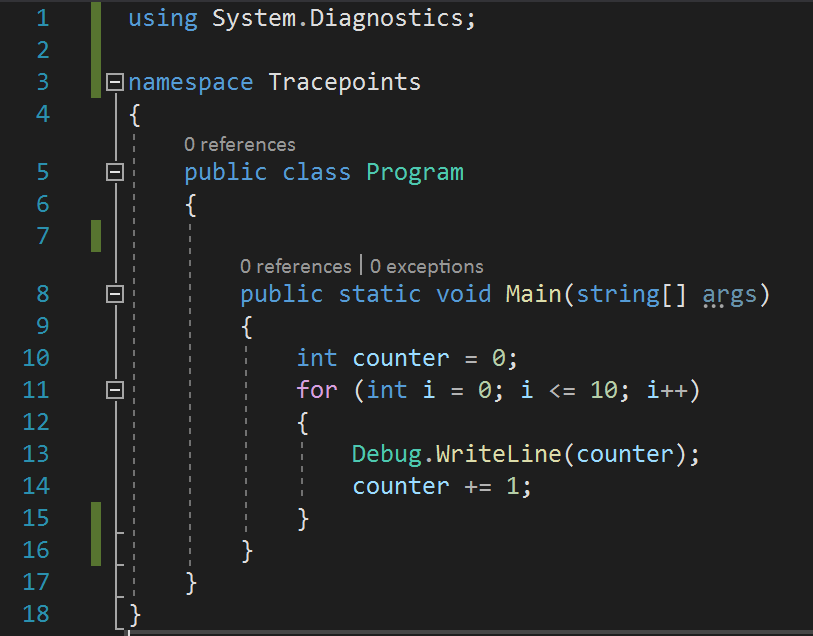
While that certainly accomplished this simple task, it required us to modify our code and will necessitate we delete the statement later so that the log statement is not shipped to production. You also will need to delete log statements periodically even before shipping to production as you add newer log statements so that the Output window in Visual Studio is not cluttered with irrelevant information. Furthermore, there is no conditional logic to when these statements print such as only printing the “counter” variable when it is an odd number. Adding conditions would require more code, further complicating the debugging process and creating more cleanup for later. We believe that there is a better way to handle these situations.
Tracepoints to the rescue
The GIF below demonstrates how to initialize a tracepoints.
Notice how when you add a message in the “Show a message in the Output window field” under the actions menu you are not modifying your original code in any way. By this I mean you do not need to add print statements or functions such as Debug.WriteLine() in the middle of your code just to see information in Visual Studio’s Output window. This allows you to get the desired information in Visual Studio’s Output window that you wanted before without compromising the readability of your code. Furthermore, when you are done debugging simply click on the tracepoint once to delete it. Simple as that. If you forget to delete a tracepoint don’t fret about the extraneous output showing up in production. That’s because tracepoints only exist locally on your machine.
You can add conditions too
What about those cases earlier when we wanted conditions? Let’s say we wanted every other count or the value of counter during a specific iteration of the for loop. Well it turns out we can add conditions too in a similar fashion to conditional breakpoints.
There are three condition types:
- Conditional Expression: Output message displayed only under certain conditions such as “counter >= 5”.
- Hit Count: This condition allows you to output only after a pre-specified number of times the line the tracepoint was set on has been executed.
- Filter: Tracepoint will only be activated on specified devices, processes or threads.
Adding these conditions will not modify your original code and unlike breakpoints does not stop the program and require a user to repeatedly step into or over a program (as long as the “Continue code” box under Actions is checked).
Tips and tricks
Currently tracepoint messages go to Visual Studio’s Output window. It is easy to lose track of the messages amongst the many other things that get sent to the same window.
- If you right click within the Output window, you can turn off classes of messages such as Exception Messages, Step Filtering Messages, Process Exit Messages, etc by clicking on them. By turning off some of these classes of messages that you may not want, it will make it easier to focus on your tracepoint output.
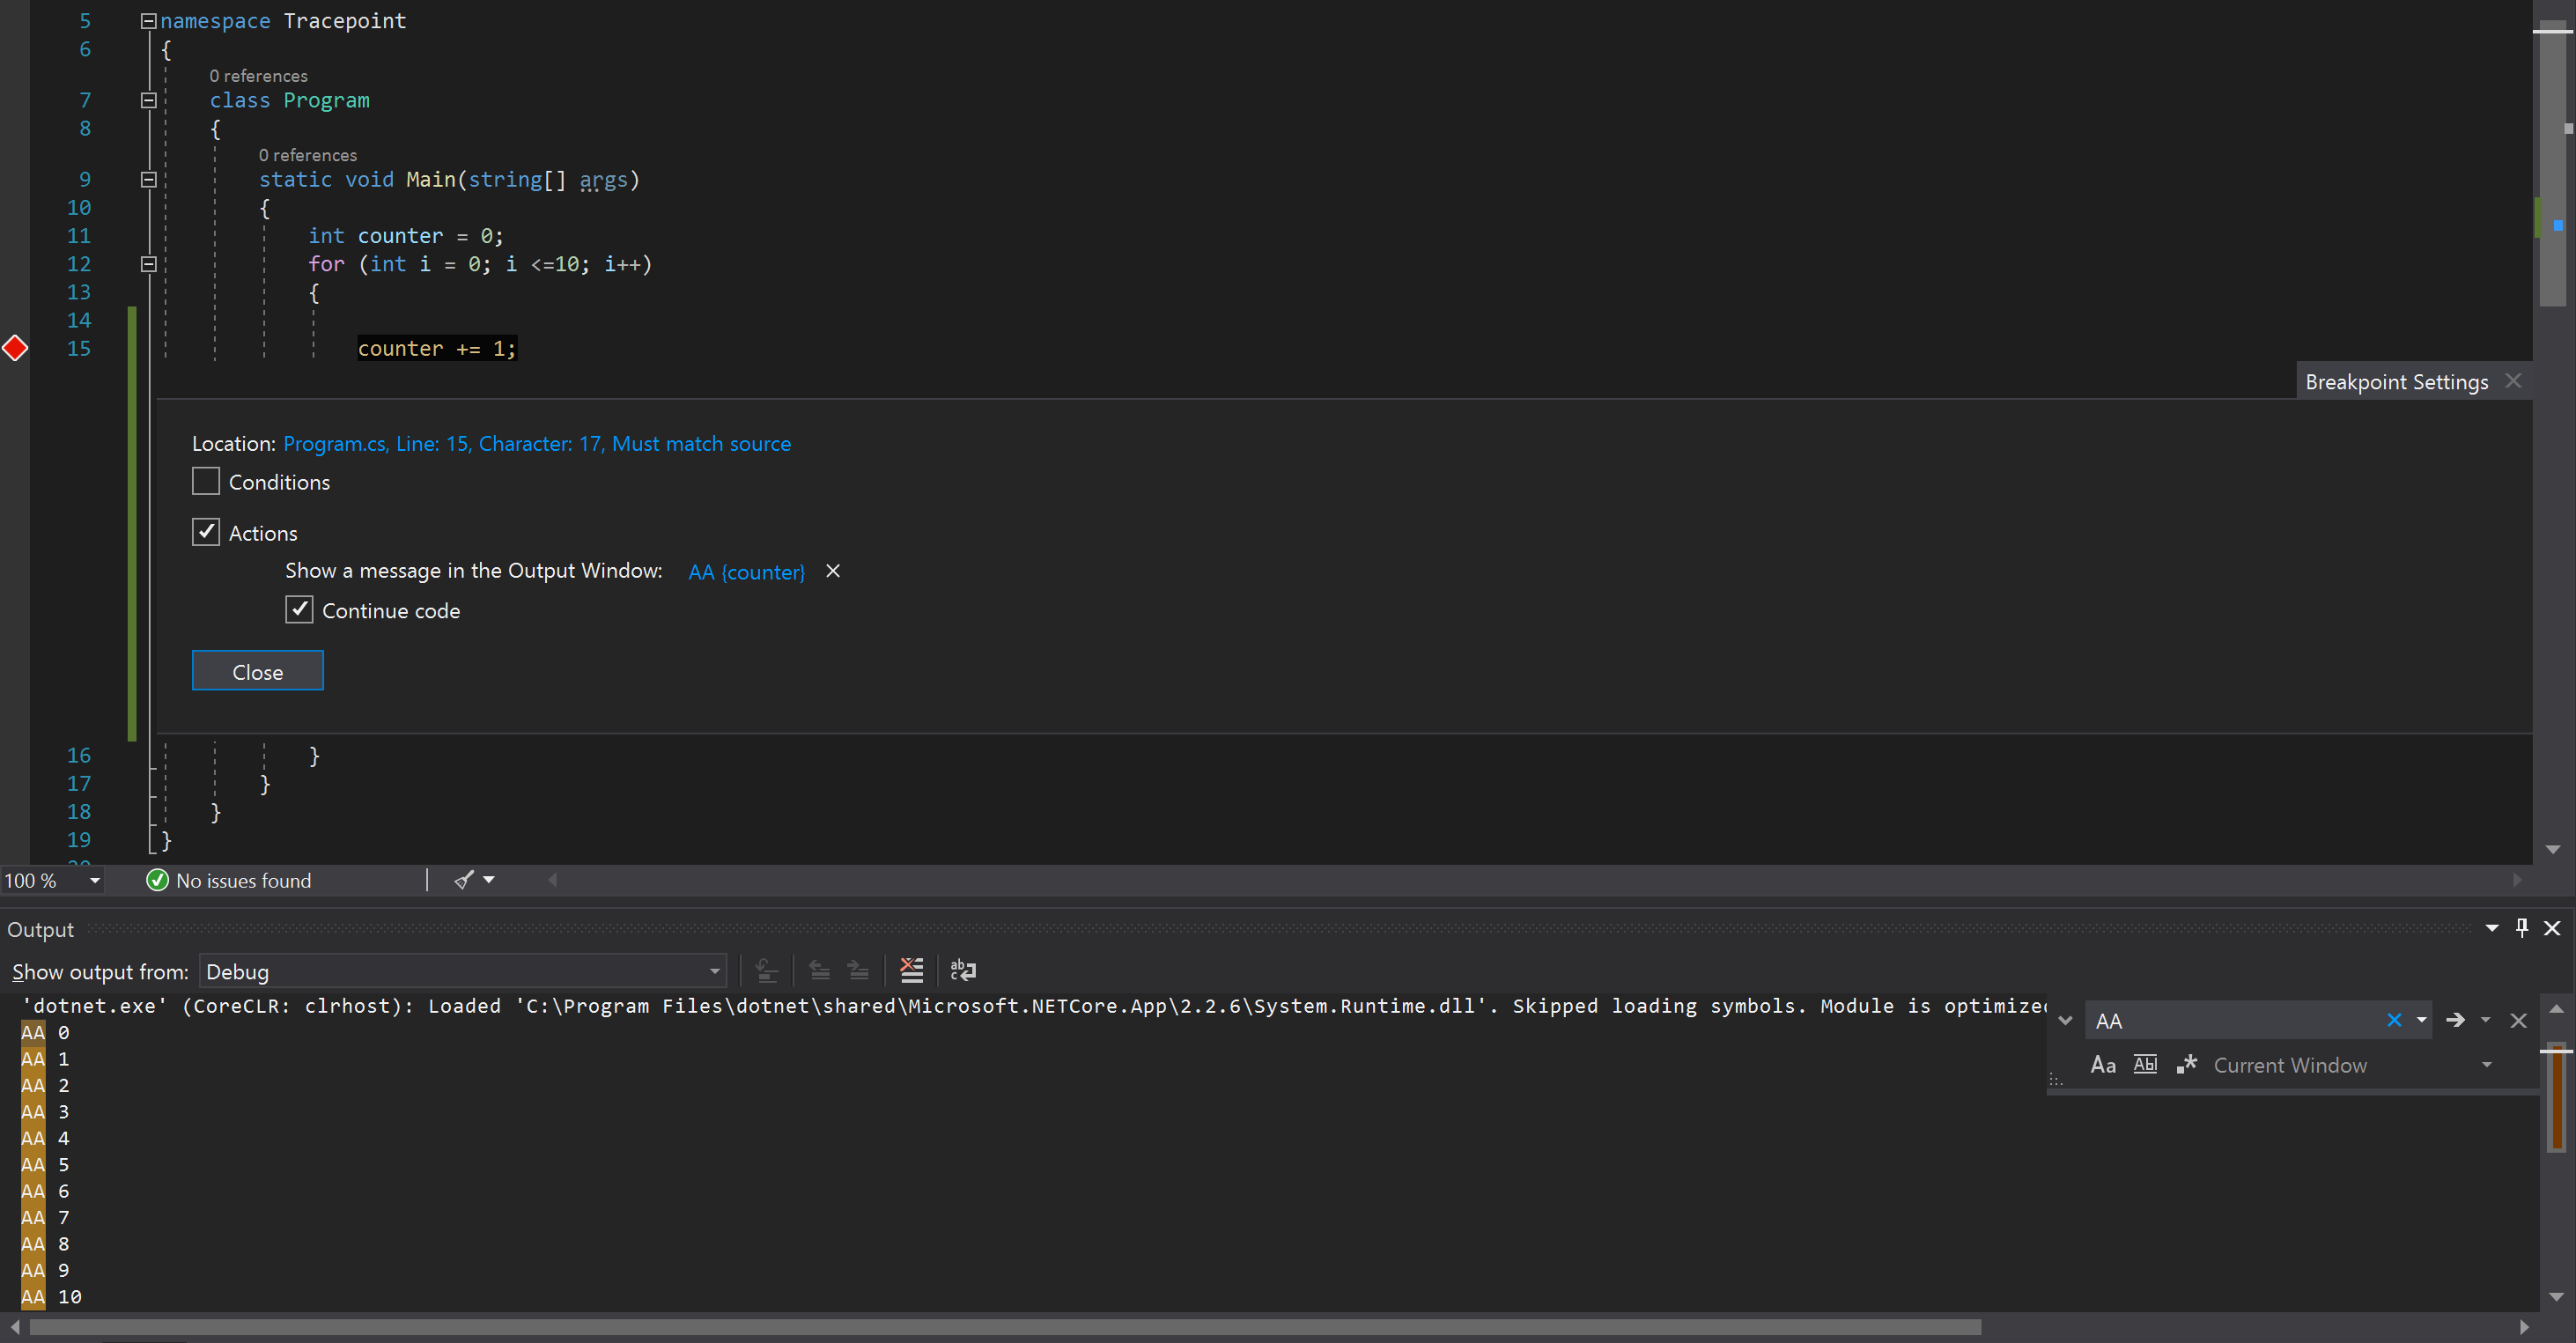
- If your current task requires you keep all the classes of messages on, another trick to make it easier to find your output is to prefix your action’s message with a unique phrase like “AA”. Once you start debugging your program you can use the CTRL-F command in the Output window to search for the prefix you set and it will take you straight to your output message (see image below).
- To temporarily disable a tracepoint without deleting it is to hit “Shift + left click” on the tracepoint.
- To view, disable, and/or delete all the Tracepoints and Breakpoints in your current file at once hit Debug -> Windows -> Breakpoints to access the Breakpoints window.
When logging might be useful
In some cases, a language’s log statement such as Debug.WriteLine() in C# may be a better choice than using tracepoints. For example, if you want to always see some output in the debugger that persists beyond the current debug session then Debug.WriteLine() might be the right option in that context. Tracepoints do not persist beyond a single (or possibly a few) debug sessions. Another consideration is efficiency. Tracepoints are also less efficient at debug time so if they too slow for your needs try a log statement instead. Lastly, tracepoints have limitations in what data they can collect because they can only virtually execute function evaluations. Despite some of these restrictions, we still feel like tracepoints are a great tool to have in your debugging toolkit.
Wrapping up
In conclusion, tracepoints are a great way to keep your code clean during debugging. You will not need to modify your original code or remove statements later. If you want conditions you can add those as well without needing continuously stop and step through your program. We hope you enjoy using tracepoints and that they streamline your workflow! For more information on tracepoints please check out our docs page: https://docs.microsoft.com/en-us/visualstudio/debugger/using-tracepoints?view=vs-2019
If you have any feedback, please feel free to reach out to us. We would love to hear from you!
The post Tracepoints: Debug with less clutter appeared first on The Visual Studio Blog.


