How is our Feature progressing? As simple and common as this question is, it’s a hard one to answer. Especially if your Feature is complex and is composed of multiple User Stories and Tasks. With Sprint 157 Update you will be able to answer this using Rollup in Azure Boards backlog view.
What is rollup?
Rollup is an aggregation displayed on a parent item (like Epic, Feature or even User story) calculated based on parent child relationships. For example, at the Feature backlog you can track progress of each of the Features based on the sum of Story Points for the completed linked User Stories. Learn more about Rollup. Rollup is based on the Analytics service, see Analytics latency and rollup for more details.
Add rollup columns to you backlog
Adding a rollup column is as simple as adding any other column to your backlog view. Click on “Column Options”. In the panel click “Add rollup column” and select from the rollup quick list what you want to rollup on. You can add one or more rollup columns to any of the backlog levels. Like regular columns, this selection will be saved per user and backlog level. The rollup options you can add are based on your project’s process template. That means that the list of rollup columns available may vary per project.
Rollup for custom fields
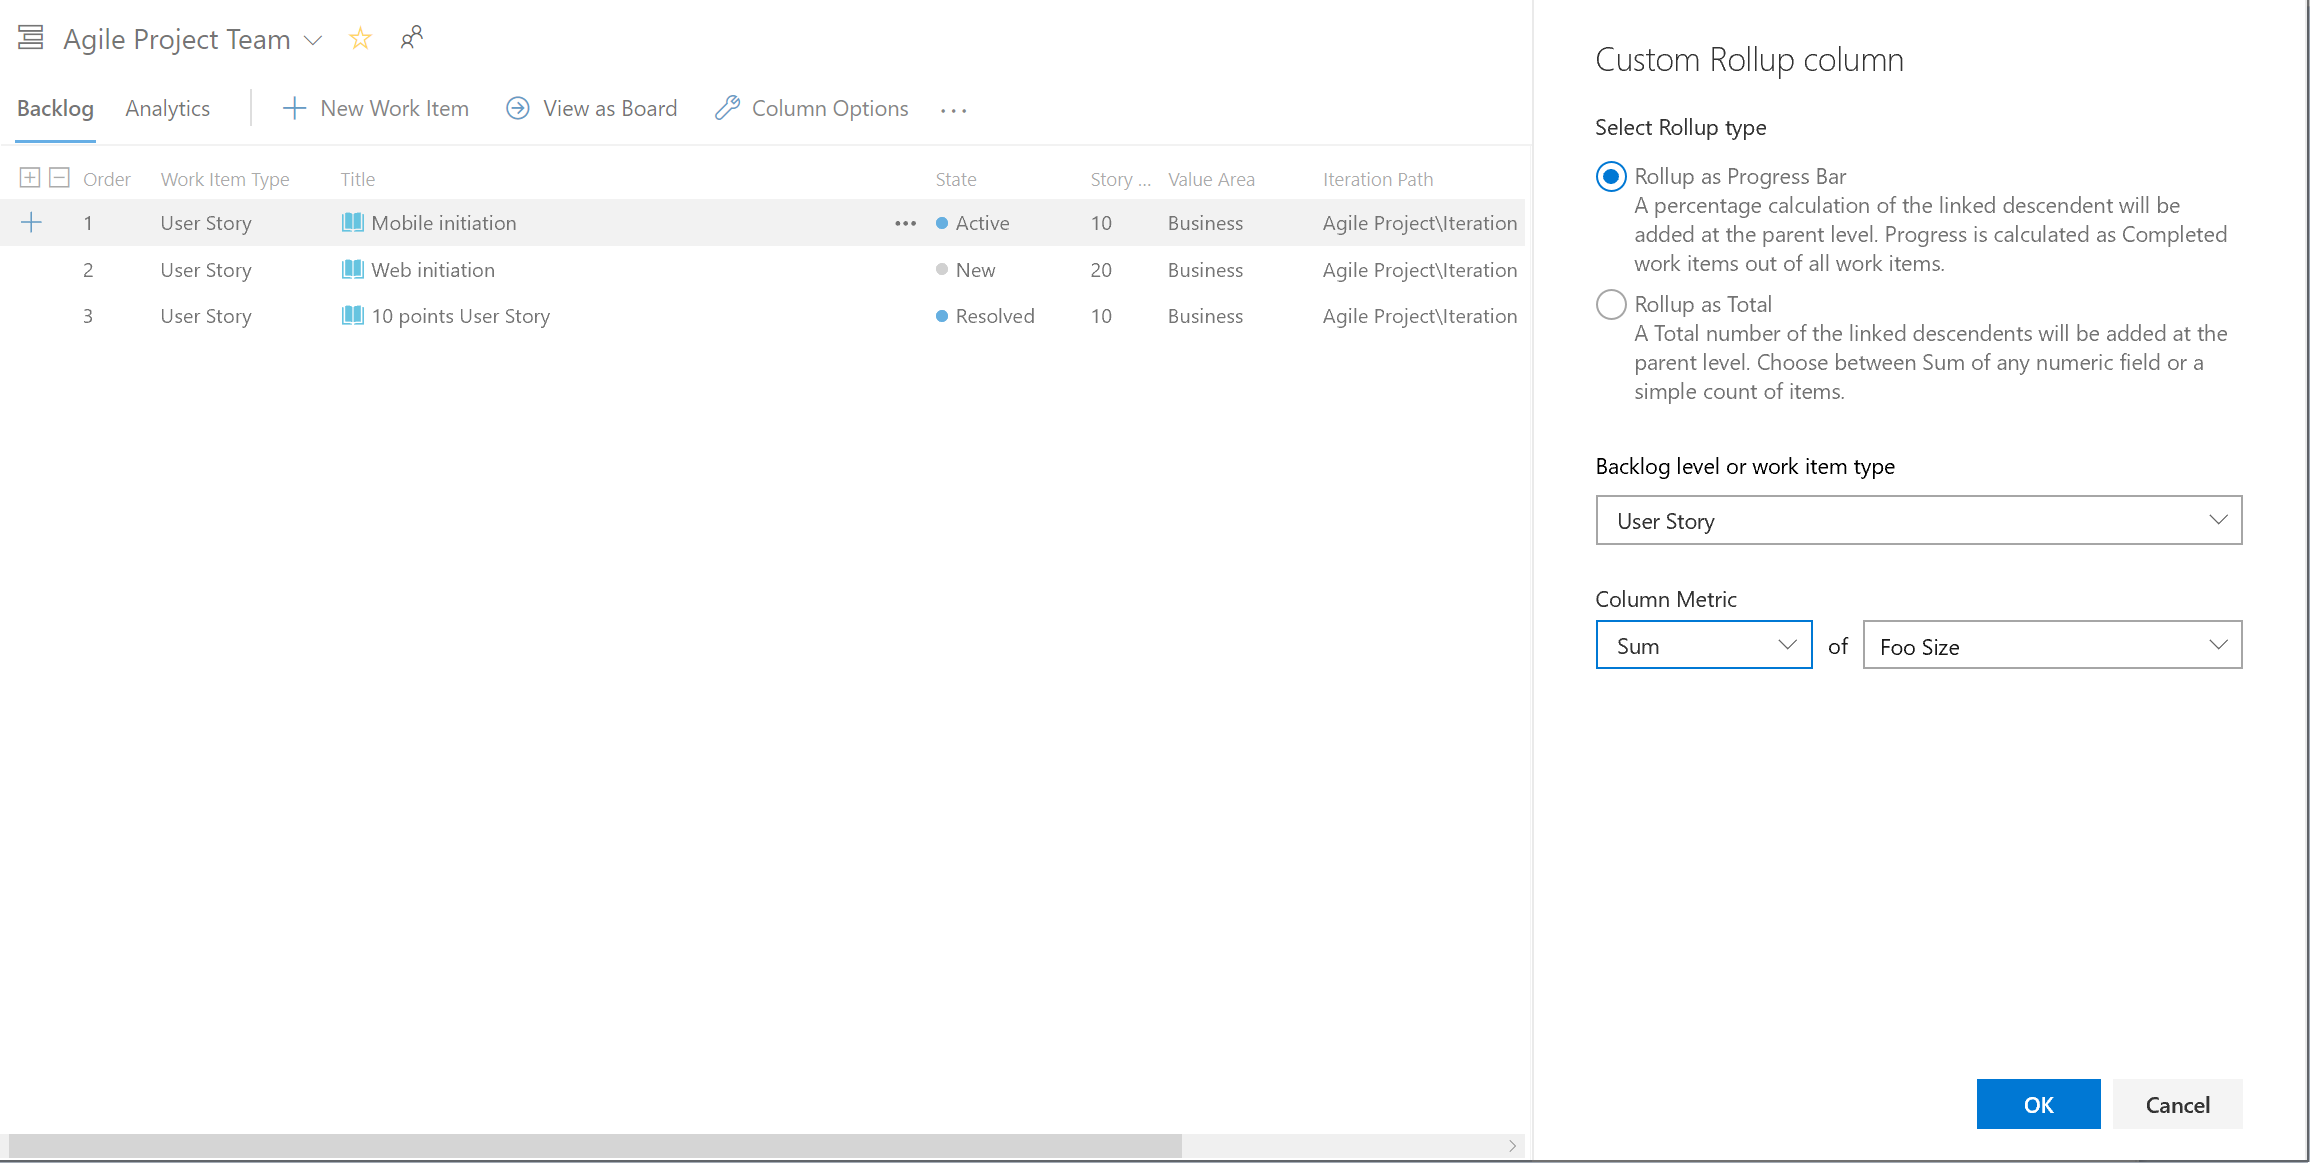
If you want to rollup on numeric fields that are not part of the out of the box process template, you can configure your own column. In the “Column options” panel, click “Add rollup column” and then “Configure custom rollup”. Then you’ll then need to define the column’s characteristics:
- Pick between Progress Bar and Total (More details on types of rollup columns below)
- Select a work item type or a Backlog level for the descendant items
-
Select the aggregation type: count of work items or sum of field. For sum also select the field to summarize.
![]()
How to read a rollup column?
Let’s explore an example using the image below: 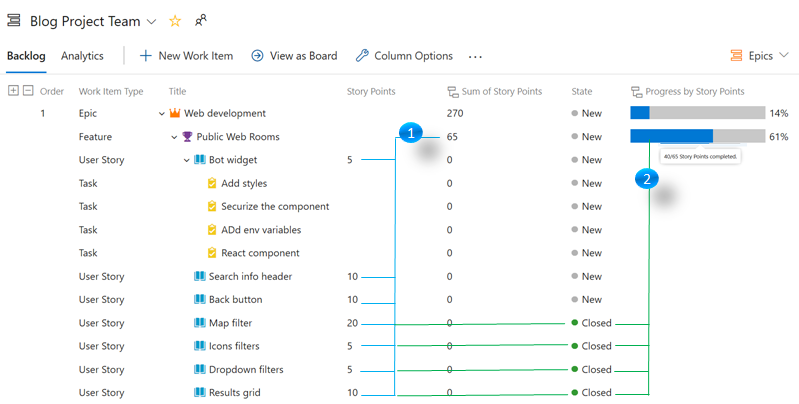
- The “Sum of Story Points” column for the “Public Web Rooms” Feature is 65 based on the Story Points of the linked User Stories. Note that the same rollup column for the User Stories themselves is showing 0 because they don’t have items with Story Points linked as children.
- The “Progress by Story Points” column is indicating that 61% of the Story Points were completed (40/65).
Types of rollup columns
There are two types of rollup columns you can add. Progress rollup and Total rollup. Each serves a different scenario.
-
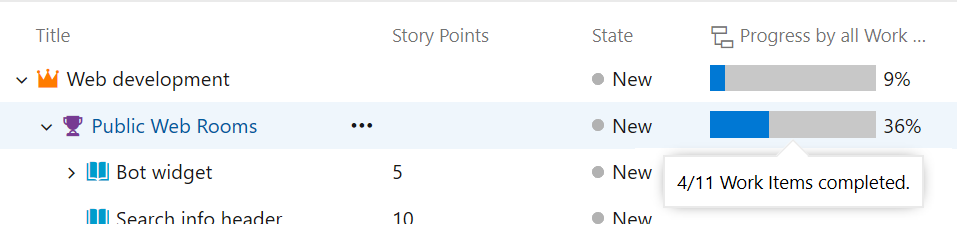
Progress is based on the state of the linked items. This column presents the percentage of completed linked items as a progress bar. Hovering over the bar shows the details of the calculation. For example, if you choose “Progress by all Work Items” then a tooltip will tell you the count of items completed out of all the linked items.
![]()
-
Totals are state agnostic and can be used to estimate size. For example, let’s imagine that your team breaks Epics into Features, and Features into User Stories. If you add the “Total by Count of User Stories” column to the Epics backlog, next to each Epic you’ll see the number of User Stories linked to it. This is an easy way to compare the size of two Epics in terms of engineering work (assuming the team has good practices on breaking down work evenly). Notice that in this example User Stories are actually the “Grandchildren” of the Epic.
![]()

Important notes when using rollup columns
-
The “Progress by all Work Items” column includes all the descendant items, including custom work item types. For example, for an Epic, it will count all the Features, User Stories, and Tasks.
-
If you update a large amount of items from the backlog or your project has a lot of updates going on, you might experience a delay when refreshing rollup columns. If we can’t present accurate data you will see an error indicating the last time data was ingested into the Analytics service. Read more about Rollup latency.
-
The “Progress based on Sum of Remaining work” column assumes the remaining work is set to 0 for any linked items that are closed. Even if the actual value of Remaining work is greater than
-
Linking between projects is not supported. Rollup is only calculated based on linked items from the same project.
-
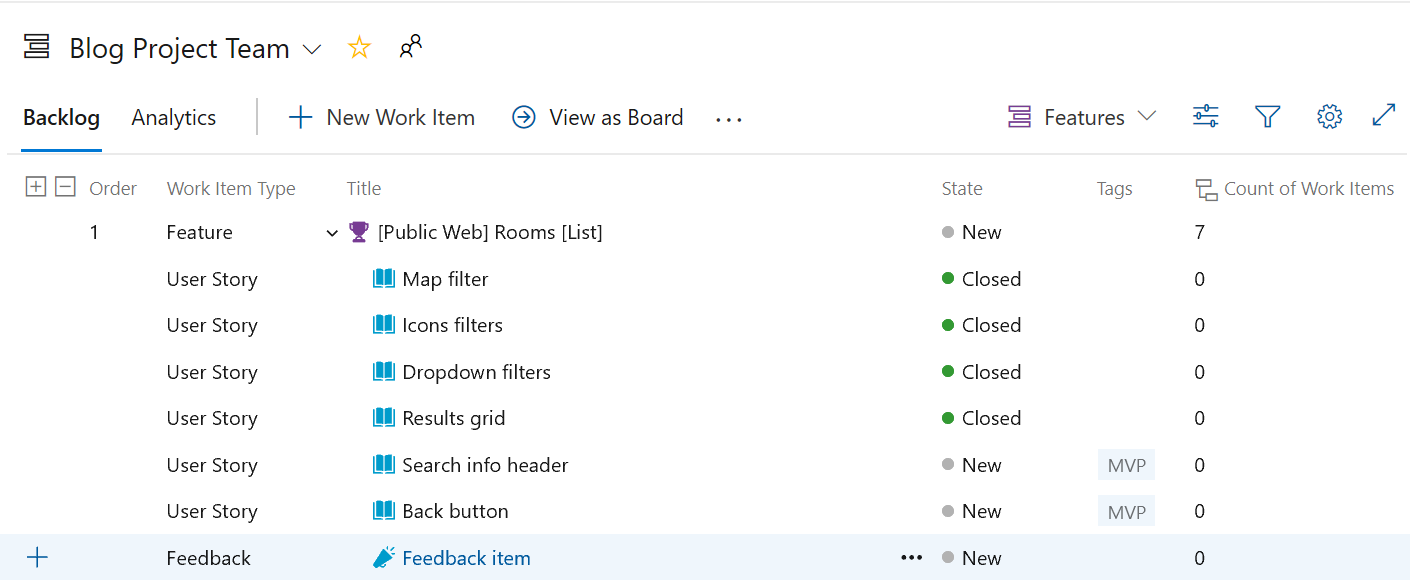
Rollup is always calculated based on the descendant links. Even if your view is not showing all the descendant items, rollup will take them into account. For example, in the image below we added “Total – Count of Work items” as a column. The Feature has 7 items, 6 User Stories and 1 Feedback item. Even if we filter the backlog to only show User Stories, the rollup column would still show 7 items. If the numbers don’t add up we recommend checking the parents linked items panel in the work item form.
![Filters don't imapct Rollup calculation]()
Keep providing great feedback
Rollup was one of the community’s top requests. Post your feedback in the comments below or through the Developer community.
The post Track the progress of work using Rollup columns appeared first on Azure DevOps Blog.