Quantcast
Channel: Category Name
Viewing all 5971 articles
Browse latest View live

Quest powers Spotlight Cloud with Azure

$
0
0

This blog post was co-authored by Liz Yu (Marketing), Bryden Oliver (Architect), Iain Shepard (Senior Software Engineer) at Spotlight Cloud, and Deborah Chen (Program Manager), Sri Chintala (Program Manager) at Azure Cosmos DB.


Spotlight Cloud is the first built on Azure database performance monitoring solution focused on SQL Server customers. Leveraging the scalability, performance, global distribution, high-availability, and built-in security of Microsoft Azure Cosmos DB, Spotlight Cloud combines the best of the cloud with Quest Software’s engineering insights from years of building database performance management tools.

As a tool that delivers database insights that lead customers to higher availability, scalability, and faster resolution of their SQL solutions, Spotlight Cloud needed a database service that provided those exact requirements on the backend as well.

Using Azure Cosmos DB and Azure Functions, Quest was able to build a proof of concept within two months and deploy to production in less than eight months.

“Azure Cosmos DB will allow us to scale as our application scales. As we onboard more customers, we value the predictability in terms of performance, latency, and the availability we get from Azure Cosmos DB.”

- Patrick O’Keeffe, VP of Software Engineering, Quest Software

Spotlight Cloud requirements

The amount of data needed to support a business continually grows. As data scales, so does Spotlight Cloud, as it needs to analyze all that data. Quest’s developers knew they needed a highly available database service with the following requirements and at affordable cost:

  • Collect and store many different types of data and send it to an Azure-based storage service. The data comes from SQL Server DMVs, OS performance counter statistics, SQL plans, and other useful information. The data collected varies greatly in size (100 bytes to multiple megabytes) and shape.
  • Accept 1,200 operations/second on the data with the ability to continue to scale as more customers use Spotlight Cloud.
  • Query and return data to aid in the diagnosis and analysis of SQL Server performance problems quickly.

After a thorough evaluation of many products, Quest chose Azure Functions and Azure Cosmos DB as the backbone of their solution. Spotlight Cloud was able to leverage both Azure Function apps and Azure Cosmos DB to reduce cost, improve performance, and deliver a better service to their customers.

Solution

Diagram displaying data flow in Spotlight Cloud

Part of the core data flow in Spotlight Cloud. Other technologies used, not shown, include Event Hub, Application Insights, Key Vault, Storage, DNS.

The core data processing flow within Spotlight Cloud is built on Azure Functions and Azure Cosmos DB. This technology stack provides Quest with the high scale and performance they need.

Scale


Ingest apps handle >1,000 sets of customer monitoring data per second. To support this, Azure Functions consumption plan auto-scales up to 100s of VMs automatically.

Azure Cosmos DB provides guaranteed throughput for database and containers, measured in Request Units / second (RU/s), and backed by SLAs. By estimating the required throughput of the workload and translating it to RU/s, Quest was able to achieve predictable throughput of reads and writes against Azure Cosmos DB at any scale.

Performance


Azure Cosmos DB handles the write and read operations for Spotlight’s data at < 60 milliseconds. This enables customers’ SQL Server data to be quickly ingested and available for analysis in near real time.

High availability


Azure Cosmos DB provides 99.999% high availability SLA for reads and writes, when using 2+ regions. Availability is crucial for Spotlight Cloud’s customers, as many are in the healthcare, retail, and financial services industries and cannot afford to experience any database downtime or performance degradation. In the event a failover is needed, Azure Cosmos DB does automatic failover with no manual intervention, enabling business continuity.

With turnkey global distribution, Azure Cosmos DB handles automatic and asynchronous replication of data between regions. To take full advantage of their provisioned throughput, Quest designated one region to handle writes (data ingest) and another for reads. As a result, users’ read response times are never impacted by the write volume.

Flexible schema


Azure Cosmos DB accepts JSON data of varying size and schema. This enabled Quest to store a variety of data from diverse sources, such as SQL Server DMVs, OS performance counter statistics, etc., and removed the need to worry about fixed schemas or schema management.

Developer productivity


Azure Functions tooling made the development and coding process very smooth, which enabled developers to be productive immediately. Developers also found Azure Cosmos DB’s SQL query language to be easy to use, reducing the ramp-up time.

Cost


The Azure Functions consumption pricing model charges only for the compute and memory each function invocation uses. Particularly for lower-volume microservices, this lets users operate at low cost. In addition, using Azure Functions on a consumption plan gives Quest the ability to have failover instances on standby at all times, and only incur cost if failover instances are actually used.

From a Total Cost of Ownership (TCO) perspective, Azure Cosmos DB and Azure Functions are both managed solutions, which reduced the amount of time spent on management and operations. This enabled the team to focus on building services that deliver direct value to their customers.

Support

Microsoft engineers are directly available to help with issues, provide guidance and share best practices

With Spotlight Cloud, Quest’s customers have the advantage of storing data in Azure instead of an on-premises SQL Server database. Customers also have access to all the analysis features that Quest provides in the cloud. For example, a customer can investigate the SQL workload and performance on their SQL Server in great detail to optimize the data and queries for their users - all powered by Spotlight Cloud running on top of Azure Cosmos DB.

"We were looking to upgrade our storage solution to better meet our business needs. Azure Cosmos DB gave us built-in high availability and low latency, which allowed us to improve our uptime and performance. I believe Azure Cosmos DB plays an important role in our Spotlight Cloud to enable customers to access real-time data fast."

- Efim Dimenstein, Chief Cloud Architect, Quest Software

Deployment Diagram of Spotlight Cloud’s Ingest and Egress app

Deployment Diagram of Spotlight Cloud’s Ingest and Egress app

Diagram above explained. Data is routed to an available ingest app by the Traffic Manager. The Ingest app writes data into the Azure Cosmos DB write region. Data consumers are routed via Traffic Manager to Egress app, which then reads data from the Azure Cosmos DB read region.

Learnings and best practices

In building Spotlight Cloud, Quest gained a deep understanding into how to use Azure Cosmos DB in the most effective way: 


Understand Azure Cosmos DB’s provisioned throughput model (RU/s)


Quest measured the cost of each operation, the number of operations/second, and provisioned the total amount of throughput required in Azure Cosmos DB.

Since Azure Cosmos DB cost is based on storage and provisioned throughput, choosing the right amount of RUs was key to using Azure Cosmos DB in a cost effective manner.

Choose a good partition strategy


Quest chose a partition key for their data that resulted in a balanced distribution of request volume and storage. This is critical because Azure Cosmos DB shards data horizontally and distributes total provisioned RUs evenly among the partitions of data.

During the development stage, Quest experimented with several choices of partition key and measured the impact on the performance. If a partition key strategy was unbalanced, a workload would require more RUs than with a balanced partition strategy.

Quest chose a synthetic partition key that incorporated Server Id and type of data being stored. This gave a high number of distinct values (high cardinality), leading to an even distribution of data - crucial for a write heavy workload.

Tune indexing policy


For Quest’s write-heavy workload, tuning index policy and RU cost on writes was key to achieving good performance. To do this, Quest modified the Azure Cosmos DB indexing policy to explicitly index commonly queried properties in a document and exclude the rest. In addition, Quest included only a few commonly used properties in the body of the document and encoded the rest of the data into a single property.

Scale up and down RUs based on data access pattern


In Spotlight Cloud, customers tend to access recent data more frequently than the older data. At the same time, new data continues to be written in a steady stream, making it a write-heavy workload.

To tune the overall provisioned RUs of the workload, Quest split the data into multiple containers. A new container is created regularly (e.g. every week to a few months) with high RUs, ready to receive writes.

Once the next new container is ready, the previous container’s RUs is reduced to only what is required to serve the expected read operations. Writes are then directed to the new container with high number of RUs.

Tour of Spotlight Cloud’s user interface

Tour of Spotlight Cloud’s user interface

About Quest

Quest has provided software solutions for the fast paced world of enterprise IT since 1987. They are a global provider to 130,000 companies across 100 countries, including 95 percent of the Fortune 500 and 90% of the Global 1000.

Find out more about Spotlight Cloud on Twitter, Facebook, and LinkedIn.


Understanding HDInsight Spark jobs and data through visualizations in the Jupyter Notebook

$
0
0

The Jupyter Notebook on HDInsight Spark clusters is useful when you need to quickly explore data sets, perform trend analysis, or try different machine learning models. Not being able to track the status of Spark jobs and intermediate data can make it difficult for data scientists to monitor and optimize what they are doing inside the Jupyter Notebook.

To address these challenges, we are adding cutting edge job execution and visualization experiences into the HDInsight Spark in-cluster Jupyter Notebook. Today, we are delighted to share the release of the real time Spark job progress indicator, native matplotlib support for PySpark DataFrame, and the cell execution status indicator.

Spark job progress indicator

When you run an interactive Spark job inside the notebook, a Spark job progress indicator with a real time progress bar appears to help you understand the job execution status. You can also switch tabs to see a resource utilization view for active tasks and allocated cores, or a Gantt chart of jobs, stages, and tasks for the overall workload.

Spark job progress indicator_thumb[2]

Native matplotlib support for PySpark DataFrame

Previously, PySpark did not support matplotlib. If you wanted to plot something, you would first need to export the PySpark DataFrame out of the Spark context, convert it into a local python session, and plot from there. In this release, we provide native matplotlib support for PySpark DataFrame. You can use matplotlib directly on the PySpark DataFrame just as it is in local. No need to transfer data back and forth between the cluster spark context and the local python session.

Native matplotlib support for PySpark DataFrame_thumb[2]

Cell execution status indicator

Step-by-step cell execution status is displayed beneath the cell to help you see its current progress. Once the cell run is complete, an execution summary with the total duration and end time will be shown and kept there for future reference.

Cell execution status indicator_thumb[4]

Getting started

These features have been built into the HDInsight Spark Jupyter Notebook. To get started, access HDInsight from the Azure portal. Open the Spark cluster and select Jupyter Notebook from the quick links.

Feedback

We look forward to your comments and feedback. If you have any feature requests, asks, or suggestions, please send us a note to cosctcs@microsoft.com. For bug submissions, please open a new ticket.

For more information, check out the following:

Accelerate supercomputing in the cloud with Cray ClusterStor

$
0
0

We’re excited to announce Cray ClusterStor in Azure, a dedicated solution to accelerate data processing of the most complex HPC jobs running in Azure.

Microsoft and Cray are in an exclusive partnership to provide customers with unprecedented access to supercomputing capabilities in Azure and leverage the cloud to modernize how HPC is done.

Cray® ClusterStor™ in Azure

The new Cray® ClusterStor™ in Azure storage system is a high capacity and high throughput storage solution to accelerate your HPC simulations. It is a bare metal appliance that is fully integrated in the Azure fabric and accessible by a large selection of other Azure services.

HPC simulations continue to demand more from storage, including more performance AND more capacity, and this imperative remains a key requirement for high-performance workloads in the cloud.

Cray® ClusterStor™ in Azure offers a Lustre-based, single-tenant, bare metal and fully managed HPC environment in Microsoft Azure. It can be used with Cray XC and CS series supercomputers and also now supports data processing of HPC jobs executed on H-series virtual machines from Azure. You can move your data within Azure from high-performance scratch, to warm Azure blob storage and cold archive storage. You get access to high performance and capacity during simulation and move post-simulation data to a redundant, less-expensive cloud storage solution, to either be easily distributed or made available for your next simulation.

Cray® ClusterStor™ in Azure comes with competitive pricing and performance, enabling more than 3 times the throughput in GB/sec per Lustre Object Storage Servers (OSS) than the currently available Lustre offer.

Learn more

In addition to the new ClusterStor in Azure offer, Cray and Microsoft are also announcing two new offers dedicated to the Manufacturing and EDA industries.

If you are interested in learning more about these three offers:

  • Please contact your Microsoft account manager or email us directly at azurecray@microsoft.com. We can take you through a deep dive on the offers and understand how we can customize them to your needs.
  • Get access to our Sentinel POC environment, where you can test the offer and get a “hands on” experience of this unique platform.

Cray in Azure

Redesigning the New Project Dialog

$
0
0

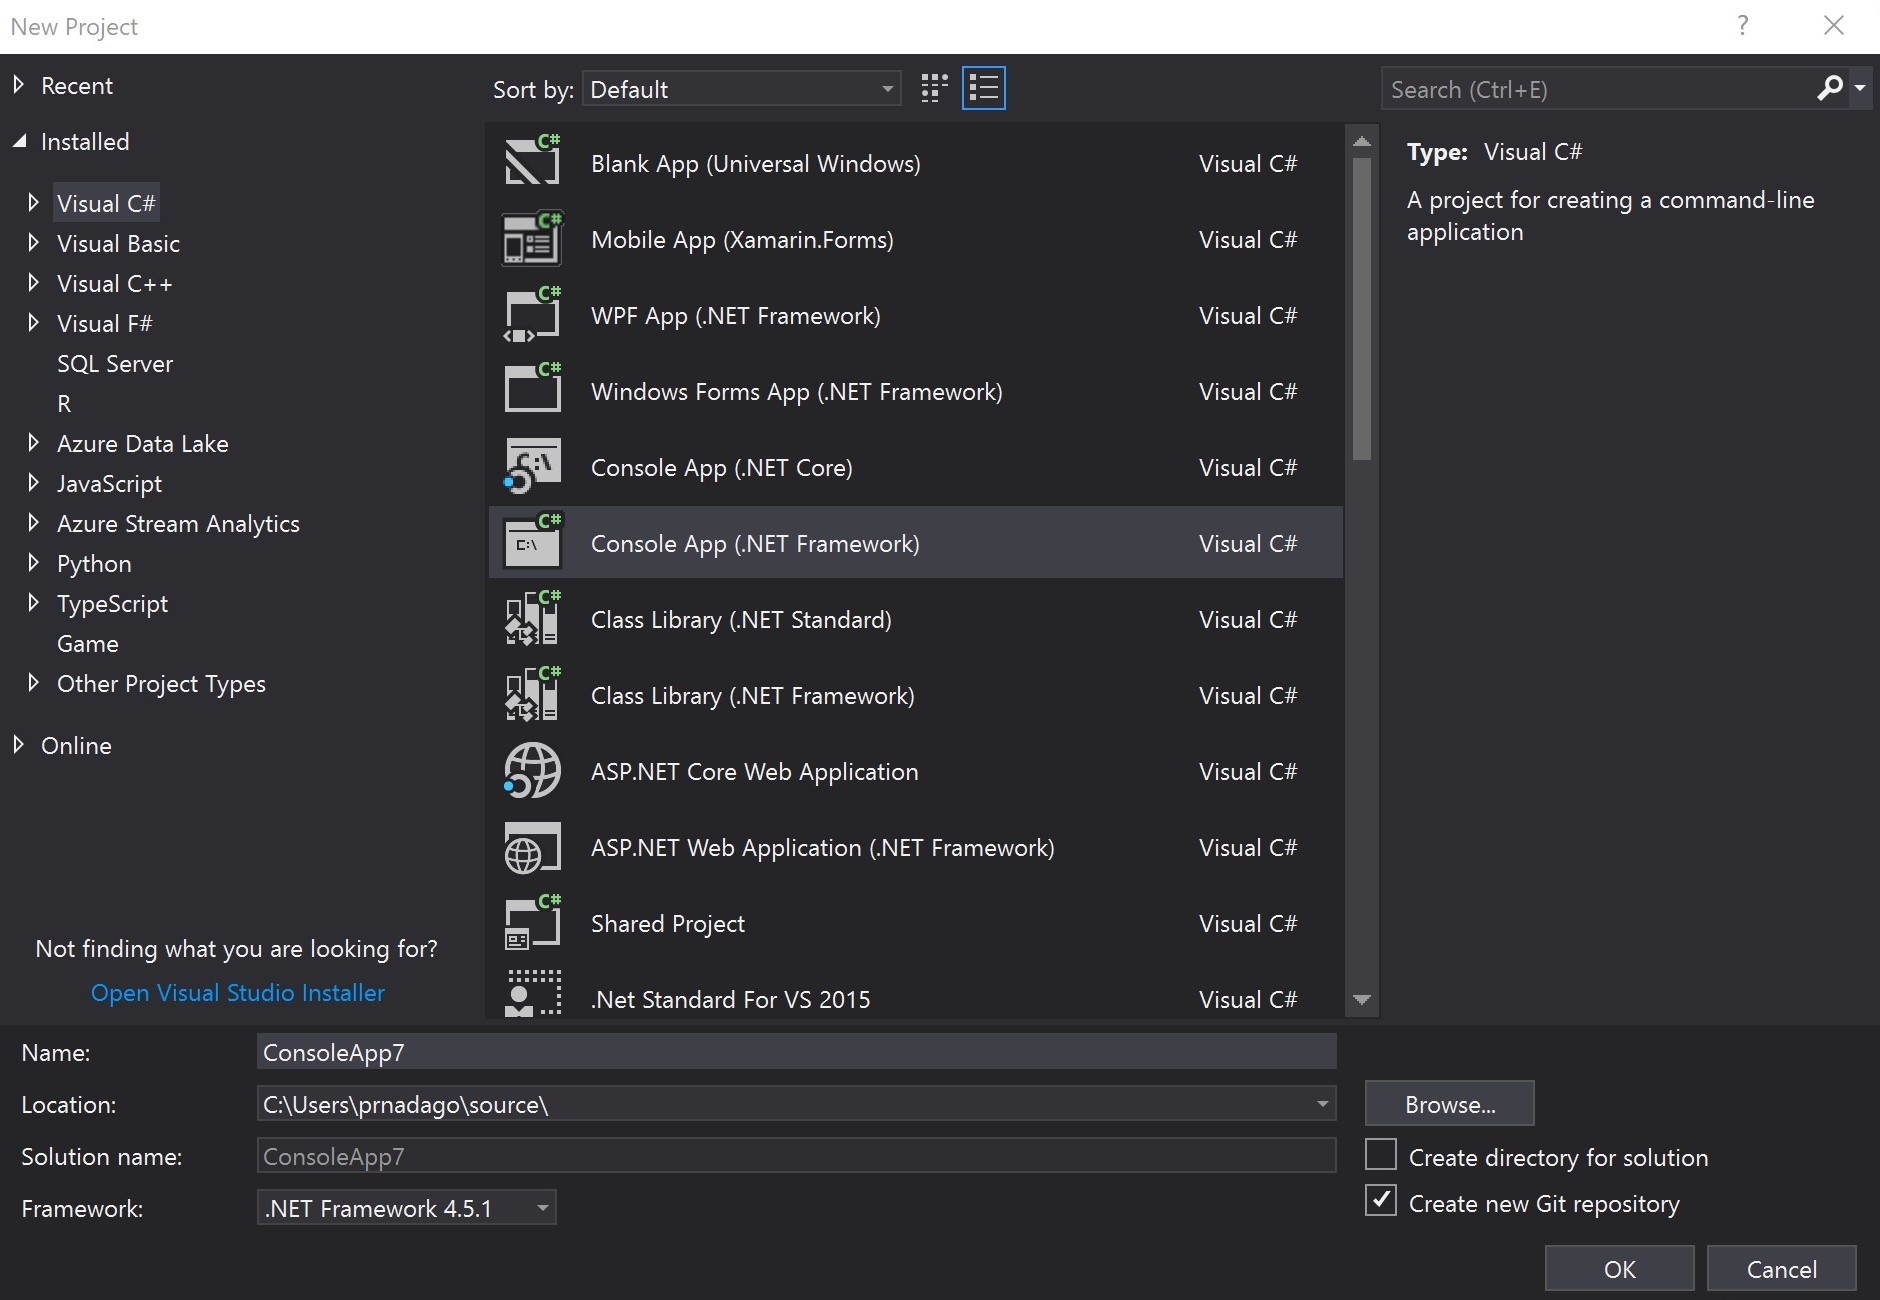
Last week, we released Visual Studio 2019 version 16.1 Preview 2. If you have the latest update – awesome and thank you. If not, you can download it from the link above. Or, if you already have the Preview, just click the notification bell inside Visual Studio to update. This post discusses one of the most visible interface changes we’ve made in Visual Studio 2019 – the New Project Dialog.

Motivation

In Visual Studio 2019, one of our main objectives was to help you (both new and experienced developers) get to your code faster. You can read more about this journey in the blog post that discussed the new start window. One of the most common ways to start coding in Visual Studio is to create a new project.

The dialog hadn’t changed much since 2010, and the interaction model between folders and items has been in place since Visual Studio .NET back in 2002. We hadn’t put much time into the New Project Dialog because we believed it largely served its purpose. Until recently, we didn’t have the telemetry in place to be able to analyze how this dialog was used. Our initial hypothesis was that most of you interacted with the dialog rarely. And instead you spend much more time modifying projects you had previously created. After a bit of user research and analysis, we found that the latter holds true. But we were quite mistaken about the former. Many of you use the dialog to create new projects to try out new things or add on functionality to existing solutions a lot more often than we thought.

User research

We then dove deeper into the data, particularly looking at the usage patterns from new users of Visual Studio. We found that there was a surprisingly large drop-off in usage after launching Visual Studio to opening a project to start coding. That led us to the hypothesis that the New Project Dialog might be somehow inhibiting success with the tool. So, we expanded our user research and gathered that this dialog was presenting you with too many concepts, choices, and decisions. The process of getting started with your code wasn’t straightforward enough. The hierarchy of the nodes wasn’t consistent. When you installed several workloads you would see too many languages and technologies presented at the top level. Further down into the second and third level of nodes, the taxonomy became quite unmanageable with differences in naming conventions of categories.

When we asked participants in our usability studies to search for code scaffolding to get started with certain types of projects. We saw them click around through the top level nodes, and not click through the hierarchy. Sometimes they completely ignored the structure on the left and focused just on the default list of templates in front of them. What surprised us was that even for experienced developers, some of the options weren’t intuitive. Most couldn’t pinpoint the link to ‘Open Visual Studio Installer’ when the templates they were looking for weren’t available. They glazed over the search box without interacting with it. They seemed to completely ignore the recent templates list. And when they finally selected a template, they lacked confidence in their choice.

In addition, we learned that most of you think about your app type first but there are some who think about languages first when finding templates to start coding. It became clear that this mixed structure wasn’t intuitive for either use case. The barrier to the first actions within Visual Studio was too high. And this was a problem that small UI tweaks weren’t going to solve.

Design principles

During the design and development of Visual Studio 2019, we looked at usage across different areas of the project creation process and honed down on a core design goal –

“Get to code quickly with the minimum necessary scaffolding and help developers configure their application with the right settings”

Remove unnecessary choices

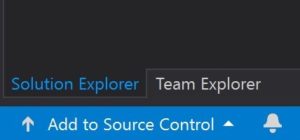
There were several options in the dialog box that we sought to remove as a way of simplifying the set of decisions you had to make. We first cleared out the rarely used toggles to sort templates and change icon size. The checkbox to create a git repository provided little value when creating a project. Our research told us that the right step for git init was either before project creation when you create the local folder or after project creation when you know you want to move ahead with the project. You can now do this in one click through the ‘Add to Source Control’ button in the bottom right of the status bar.

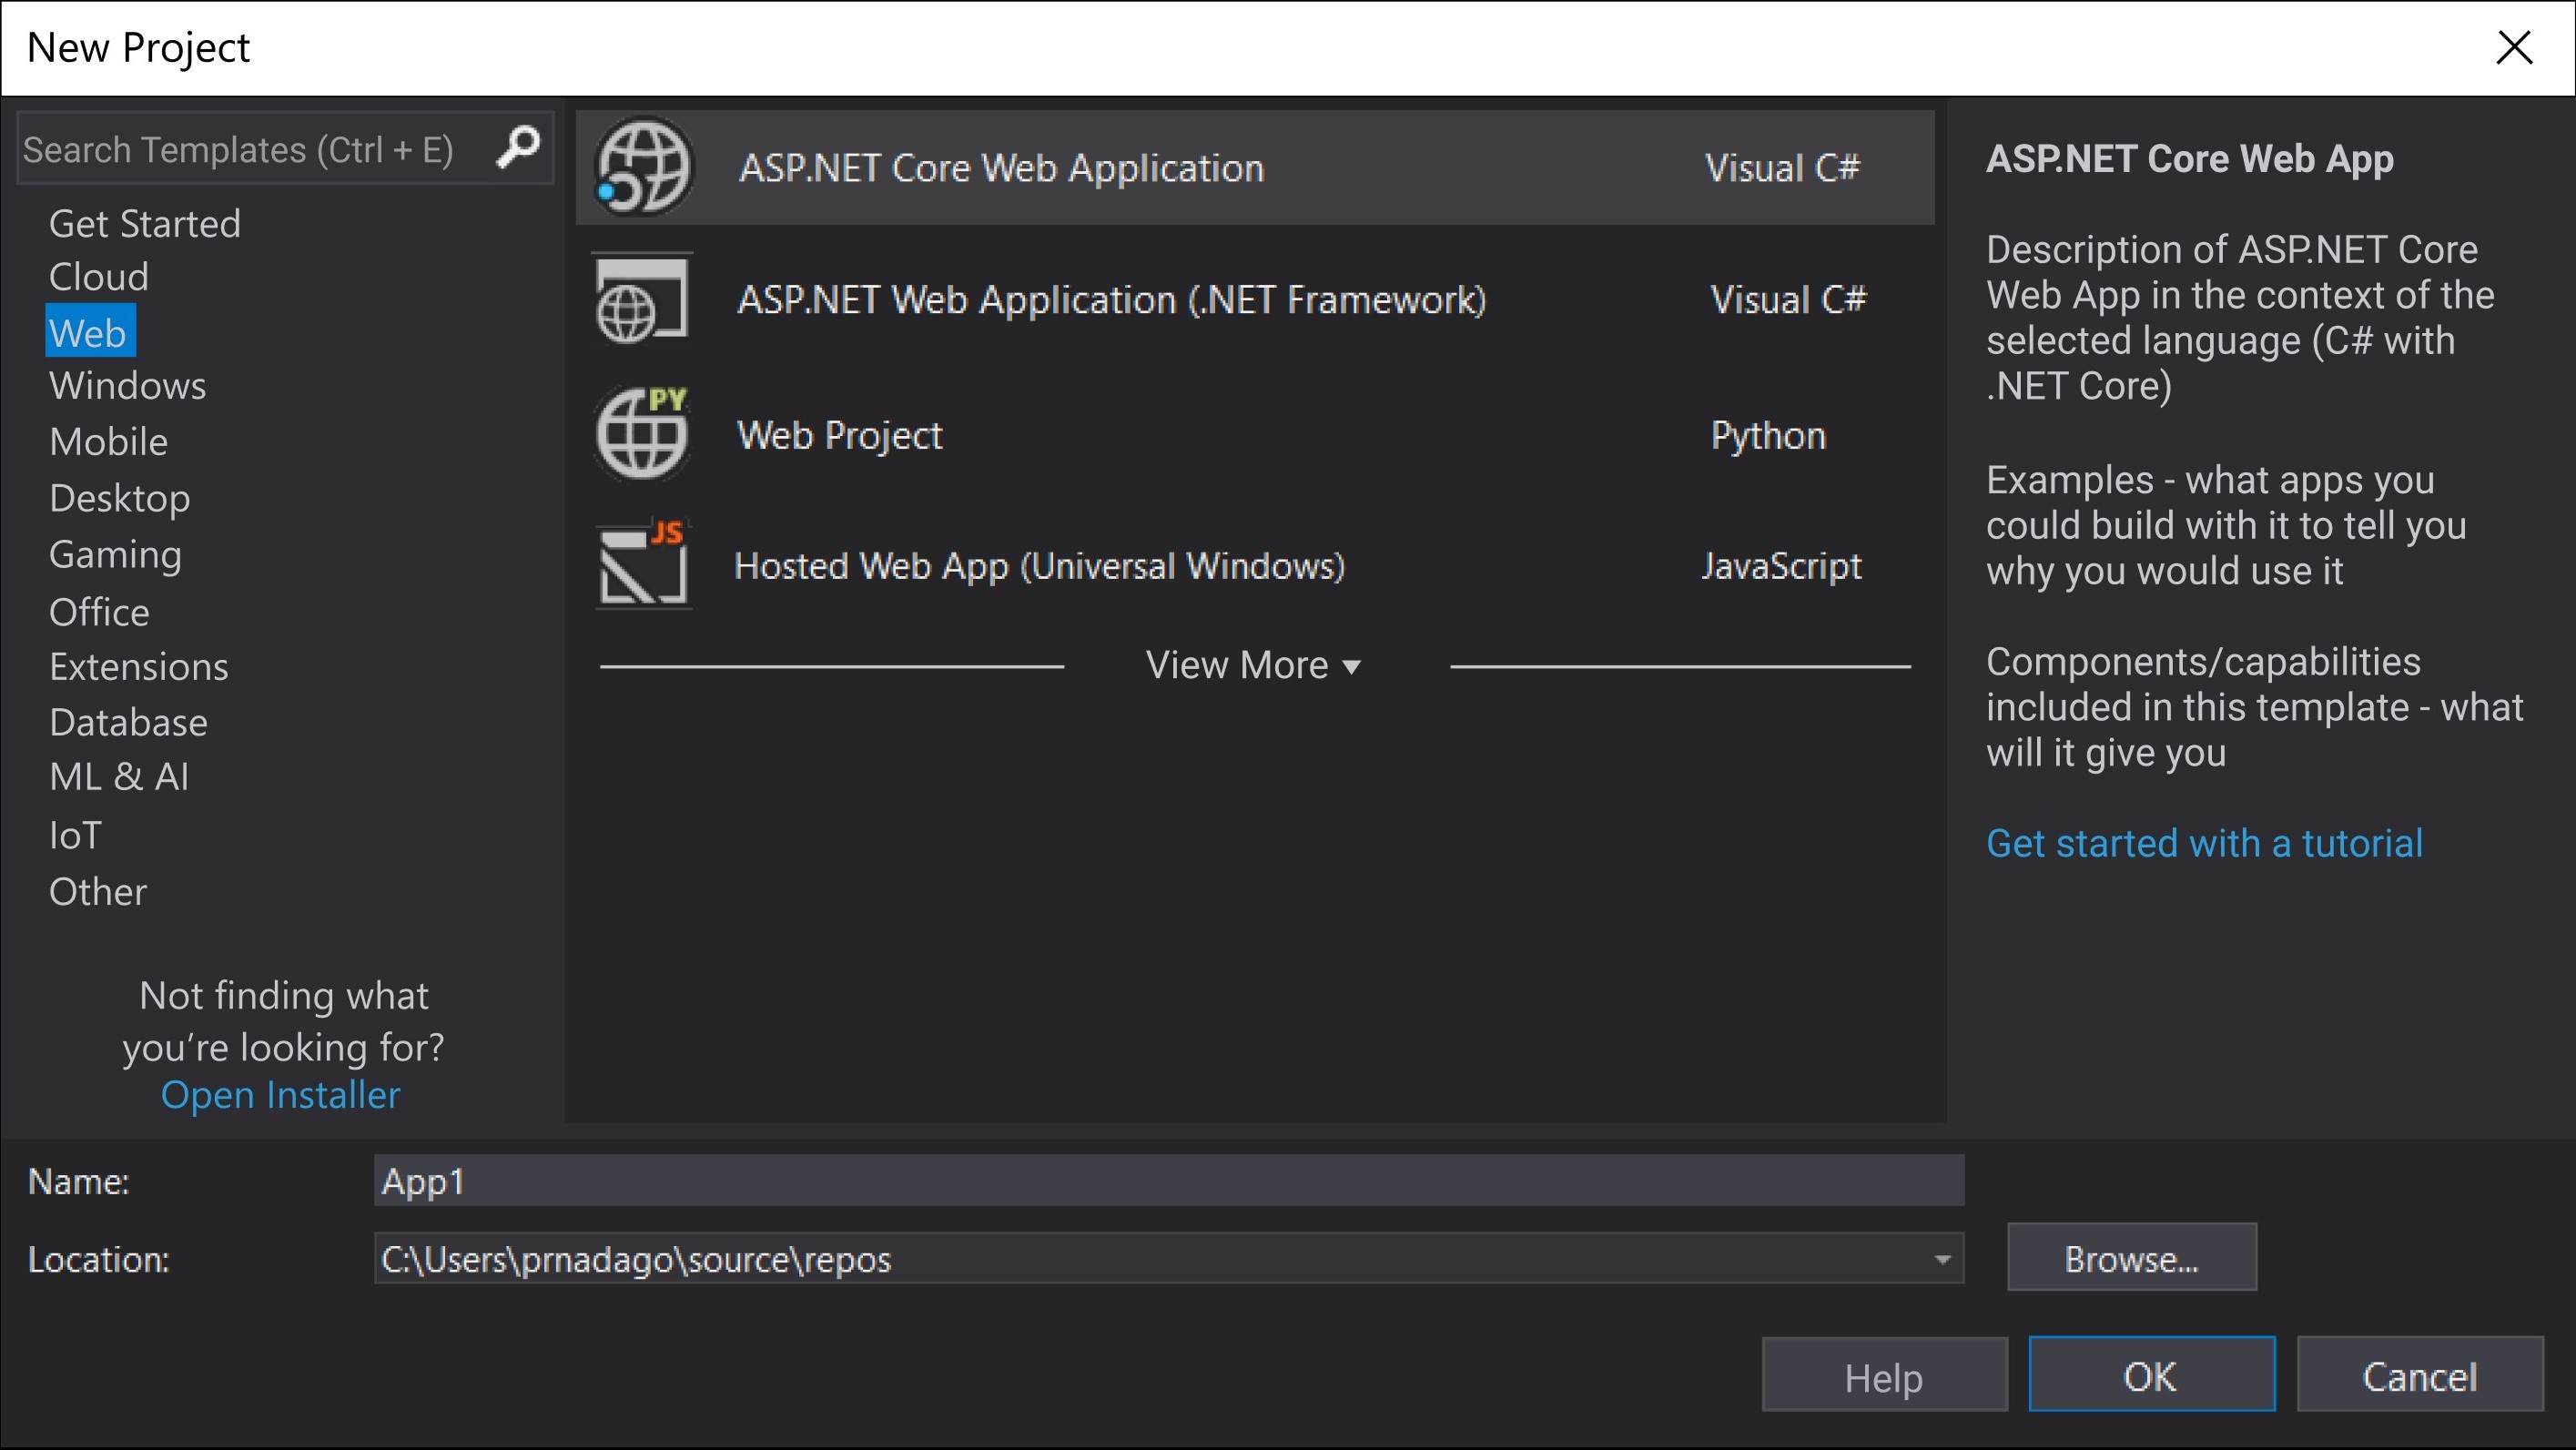
The last option to go was the ability to view and download online extension templates through the dialog. You can also do this through the Manage Extensions dialog in the Extensions menu. So, we eliminated the duplicate behavior to reduce cognitive load while looking for templates. After all that, our design looked something like this:

Search-first

But through design studies we found that this still wouldn’t lead to success. The node structure was still too convoluted to be understandable in early usage. We initially wanted to flatten the tree so that there was less digging and clicking to do. But we soon realized that with the overabundance of supported project types, it was an exercise in futility coming up with a single taxonomy that supported every single template. So, we decided to fundamentally shift the way users could discover templates. The search box had low usage in the old dialog box because its position made it a secondary function. But search is a prominent discoverability mechanism across the industry. So, we wanted to improve the way Visual Studio utilized search to help find what you need.

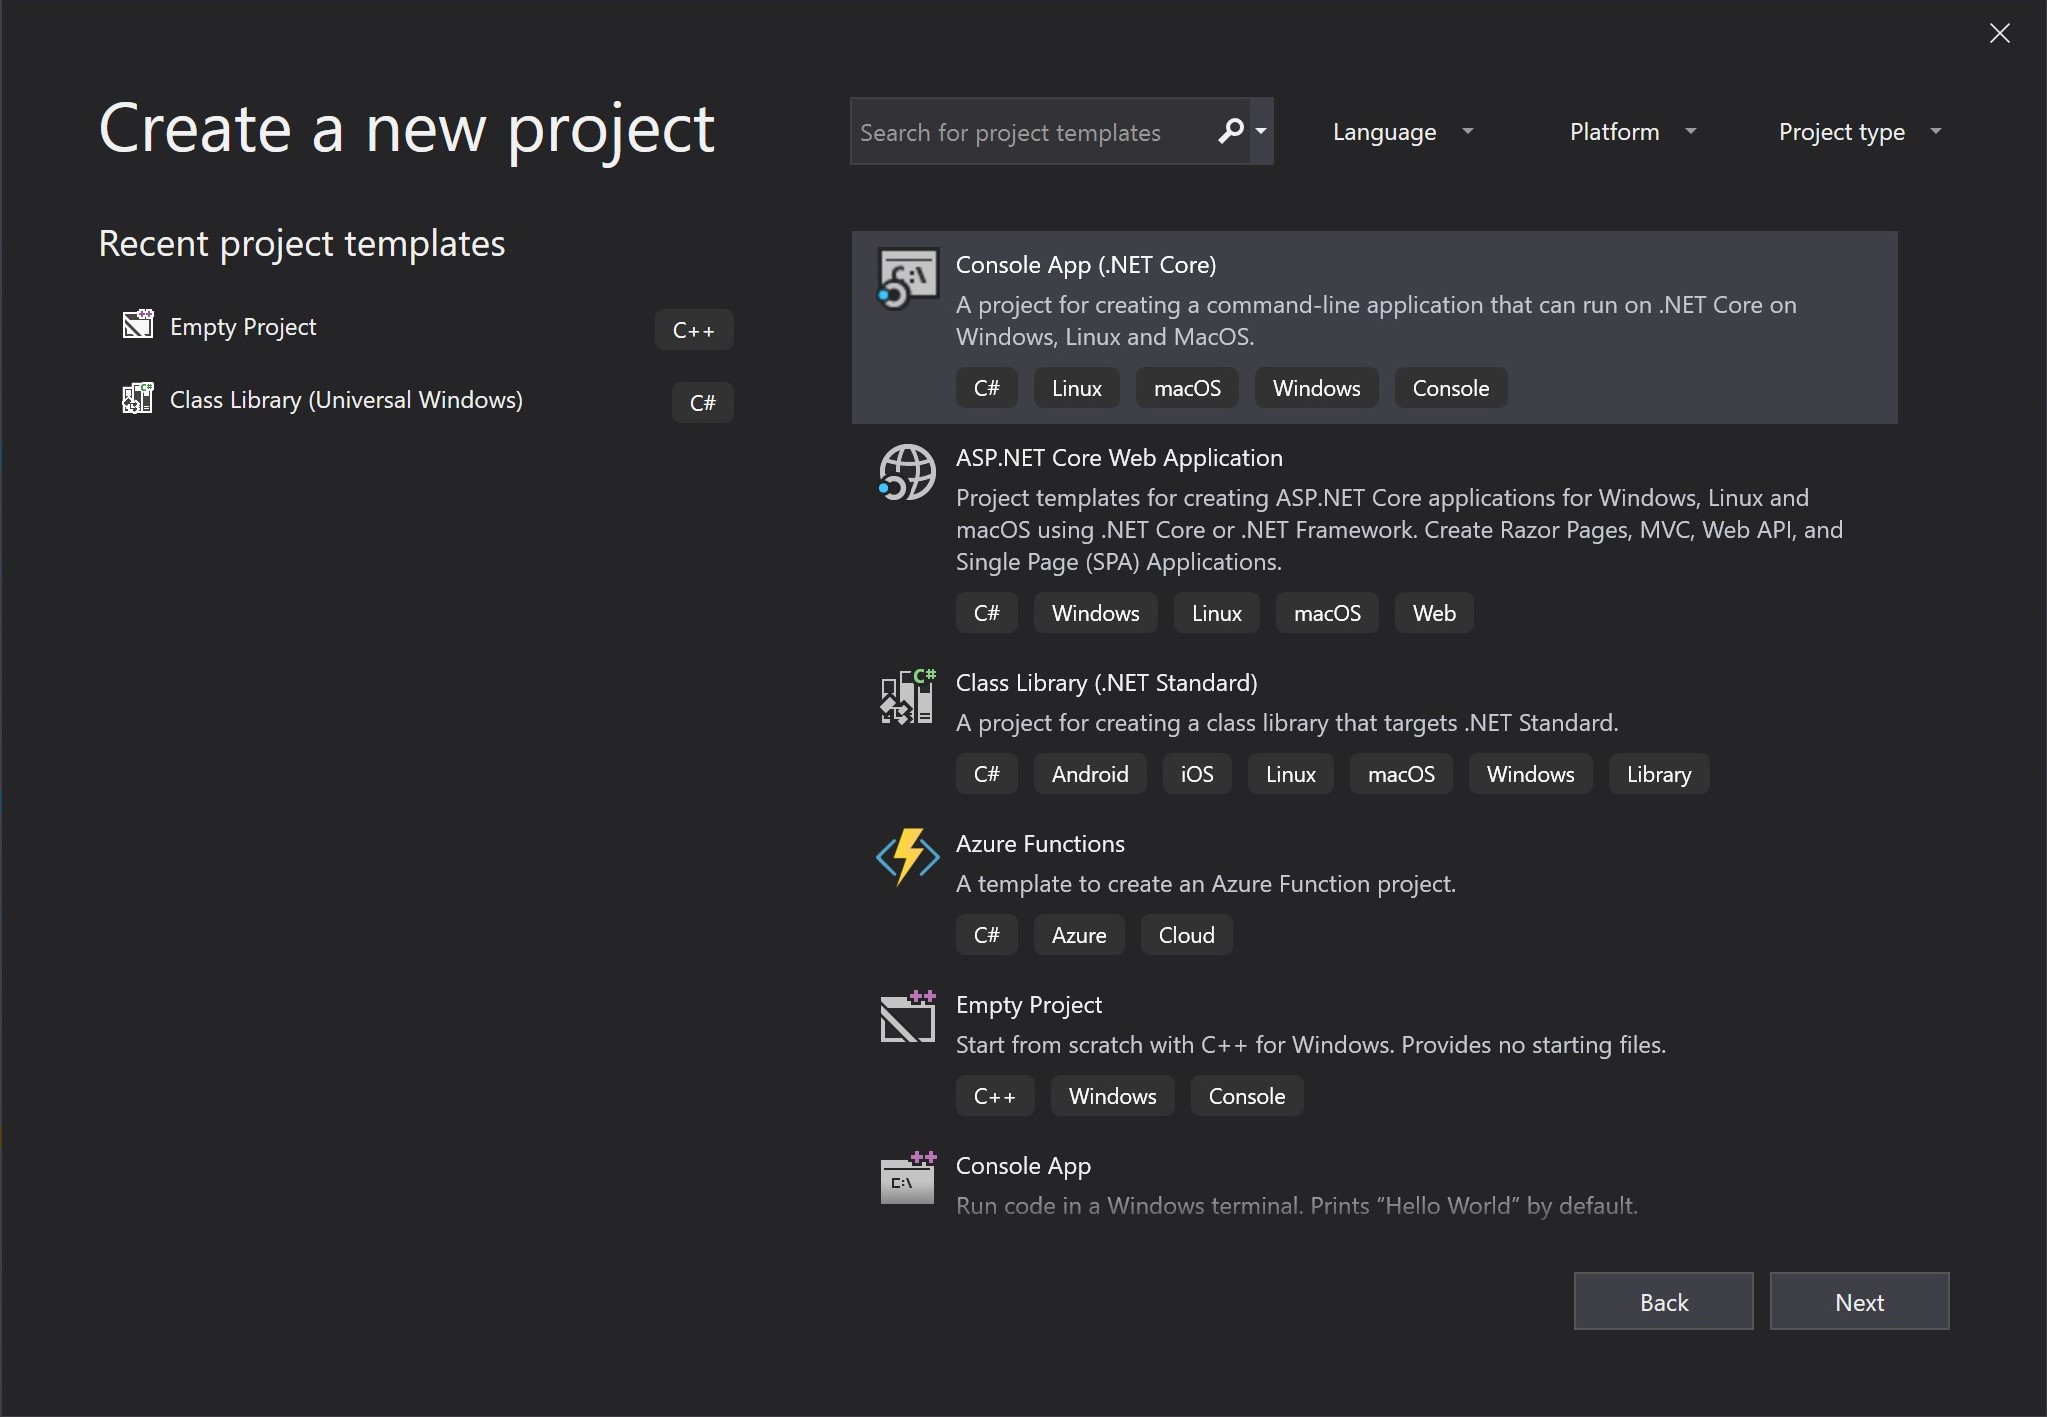
Our early studies saw participants gravitating towards the search box when we changed its position. But there was still a slight hesitation before typing something in – “what do I search for?”. This led to the realization that search cannot be a catch all, and there needs to be a little more guidance. We took the values we knew from the old dialog’s node structure and saw that they roughly fell into three categories – ‘languages’, ‘platforms’, and the more vague ‘project types’. So we introduced filters and tags as secondary mechanisms to support search. Browsing through the tags in the template list will help you discover the different capabilities of Visual Studio based on the tool-sets installed in your instance. Setting filters will allow you to narrow down the list to your preferred choices when starting with a new project.

One decision at a time

We also broke up the process into two separate screens. There is a single decision point on the first screen – select a template. And all the interface elements direct you to make that choice. The second screen is all about providing details about the project type you’ve selected. You can modify the values here or move through the project configuration screen without changing anything since all the recommended defaults are set for you. Some of the more complex project templates then open a third screen which has custom options specific to that project type.

Looking at the template list itself, we made a point to sort this list by our most recommended project templates for the workloads you have installed. So, the template that you should select if you aren’t exactly sure what to do would be the one placed higher in the list. We found that most of you don’t use more than 10 different types of templates, so we’ve made the recent templates list even more prominent than it was in Visual Studio 2017, so that you can get to your most common templates without having to search for them.

Looking forward

This is the first iteration of a new design paradigm we’re trying to adopt for Visual Studio. We’ve been measuring adoption and engagement since the launch of Visual Studio 2019 earlier this month and we’re happy to see a significant increase in success rate through the get to code journey. But at the same time, we acknowledge that the evolution of the experience isn’t over just yet. We’re continuing to listen to your feedback and learning from you to ensure success. We’re on the path to make improvements to search and filtering as they are now the key functionality to finding the right templates. In addition, we recently built in the ability to add tags to your own custom templates. If you’re a template author, find out more on how to update your templates in this blog post. We released this functionality as the result of your direct feedback, and we thank you for it. But we are looking to do better and could use more of your help. Please continue to share your feedback through the Visual Studio Developer Community.

The post Redesigning the New Project Dialog appeared first on The Visual Studio Blog.

Azure DevOps Roadmap update for 2019 Q2

$
0
0

Last week we published an update to the Features Timeline. The features listed below link to the public roadmap project where you can find more details about each item. Here are a few highlights on some of the features for Q2.

Azure Boards:

  • Instant search for work items

    You’ll be able to access your recently visited work items from the search box instead of having to navigate to the search results page. This will reduce the time it will take you to find your work items.

  • Display rollup on backlog

    In backlogs, you will have the option to add a new column to display rollup based on child work items. For example, an epic backlog can have a column to display the sum of story points of linked user stories.

Azure Repos:

  • Virtual Filesystem (VFS) for Git – Public Preview for macOS

    VFS for Git is an open source system that enables Git to operate at enterprise-scales. In Q2, we plan to add VFS for macOS to help you address the challenges of working with large repos.

  • Branch policies administration improvements – Public Preview

    Branch policies are powerful features of Azure Repos that help teams protect their branches. In Q2 we plan to ship improvements to the branch policies administration experience to make it easier for users to set policies for multiple branches and repos without having to navigate away from the branch policies administration page. We will also enable the capability to set a policy for all repositories in the same project.

Azure Pipelines:

  • Multistage pipelines

    We will expand the current single-stage YAML pipelines to support multiple stages with approvals. With this, you will be able to author the entire pipeline from build to release in code using YAML.

  • YAML templates for CI/CD

    We currently have a getting started experience for YAML-based pipelines. This experience analyzes the content of your repository and suggests one or more CI templates. It then generates the YAML code that you can commit to your repository. In Q2, we will enhance the experience to take the inputs needed to generate the multi-stage YAML pipeline.

  • Approval in YAML pipelines

    Instead of automatically moving a run from one stage to the next, you might want an approver to review it first. While approvals is a concept that already exists in release management, it does not yet exist in YAML pipelines. Config-as-code poses interesting challenges for where you specify approvals. We plan to make approvals a policy on the resource (agent pool, variable group, service connection, or secure file), and any stage that uses that resource will be paused for an approval.

  • Rerun failed stages in a multistage build

    When a stage fails in a multistage build, you will be able to rerun the failed stage without having to start from the beginning. You will also have the option of taking an older run that passed the failed stage and re-apply that stage.

  • Faster and flexible artifacts

    We’re replacing the build artifacts you use today with Pipeline Artifacts. This will provide a fast and integrated system for managing your pipelines. Some key features include:

    • Pipeline Artifacts come with new YAML syntax that makes it easy and quick to publish
    • Pipeline Artifacts only upload content that’s not already present somewhere in your organization, resulting in substantial performance improvements, especially for large artifacts
  • Enhanced pipeline failure and duration report

    You will be able to view a pipeline duration along with drill downs into the duration for jobs and their agent wait time. In addition, you will see the stage in a pipeline that is causing most failures along with insight about the tasks that are contributing to the maximum failures in the pipeline.

  • Hosted pools and visibility into concurrency usage

    Currently, you see multiple hosted pools and agent slots for each of the agent pools in your organization. We are updating the hosted pools experience to have a single agent pool. This will allow you to browse all the jobs running in that pool in a single place.

Azure Artifacts:

  • Public (unauthenticated) feeds

    Public feeds allow you to share your packages with anonymous users. If you’re creating pre-release or nightly packages as part of a CI/CD flow before publishing to the official package sources (nuget.org, etc.), you will be able to use public feeds to share them with all your collaborators.

  • Developer Community suggestions

    In Q2 we plan to deliver at least two of the most voted suggestions from the Developer Community. Changes will include expanded NuGet metadata and promote task in Pipelines.

  • Search across package feeds

    Search across package feeds will allow you to find any package in Azure Artifacts from a single query, rather than needing to filter each feed.

  • Universal Packages feature updates

    We’ll continue to invest in the Universal Packages platform, adding features that will include the following:

    • Showing the size of Universal Packages
    • APIs to download a Universal Package as an archive
    • Ability to get latest version of a package from CLI, using wildcards
    • Ability to partially download a Universal Package in the CLI

Administration:

  • Connect to Azure Active Directory (AAD), set up billing, and updated security and org settings

    We will continue to make it easier to administer Azure DevOps by adding improved experiences for connecting to AAD and setting up or modifying billing within Azure DevOps administration. We’re also addressing two of the top voted Developer Community posts by rolling out an improved security and organization settings and giving you the ability to change a project profile image from the Project Overview settings page.

  • Auditing in Azure DevOps

    The audit experience will provide a centralized location to review audit events raised in Azure DevOps. Audit logs will include actions that occur throughout an Azure DevOps organization. Some examples of actions are permission changes, resource deletion, code download, access, and much more. Initially, auditing will include events for security changes, project updates (rename, delete, and create), and auditing for the audit experience itself.

  • Pay for users once across organizations under the same Azure subscription

    Azure DevOps will move to a new model for per user billing. The new model ensures that you only pay once per user across organizations. This will simplify management, especially for large organizations.

Marketplace:

  • Publisher Certification

    We plan to ship a top publisher program designed to help you acquire extensions with confidence.  A top publisher icon will be displayed for a publisher once it meets our policies, adoption and support benchmarks.

We appreciate your feedback, which helps us prioritize. If you have new ideas or changes you’d like to see, provide a suggestion on the Developer Community or vote for an existing one.

The post Azure DevOps Roadmap update for 2019 Q2 appeared first on Azure DevOps Blog.

Using .NET and Docker Together – DockerCon 2019 Update

$
0
0

DockerCon 2019 is being held this week, in San Francisco. We posted a DockerCon 2018 update last year, and it is time to share how we’ve improved the experience of using .NET and Docker together over the last year.

We have a group of .NET Core team members attending the conference again this year. Please reach out @ dotnet@microsoft.com if you want to meetup.

Most of our effort to improve the .NET Core Docker experience in the last year has been focused on .NET Core 3.0. This is the first release in which we’ve made substantive runtime changes to make CoreCLR much more efficient, honor Docker resource limits better by default, and offer more configuration for you to tweak.

We are invested in making .NET Core a true container runtime. In past releases, we thought of .NET Core as container friendly. We are now hardening the runtime to make it container-aware and function efficiently in low-memory environments.

Allocate less memory and fewer GC heaps by default

The most foundational change we made is to reduce the memory that CoreCLR uses by default. If you think of the Docker limit as the denominator, then baseline memory usage is the numerator that you start with. It is critical to reduce that value to enable smaller memory limits. That’s exactly what we’ve done with .NET Core 3.0.

We reduced the minimal generation 0 GC allocation budget to better align with modern processor cache sizes and cache hierarchy. We found that the initial allocation size was unnecessarily large and could be significantly reduced without any perceivable loss of performance. In workloads we measured, we found tens of percentage points of improvements.

There’s a new policy for determining how many GC heaps to create. This is most important on machines were a low memory limit is set, but no CPU limit is set on a machine with many CPU cores. The GC now reserves a memory segment with a minimum size of 16 MB per heap. This limits the number of heaps the GC will create. For example, if you set a 160 MB memory limit on a 48-core machine, you don’t want 48 GC heaps created. That means that if you set a 160 MB limit, then only 10 GC heaps will be created. If CPU limits are not set, applications can still take advantage of all the cores on the machine.

We know that some developers use the workstation GC as a means of limiting GC allocations, with a possible reduction in throughput. With this new policy in place, we hope that you do not need to enable workstation GC with docker workloads.

Both changes — reducing generating 0 initial allocation size and defining a new GC heap minimum — results in lower memory usage by default and makes the default .NET Core configuration better in more cases.

Support for Docker Memory Limits

There are really two scenarios for memory limits:

  • setting an arbitrary memory limit (like say 750 MB)
  • setting a low memory limit (like say 75 MB)

In either case, you want your application to run reliably over time. Obviously, if you limit an application to run in less than 75 MB of memory, it needs to be capable of doing that. A container-hardened runtime is not a magic runtime! You need to model memory requirements in terms of both steady-state and per-request memory usage. An application that requires a 70 MB cache has to accommodate that.

Docker resource limits are built on top of cgroups, which is a Linux kernel capability. From a runtime perspective, we need to target cgroup primitives.

The following summary describes the new .NET Core 3.0 behavior when cgroup limits are set:

  • Default GC heap size: maximum of 20 MB or 75% of the cgroup memory limit on the container
  • Minimum reserved segment size per GC heap is 16 MB, which will reduce the number of heaps created on machines with a large number of cores and small memory limits

Though CGroups are a Linux concept, Job objects on Windows are a similar concept, and the runtime honors memory limits on Windows in the same way.

Over the last few releases, we have put a lot of effort into improving how .NET Core performs on the TechEmpower Benchmarks. With .NET Core 3.0, we found ways to significantly improve the performance and reduce the memory used by a large margin. We now run the TechEmpower plaintext benchmark in a container limited to about 150 MB, while servicing millions of requests per second. This enables us to validate memory limited scenarios every day. If the container OOMs, then that means we need to determine why the scenario is using more memory than we expect.

Note: Process APIs report inconsistent results in containers. We do not recommend relying on these APIs for containerized apps. We are working on resolving these issues. Please let us know if you rely on these APIs.

Support for Docker CPU Limits

CPU can also be limited; however, it is more nuanced on how it affects your application.

Docker limits enable setting CPU limits as a decimal value. The runtime doesn’t have this concept, dealing only in whole integers for CPU cores. Previously, the runtime used simple rounding to calculate the correct value. That approach leads the runtime to take advantage of less CPU than requested, leading to CPU underutilization.

In the case where --cpus is set to a value (for example, 1.499999999) that is close but not close enough to being rounded up to the next integer value, the runtime would previously round that value down (in this case, to 1). In practice, rounding up is better.

By changing the runtime policy to aggressively round up CPU values, the runtime augments the pressure on the OS thread scheduler, but even in the worst case scenario (--cpus=1.000000001 — previously rounded down to 1, now rounded to 2), we have not observed any overutilization of the CPU leading to performance degradation.

Unlike with the memory example, it is OK if the runtime thinks it has access to more CPU than it does. It just results on a higher reliance on the OS scheduler to correctly schedule work.

The next step is ensuring that the thread pool honors CPU limits. Part of the algorithm of the thread pool is computing CPU busy time, which is, in part, a function of available CPUs. By taking CPU limits into account when computing CPU busy time, we avoid various heuristics of the thread pool competing with each other: one trying to allocate more threads to increase the CPU busy time, and the other one trying to allocate less threads because adding more threads doesn’t improve the throughput.

Server GC is enabled by default for ASP.NET Core apps (it isn’t for console apps), because it enables high throughput and reduces contention across cores. When a process is limited to a single processor, the runtime automatically switches to workstation GC. Even if you explicitly specify the use of server GC, the workstation GC will always be used in single core environments.

Adding PowerShell to .NET Core SDK container Images

PowerShell Core has been added to the .NET Core SDK Docker container images, per requests from the community. PowerShell Core is a cross-platform (Windows, Linux, and macOS) automation and configuration tool/framework that works well with your existing tools and is optimized for dealing with structured data (e.g. JSON, CSV, XML, etc.), REST APIs, and object models. It includes a command-line shell, an associated scripting language and a framework for processing cmdlets.

PowerShell Core is released as a self-contained application by default. We converted it to a framework-dependent application for this case. That means that the size cost is relatively low, and there is only one copy of the .NET Core runtime in the image to service.

You can try out PowerShell Core, as part of the .NET Core SDK container image, by running the following Docker command:

docker run --rm mcr.microsoft.com/dotnet/core/sdk:3.0 pwsh -c Write-Host "Hello Powershell"

There are two main scenarios that having PowerShell inside the .NET Core SDK container image enables, which were not otherwise possible:

  • Write .NET Core application Dockerfiles with PowerShell syntax, for any OS.
  • Write .NET Core application/library build logic that can be easily containerized.

Example syntax for launching PowerShell for a volume-mounted containerized build:

  • docker run -it -v c:myrepo:/myrepo -w /myrepo mcr.microsoft.com/dotnet/core/sdk:3.0 pwsh build.ps1
  • docker run -it -v c:myrepo:/myrepo -w /myrepo mcr.microsoft.com/dotnet/core/sdk:3.0 ./build.ps1

Note: For the second example to work, on Linux, the .ps1 file needs to have the following pattern, and needs to be formatted with Unix (LF) not Windows (CRLF) line endings:

#!/usr/bin/env pwsh
Write-Host "test"

If you are new to PowerShell, we recommend reviewing the PowerShell getting started documentation.

Note: PowerShell Core is now available as part of .NET Core 3.0 SDK container images. It is not part of the .NET Core 3.0 SDK.

.NET Core Images now available via Microsoft Container Registry

Microsoft teams are now publishing container images to the Microsoft Container Registry (MCR). There are two primary reasons for this change:

  • Syndicate Microsoft-provided container images to multiple registries, like Docker Hub and Red Hat.
  • Use Microsoft Azure as a global CDN for delivering Microsoft-provided container images.

On the .NET team, we are now publishing all .NET Core images to MCR. As you can see from these links (if you click on them), we continue to have “home pages” on Docker Hub. We intend for that to continue indefinitely. MCR does not offer such pages, but relies on public registries, like Docker Hub, to provide users with image-related information.

The links to our old repos, such as microsoft/dotnet, now forward to the new locations. The images that existed at those locations still exists and will not be deleted.

We will continue servicing the floating tags in the old repos for the supported life of the various .NET Core versions. For example, 2.1-sdk, 2.2-runtime, and latest are examples of floating tags that will be serviced. A three-part version tag, like 2.1.2-sdk, will not be serviced, which was already the case.

.NET Core 3.0 will only be published to MCR.

For example, the correct tag string to pull the 3.0 SDK image now looks like the following:

mcr.microsoft.com/dotnet/core/sdk:3.0

The correct tag string to pull the 2.1 runtime image now looks like the following:

mcr.microsoft.com/dotnet/core/runtime:2.1

The new MCR strings are used with both docker pull and in Dockerfile FROM statements.

Platform matrix and support

With .NET Core, we try to support a broad set of distros and versions. For example, with Ubuntu, we support versions 16.04 and later. With containers, it’s too expensive and confusing for us to support the full matrix of options. In practice, we produce images for each distro’s tip version or tip LTS version.

We have found that each distribution has a unique approach to releasing, schedule and end-of life (EOL). That prevents us from defining a one-size-fits-all policy that we could document. Instead, we found it was easier to document our policy for each distro.

  • Alpine — support tip and retain support for one quarter (3 months) after a new version is released. Right now, 3.9 is tip and we’ll stop producing 3.8 images in a month or two.
  • Debian — support one Debian version per .NET Core version, whichever Debian version is the latest when a given .NET Core version ships. This is also the default Linux image used for a given multi-arch tag. For .NET Core 3.0, we intend to publish Debian 10 based images. We produce Debian 9 based images for .NET Core 2.1 and 2.2, and Debian 8 images for earlier .NET Core versions.
  • Ubuntu — support one Ubuntu version per .NET Core version, whichever Ubuntu version is the latest LTS version when a given .NET Core version ships. Today, we support Ubuntu 18.04 for all supported .NET Core versions. When 20.04 is released, we will start publishing images based on it, for the latest .NET Core version at that time. In addition, as we get closer to a new Ubuntu LTS versions, we will start supporting non-LTS Ubuntu versions a means of validating the new LTS versions.

For Windows, we support all supported Nano Server versions with each .NET Core version. In short, we support the cross-product of Nano Server and .NET Core versions.

ARM Architecture

We are in the process of adding support for ARM64 on Linux with .NET Core 3.0, complementing the ARM32 and X64 support already in place. This will enable .NET Core to be used in even more environments.

We were excited to see that ARM32 images were added for Alpine. We have been wanting to see that for a couple years. We are hoping to start publishing .NET Core for Alpine on ARM32 after .NET Core 3.0 is released, possibly as part of a .NET Core 3.1 release. Please tell us if this scenario is important to you.

Closing

Containers are a major focus for .NET Core, as we hope is evident from all the changes we’ve made. As always, we are reliant on your feedback to direct future efforts.

We’ve done our best to target obvious and fundamental behavior in the runtime. We’ll need to look at specific scenarios in order to further optimize the runtime. Please tell us about yours. We’re happy to spend some time with you to learn more about how you are using .NET Core and Docker together.

Enjoy the conference (if you are attending)!

The post Using .NET and Docker Together – DockerCon 2019 Update appeared first on .NET Blog.

New to Microsoft 365 in April—new tools to streamline compliance and make collaboration inclusive and engaging

Grow and protect your business with more privacy controls in Microsoft 365


Introducing AzureGraph: an interface to Microsoft Graph

$
0
0

Microsoft Graph is a comprehensive framework for accessing data in various online Microsoft services, including Azure Active Directory (AAD), Office 365, OneDrive, Teams, and more. AzureGraph is an R package that provides a simple R6-based interface to the Graph REST API, and is the companion package to AzureRMR and AzureAuth.

Currently, AzureGraph aims to provide an R interface only to the AAD part, with a view to supporting R interoperability with Azure: registered apps and service principals, users and groups. Like AzureRMR, it could potentially be extended to support other services.

AzureGraph is on CRAN, so you can install it via install.packages("AzureGraph"). Alternatively, you can install the development version from GitHub via devtools::install_github("cloudyr/AzureGraph").

Authentication

AzureGraph uses a similar authentication procedure to AzureRMR and the Azure CLI. The first time you authenticate with a given Azure Active Directory tenant, you call create_graph_login() and supply your credentials. AzureGraph will prompt you for permission to create a special data directory in which to cache the obtained authentication token and AD Graph login. Once this information is saved on your machine, it can be retrieved in subsequent R sessions with get_graph_login(). Your credentials will be automatically refreshed so you don’t have to reauthenticate.
library(AzureGraph)

# authenticate with AAD
# - on first login, call create_graph_login()
# - on subsequent logins, call get_graph_login()
gr <- create_graph_login()

Linux DSVM note: If you are using a Linux Data Science Virtual Machine in Azure, you may have problems running create_graph_login() (ie, without arguments). In this case, try create_graph_login(auth_type="device_code").

Users and groups

The basic classes for interacting with user accounts and groups are az_user and az_group. To instantiate these, call the get_user and get_group methods of the login client object.

# account of the logged-in user (if you authenticated via the default method)
me <- gr$get_user()

# alternative: supply an email address or GUID
me2 <- gr$get_user("hongooi@microsoft.com")

# IDs of my groups
head(me$list_group_memberships)
#> [1] "98326d14-365a-4257-b0f1-5c3ce3104f75" "b21e5600-8ac5-407b-8774-396168150210"
#> [3] "be42ef66-5c13-48cb-be5c-21e563e333ed" "dd58be5a-1eac-47bd-ab78-08a452a08ea0"
#> [5] "4c2bfcfe-5012-4136-ab33-f10389f2075c" "a45fbdbe-c365-4478-9366-f6f517027a22"

# a specific group
(grp <- gr$get_group("82d27e38-026b-4e5d-ba1a-a0f5a21a2e85"))
#> <Graph group 'AIlyCATs'>
#>   directory id: 82d27e38-026b-4e5d-ba1a-a0f5a21a2e85
#>   description: ADS AP on Microsoft Teams.
#> - Instant communication.
#> - Share files/links/codes/...
#> - Have fun. :)

The actual properties of an object are stored as a list in the properties field:

# properties of a user account
names(me$properties)
#>  [1] "@odata.context"                 "id"                             "deletedDateTime"
#>  [4] "accountEnabled"                 "ageGroup"                       "businessPhones"
#>  [7] "city"                           "createdDateTime"                "companyName"
#> [10] "consentProvidedForMinor"        "country"                        "department"
#> [13] "displayName"                    "employeeId"                     "faxNumber"
#> ...

me$properties$companyName
#> [1] "MICROSOFT PTY LIMITED"

# properties of a group
names(grp$properties)
#>  [1] "@odata.context"                "id"                            "deletedDateTime"
#>  [4] "classification"                "createdDateTime"               "description"
#>  [7] "displayName"                   "expirationDateTime"            "groupTypes"
#> [10] "mail"                          "mailEnabled"                   "mailNickname"
#> [13] "membershipRule"                "membershipRuleProcessingState" "onPremisesLastSyncDateTime"
#> ...

You can also view any directory objects that you own and/or created, via the list_owned_objects and list_registered_objects methods of the user object. These accept a type argument to filter the list of objects by the specified type(s).

me$list_owned_objects(type="application")
#> [[1]]
#> <Graph registered app 'AzureRapp'>
#>   app id: 5af7bc65-8834-4ee6-90df-e7271a12cc62
#>   directory id: 132ce21b-ebb9-4e75-aa04-ad9155bb921f
#>   domain: microsoft.onmicrosoft.com

me$list_owned_objects(type="group")
#> [[1]]
#> <Graph group 'AIlyCATs'>
#>   directory id: 82d27e38-026b-4e5d-ba1a-a0f5a21a2e85
#>   description: ADS AP on Microsoft Teams.
#> - Instant communication.
#> - Share files/links/codes/...
#> - Have fun. :)
#>
#> [[2]] 
#> <Graph group 'ANZ Data Science and AI V-Team'>
#>   directory id: 4e237eed-5f9b-4abd-830b-9322cb472b66
#>   description: ANZ Data Science V-Team
#>
#> ...

Registered apps and service principals

To get the details for a registered app, use the get_app or create_app methods of the login client object. These return an object of class az_app. The first method retrieves an existing app, while the second creates a new app.

# an existing app
gr$get_app("5af7bc65-8834-4ee6-90df-e7271a12cc62")
#> <Graph registered app 'AzureRapp'>
#>   app id: 5af7bc65-8834-4ee6-90df-e7271a12cc62
#>   directory id: 132ce21b-ebb9-4e75-aa04-ad9155bb921f
#>   domain: microsoft.onmicrosoft.com

# create a new app
(appnew <- gr$create_app("AzureRnewapp"))
#> <Graph registered app 'AzureRnewapp'>
#>   app id: 1751d755-71b1-40e7-9f81-526d636c1029
#>   directory id: be11df41-d9f1-45a0-b460-58a30daaf8a9
#>   domain: microsoft.onmicrosoft.com

By default, creating a new app will also generate a strong password with a duration of one year, and create a corresponding service principal in your AAD tenant. You can retrieve this with the get_service_principal method, which returns an object of class az_service_principal.

appnew$get_service_principal()
#> <Graph service principal 'AzureRnewapp'>
#>   app id: 1751d755-71b1-40e7-9f81-526d636c1029
#>   directory id: 7dcc9602-2325-4912-a32e-03e262ffd240
#>   app tenant: 72f988bf-86f1-41af-91ab-2d7cd011db47

# or directly from the login client (supply the app ID in this case)
gr$get_service_principal("1751d755-71b1-40e7-9f81-526d636c1029")
#> <Graph service principal 'AzureRnewapp'>
#>   app id: 1751d755-71b1-40e7-9f81-526d636c1029
#>   directory id: 7dcc9602-2325-4912-a32e-03e262ffd240
#>   app tenant: 72f988bf-86f1-41af-91ab-2d7cd011db47

To update an app, call its update method. For example, use this to set a redirect URL or change its permissions. Consult the Microsoft Graph documentation for what properties you can update. To update its password specifically, call the update_password method.

#' # set a public redirect URL
newapp$update(publicClient=list(redirectUris=I("http://localhost:1410")))

#' # change the password
newapp$update_password()

Common methods

The classes described above inherit from a base az_object class, which represents an arbitrary object in Azure Active Directory. This has the following methods:

  • delete(confirm=TRUE): Delete an object. By default, ask for confirmation first.
  • update(...): Update the object information in Azure Active Directory (mentioned above when updating an app).
  • do_operation(...): Carry out an arbitrary operation on the object.
  • sync_fields(): Synchronise the R object with the data in Azure Active Directory.
  • list_group_memberships(): Return the IDs of all groups this object is a member of.
  • list_object_memberships(): Return the IDs of all groups, administrative units and directory roles this object is a member of.

For efficiency the list_group_memberships and list_object_memberships methods return only the IDs of the groups/objects, since these lists can be rather long.

# get my OneDrive
me$do_operation("drive")

See also

See the following links on Microsoft Docs for more information.

Announcing Azure DevOps Server 2019.0.1 RC

$
0
0

Today, we are releasing Azure DevOps Server 2019.0.1 RC. This is a go-live release, meaning it is supported on production instances, and you will be able to upgrade to our final release.

Azure DevOps Server 2019.0.1 includes bug fixes for Azure DevOps Server 2019. You can find the details of the fixes in our release notes. You can upgrade to Azure DevOps Server 2019.0.1 from Azure DevOps Server 2019 or previous versions of Team Foundation Server. You can also install Azure DevOps Server 2019.0.1 without first installing Azure DevOps Server 2019.

Here are some key links:

We’d love for you to install this release candidate and provide any feedback at Developer Community.

The post Announcing Azure DevOps Server 2019.0.1 RC appeared first on Azure DevOps Blog.

Babylon.js 4.0 Is Here!

$
0
0

We cannot be more excited to share that Babylon.js 4.0 has officially been released. This version of Babylon.js is a major step forward in one of the world’s leading WebGL-based, graphics engines. Babylon.js 4.0 represents an incredible amount of hard work by a very passionate community of developers from around the world, and it is our honor to share it with all of you.

From a new visual scene inspector, best-in-class physically-based rendering, countless performance optimizations, and much more, Babylon.js 4.0 brings powerful, beautiful, simple, and open 3D to everyone on the web. Babylon.js has come a long way from its humble beginnings, and version 4.0 is our biggest update yet.

Visual Scene Inspector

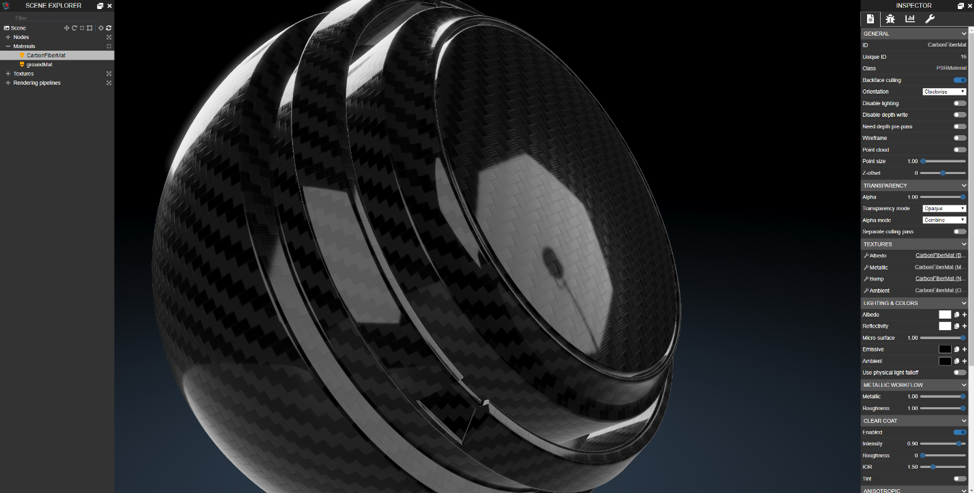
Along with new capabilities in the Babylon.js engine, we also want to improve the overall development experience with better debugging tools. Babylon.js 4.0 includes a new inspector tool which helps developers and artists setup or debug a scene. The inspector lets you configure and test all aspects of a Babylon.js scene like textures, materials, lighting, etc. For example, the properties panel in the inspector window can be used to configure all aspects of the updated physically-based material system.

Visual Scene Inspector Screen example.

You can learn more about the inspector and how to use it in our video tutorial series: Intro to Inspector.

The entire Babylon.js codebase has been moved to independent modules (ECMAScript 6). This will enable developers to create optimized payloads for the Babylon.js engine and reduce the overall download size. For simple 3D object viewing scenarios, we are seeing up to 80% smaller download payloads. The modularized engine is available as part of Babylon.js 4.0 and you can find out how to take full advantage of it here.

Realistic Rendering

A common request around rendering real world objects is to improve the realism of certain materials like fabric, glassware and metallic paint. To enable more realistic rendering of these materials, Babylon.js 4.0 adds new capabilities to its physically-based materials such as clear coat, anisotropy, sheen and sub-surface scattering. You can learn more about these new rendering capabilities here.

Better Physics and More

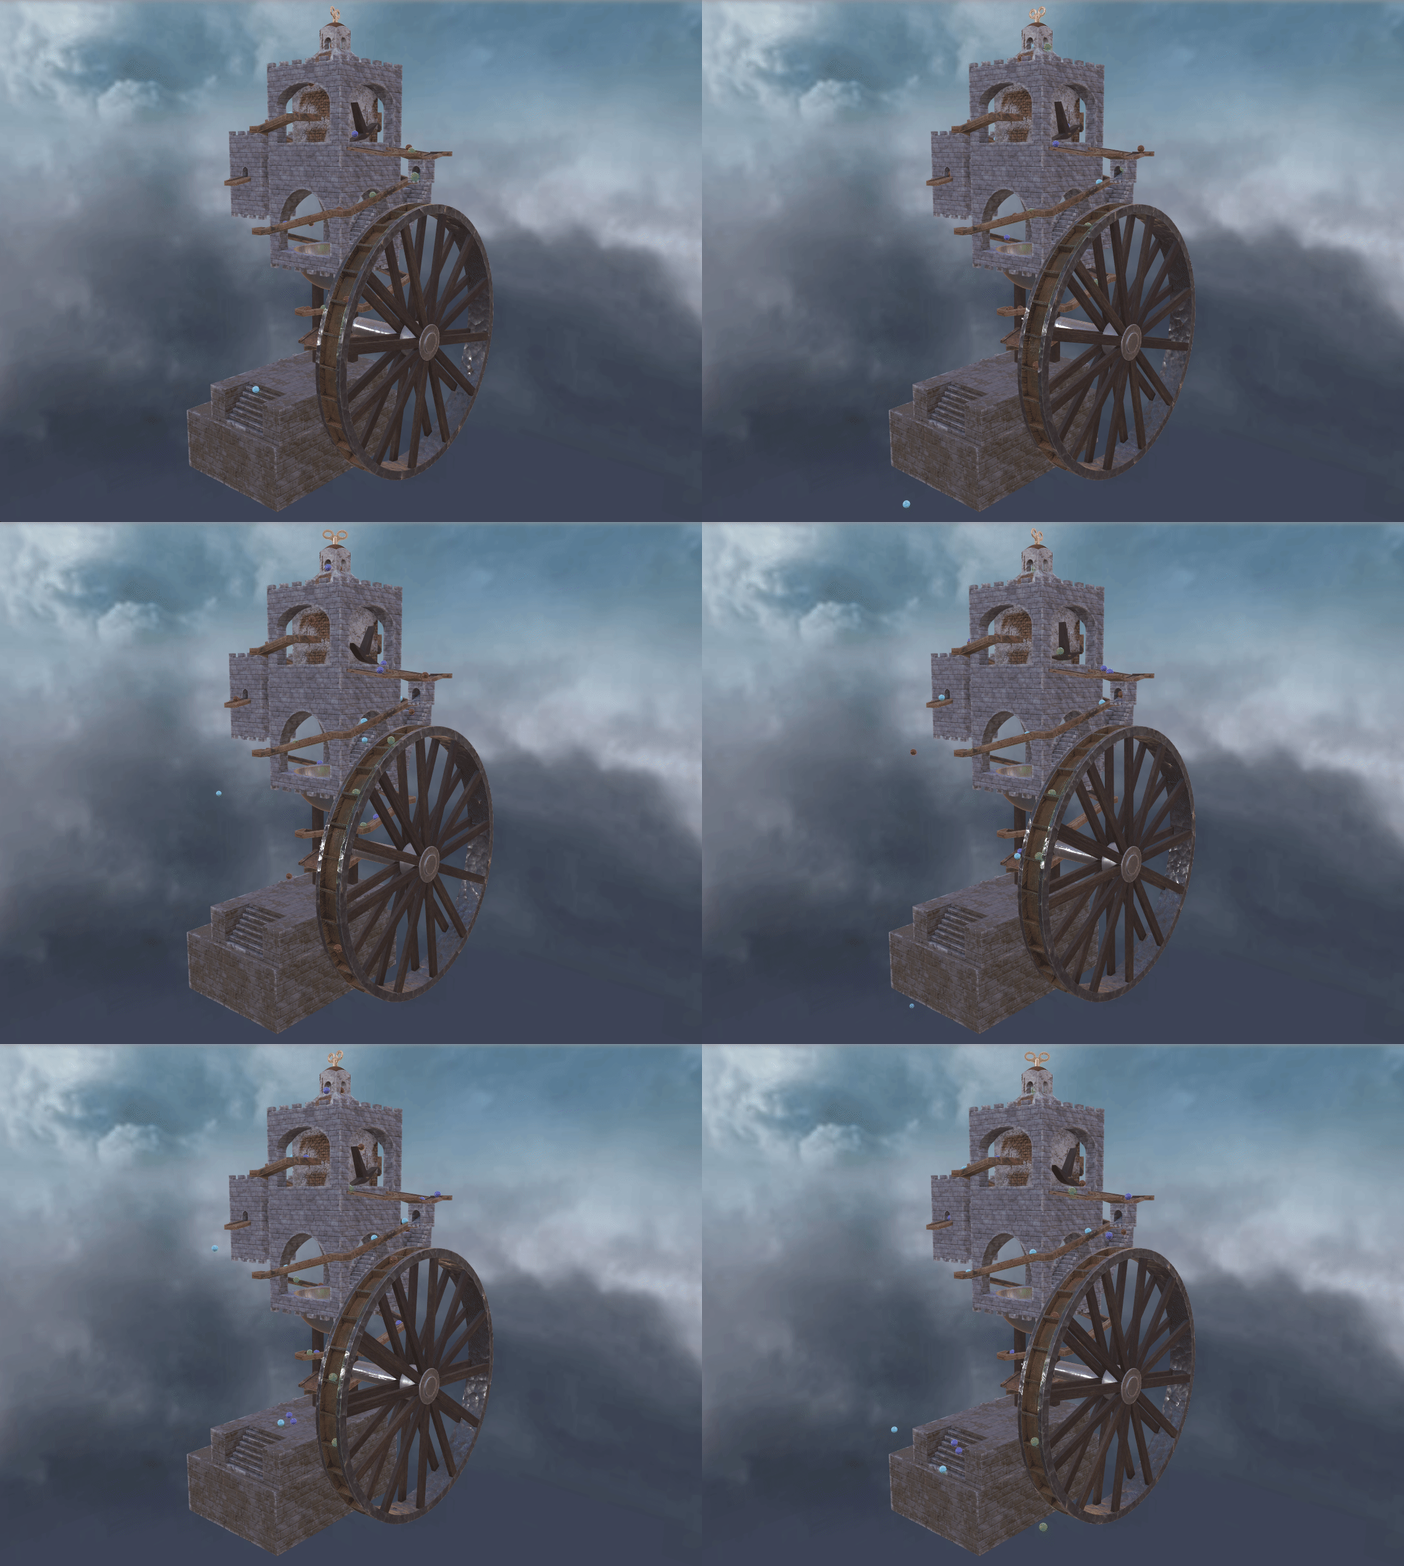
Babylon.js already has a plugin system that enables developers to choose their own physics engine. Now Babylon.js 4.0 includes support for the ammo.js physics engine as a plugin. The ammo.js plugin brings new capabilities like soft-body physics where you can simulate interactions between objects like cloth or rope. This demo showcases the many physical interactions that can be simulated using the ammo.js plugin.

Video example of ammo.js physics engine

These are a few highlights of the new capabilities available in Babylon.js 4.0. There are many more capabilities for you to explore like Trail Mesh and Motion Blur. You can check out the full list here.

A Bold New Look

With such a major release, it seemed like a fantastic time to evolve our brand to help set the stage as we look to the future of Babylon.js. Alongside version 4.0, we’re also very happy to introduce you to the new look for Babylon.

Babylon.js new logo

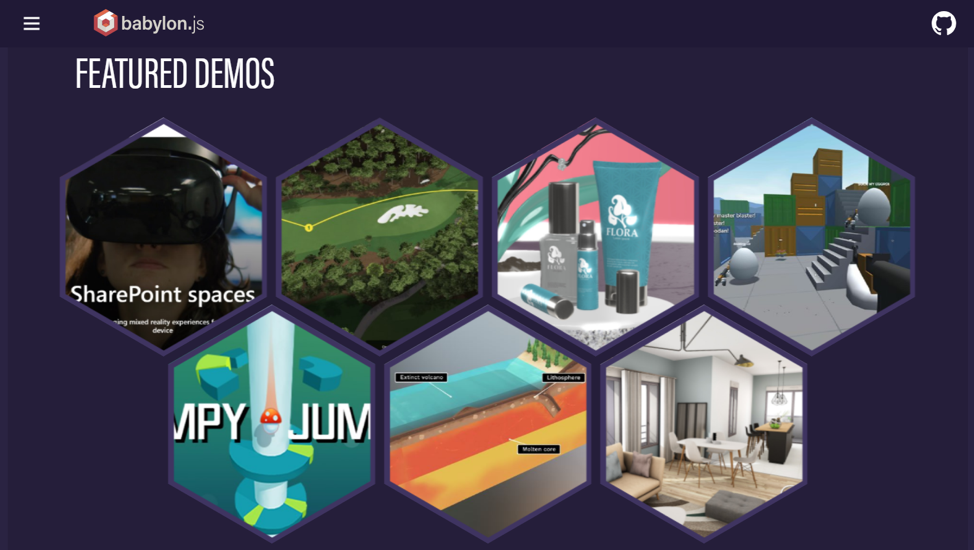
Starting today, Babylon.js has a bold new identity and a freshly designed website that reflects a “future of dimensionality.” We see a future where 3D web experiences are as accessible as photos and video are today. By unlocking the power of 3D for developers and artists across the web, we see a more open, entertaining, and interactive online world…and it was important to us, that our brand boldly represent that vision.

babylon.js screen page of featured demos

Whether you are just starting your journey with web-based 3D or you are a seasoned professional, we sincerely hope that you’ll find something unique and delightful with Babylon.js 4.0. It’s built by people like you for people like you.

https://www.babylonjs.com 

The post Babylon.js 4.0 Is Here! appeared first on Windows Developer Blog.

Dell unveils new devices designed for the mobile professional

Announcing Windows Vision Skills (Preview)

$
0
0

Today, we’re announcing the preview of Windows Vision Skills, a set of NuGet packages that make it easy for application developers to solve complex computer vision problems using a simple set of APIs.

From left to right, you are seeing in action the Object Detector, Skeletal Detector, and Emotion Recognizer skills.

Figure 1- From left to right, you are seeing in action the Object Detector, Skeletal Detector, and Emotion Recognizer skills.

With Windows Vision Skills,

  • An app developer can use out-of-box WinRT APIs to add pre-built vision skills like object detection, skeletal detection and face sentiment analysis in their Windows applications (.NET, Win32, and UWP).
  • A computer vision developer can leverage hardware acceleration frameworks on Windows devices by packaging their solution as a Vision Skill – without worrying about low-level APIs.

Chart showing Windows Vision Skills applications

All Windows Vision Skills inherit the base classes and interfaces in Microsoft.AI.Skills.SkillInterfacePreview. This open framework can easily be extended to work with existing machine learning frameworks and libraries such as OpenCV.

Windows Vision Skills complements existing Windows support for inference of ONNX models by utilizing WinML for local inferencing. The framework allows you to build intelligent applications while leveraging platform optimization.

Get started now!

Play around with samples or learn how to create your own Windows Vision Skills using our tutorials.

Have a feature request or want to submit feedback? Find us on GitHub.

The post Announcing Windows Vision Skills (Preview) appeared first on Windows Developer Blog.

New white paper highlights how Microsoft Teams helps healthcare providers with HIPAA compliance

Enhancing Non-packaged Desktop Apps using Windows Runtime Components

$
0
0

Windows 10 Version 1903, May 2019 Update adds support for non-packaged desktop apps to make use of user-defined (3rd party) Windows Runtime (WinRT) Components. Previously, Windows only supported using 3rd party Windows Runtime components in a packaged app (UWP or Desktop Bridge). Trying to call a user-defined Windows Runtime Component in a non-packaged app would fail because of the absence of package identity in the app, no way to register the component with the System and in turn no way for the OS to find the component at runtime.

The restrictions blocking this application scenario have now been lifted with the introduction of Registration-free WinRT (Reg-free WinRT). Similar to the classic Registration-free COM feature, Reg-Free WinRT activates a component without using a registry mechanism to store and retrieve information about the component. Instead of registering the component during deployment which is the case in packaged apps, you can now declare information about your component’s assemblies and classes in the classic Win32-style application.manifest. At runtime, the information stored in the manifest will direct the activation of the component.

Why use Windows Runtime Components in Desktop Apps

Using Windows Runtime components in your Win32 application gives you access to more of the modern Windows 10 features available through Windows Runtime APIs. This way you can integrate modern experiences in your app that light up for Windows 10 users. A great example is the ability to host UWP controls in your current WPF, Windows Forms and native Win32 desktop applications through UWP XAML Islands.

How Registration-free WinRT Works

The keys to enabling this functionality in non-packaged apps are a newly introduced Windows Runtime activation mechanism and the new ”activatableClass” element in the application manifest. It is a child element of the existing manifest “file” element, and it enables the developer to specify activatable Windows Runtime classes in a dll the application will be making use of. At runtime this directs activation of the component’s classes. Without this information non-packaged apps would have no way to find the component. Below is an example declaration of a dll (WinRTComponent.dll) and the activatable classes (WinRTComponent.Class*) our application is making use of. The “threadingModel” and namespace (“xmlns”) must be specified as shown:


<?xml version="1.0" encoding="utf-8"?>
<assembly manifestVersion="1.0" xmlns="urn:schemas-microsoft-com:asm.v1">  
<assemblyIdentity version="1.0.0.0" name="MyApplication.app"/>

  <file name="WinRTComponent.dll">
    <activatableClass
        name="WinRTComponent.Class1"
        threadingModel="both"
        xmlns="urn:schemas-microsoft-com:winrt.v1" />
    <activatableClass
        name="WinRTComponent.Class2"
        threadingModel="both"
        xmlns="urn:schemas-microsoft-com:winrt.v1" />
  </file>

</assembly>

The Windows Runtime Component

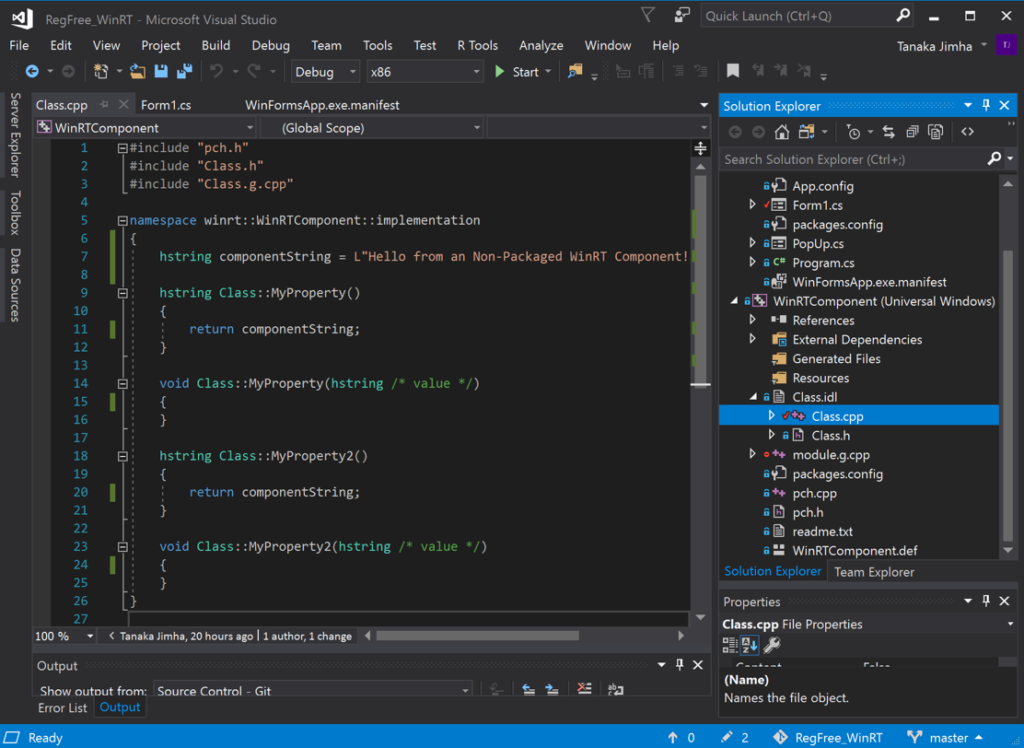
For our examples we’ll be using a simple C++ Windows Runtime component with a single class (WinRTComponent.Class) that has a string property. In practice you can make use of more sophisticated components containing UWP controls. Some good examples are this UWP XAML Islands sample and these Win2D samples.

C++ Windows Runtime Component

Figure 1: C++ Windows Runtime Component

Using A C# Host App

GitHub Sample: https://aka.ms/regfreewinrtcs

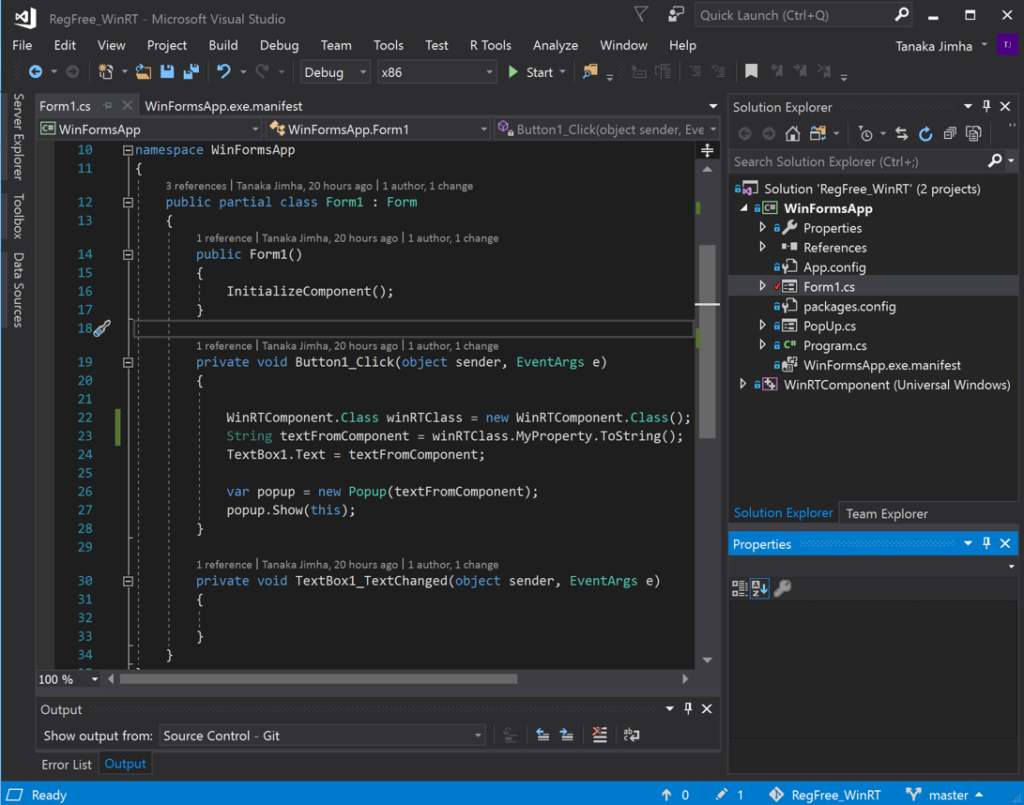
In our first example we’ll look at a non-packaged Windows Forms app (WinFormsApp) which is referencing our C++ Windows Runtime Component (WinRTComponent). Below is an implementation of a button in the app calling the component class and displaying its string in a textbox and popup:

WinForms App Consuming component

Figure 2: WinForms App Consuming component

All we need to get the code to compile is to add a reference to the WinRTComponent project from our WinForms app – right click the project node | Add | Reference | Projects | WinRTComponent. Adding the reference also ensures every time we build our app, the component is also built to keep track of any new changes in the component.

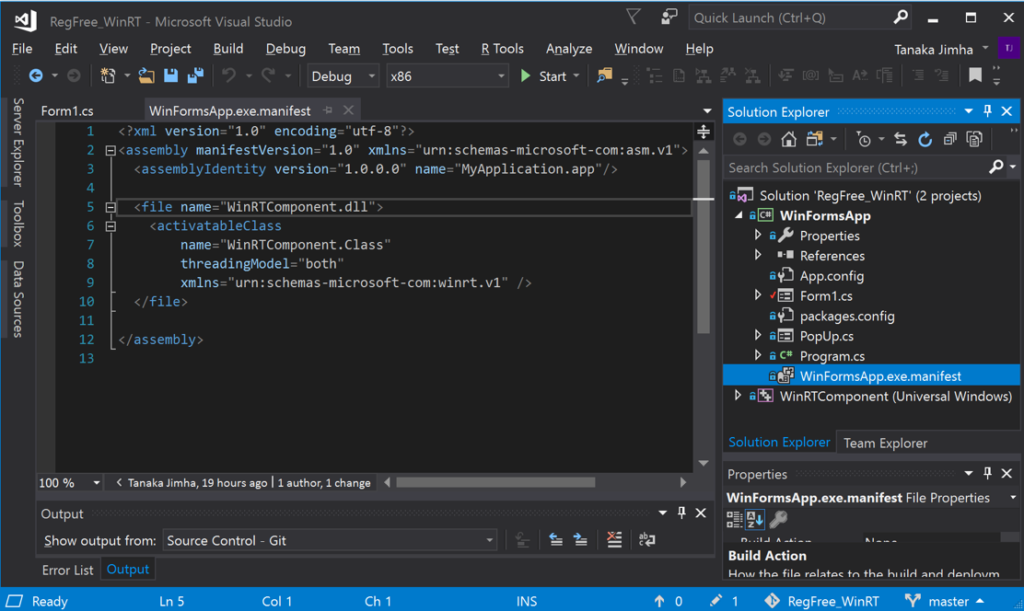
Although the code compiles, if we try to run the solution, the app will fail. This is because the system has no way of knowing which DLL contains WinRTComponent.Class and where to find the DLL. This is where the application manifest and Registration-free WinRT come in. On the application node right click | Add | New Item | Visual C# | Application Manifest File. The manifest file naming convention is that it must have the same name as our application’s .exe and have the .manifest extension, in this case I named it “WinFormsApp.exe.manifest”. We don’t need most of the text in the template manifest so we can replace it with the DLL and class declarations as shown below:

Application Manifest in WinForms App

Figure 3: Application Manifest in WinForms App

Now that we’ve given the system a way of knowing where to find WinRTComponent.Class, we need to make sure the component DLL and all its dependencies are in the same directory as our app’s .exe. To get the component DLL in the correct directory we will use a Post Build Event – right click app project | Properties | Build Events | Post Build Event, and specify a command to copy the component dll from its output directory to the same output directory as the .exe:

copy /Y “$(SolutionDir)WinRTComponentbin$(Platform)$(Configuration)WinRTComponent.dll”  “$(SolutionDir)$(MSBuildProjectName)$(OutDir)WinRTComponent.dll”

Handling Dependencies

Because our component is built in visual C++, it has a runtime dependency on the C++ Runtime. Windows Runtime components were originally created to only work in packaged applications distributed through the Microsoft Store, as a result, they have a dependency on the ‘Store version’ of the C++ Runtime DLLs, aka the VCLibs framework package. Unfortunately, redistributing the VCLibs framework package outside the Microsoft Store is currently not supported. As a result, we’ve had to come up with an alternate solution to satisfy the framework package dependency in non-packaged applications. We created app-local forwarding DLLs in the ‘form’ of the Store framework package DLLs that forward their function calls to the standard VC++ Runtime Libraries, aka the VCRedist. You can download the forwarding DLLs as the NuGet package Microsoft.VCRTForwarders.140 to resolve the Store framework package dependency.

The combination of the app-Local forwarding DLLs obtained via the NuGet package and the VCRedist allows your non-Store deployed Windows Runtime component to work as if it was deployed through the Store. Since native C++ applications already have a dependency on the VCRedist, the Microsoft.VCRTForwarders.140 NuGet package is a new dependency. For managed applications the NuGet package and the VCRedist are both new dependencies.

The Microsoft.VCRTForwarders.140 NuGet package can be found here: https://www.nuget.org/packages/Microsoft.VCRTForwarders.140/
The VCRedist can be found here: https://support.microsoft.com/en-us/help/2977003/the-latest-supported-visual-c-downloads

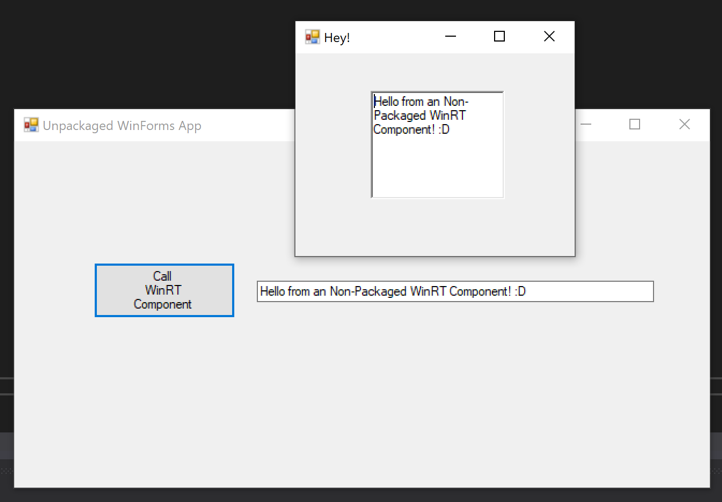
After adding the Microsoft.VCRTForwarders.140 NuGet package in our app everything should be set, and running our application displays text from our Windows Runtime component:

Running WinForms App

Figure 4: Running WinForms App

Using A C++ Host App

GitHub Sample: https://aka.ms/regfreewinrtcpp

To successfully reference a C++ Windows Runtime component from a C++ app, you need to use C++/WinRT to generate projection header files of your component. You can then include these header files in your app code to call your component. You can find out more about the C++/WinRT authoring experience here. Making use of a C++ Windows Runtime component in a non-packaged C++ app is very similar to the process we outlined above when using a C# app. However, the main differences are:

  1. Visual Studio doesn’t allow you to reference the C++ Windows Runtime component from a non-packaged C++ host app.
  2. You need C++/WinRT generated projection headers of the component in your app code.

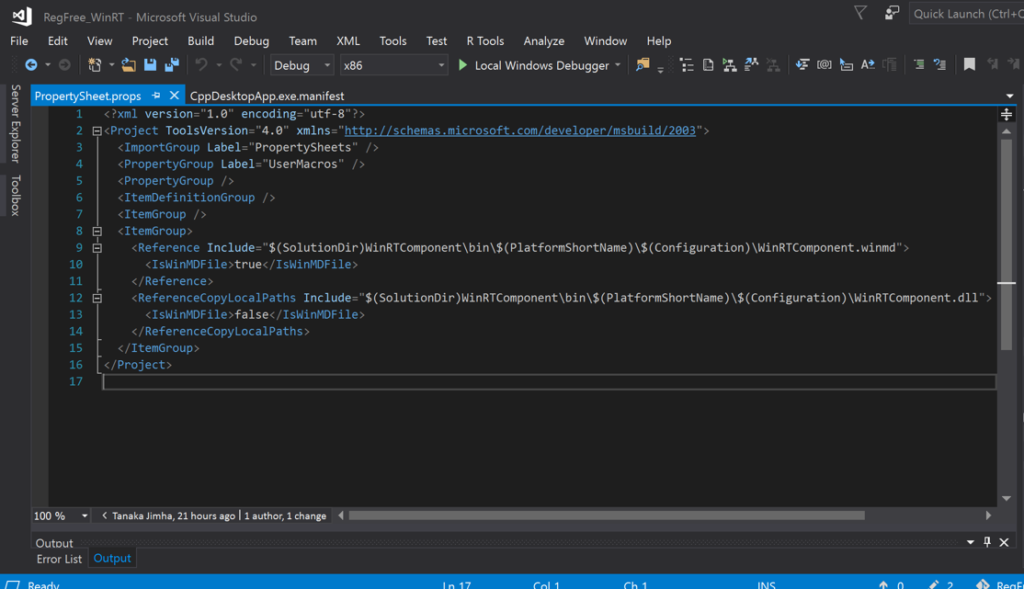
Visual Studio doesn’t allow you to reference the Windows Runtime component from a non-packaged C++ app due to the different platforms the projects target. A nifty solution around this is to reference the Component’s WinMD using a property sheet. We need this reference so that C++/WinRT can generate projection header files of the component which we can use in our app code. So the first thing we’ll do to our C++ app is add a property sheet – right-click the project node| Add | New Item | Visual C++ | Property Sheets | Property Sheet (.props)

  • Edit the resulting property sheet file (sample property sheet is shown below)
  • Select View | Other Windows | Property Manager
  • Right-click the project node
  • Select Add Existing Property Sheet
  • Select the newly created property sheet file

Property Sheet in C++ Host App

Figure 5: Property Sheet in C++ Host App

This property sheet is doing two things: adding a reference to the component WinMD and copying the component dll to the output directory with our app’s .exe. The copying step is so that we don’t have to create a post build event as we did in the C# app (the component dll needs to be in the same directory as the app’s .exe). If you prefer using the post build event instead, you can skip the copy action specified in the property sheet.

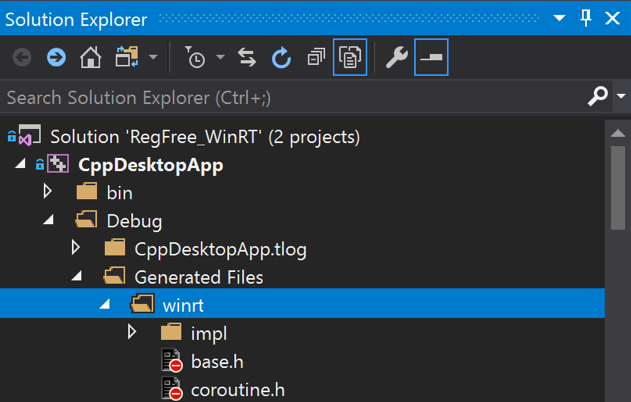
The next step would be to make sure your app has the C++/WinRT NuGet package installed. We need this for the component projection headers. Because Visual Studio doesn’t allow us to directly add a reference to the component, we need to manually build the component whenever we update it, so that we are referencing the latest component bits in our app. When we’ve made sure the component bits are up to date, we can go ahead and then build our app. The C++/WinRT NuGet package will generate a projection header file of the component based on the WinMD reference we added in the app property sheet. If you want to see the header file click on the “All Files” icon in Visual Studio Solution Explorer | Generated Files | winrt | <ComponentName.h>:

C++/WinRT Generated Projections

Figure 6: C++/WinRT Generated Projections

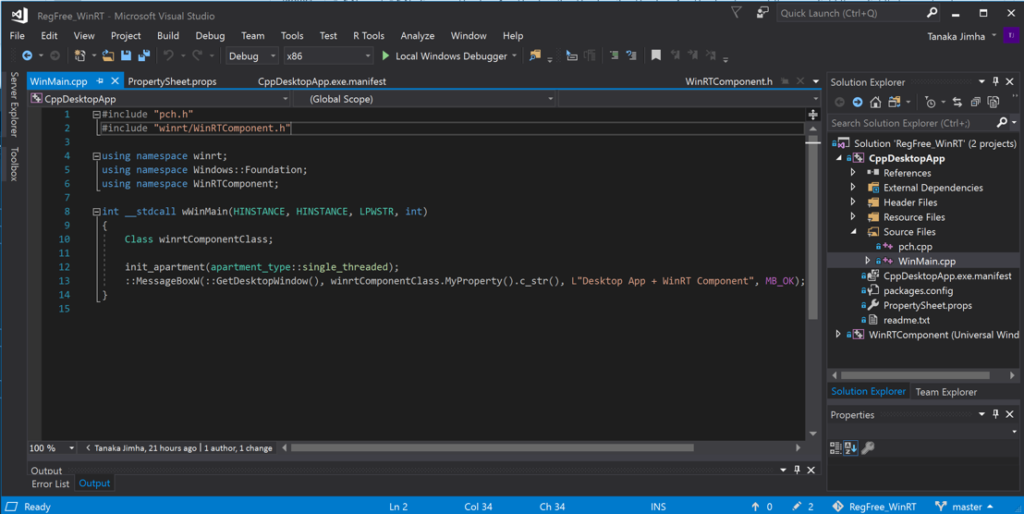
By including the generated component projection header file (WinRTComponent.h) in our app code we can reference our component code:

C++ App referencing code in WinRTComponent

Figure 7: C++ App referencing code in WinRTComponent

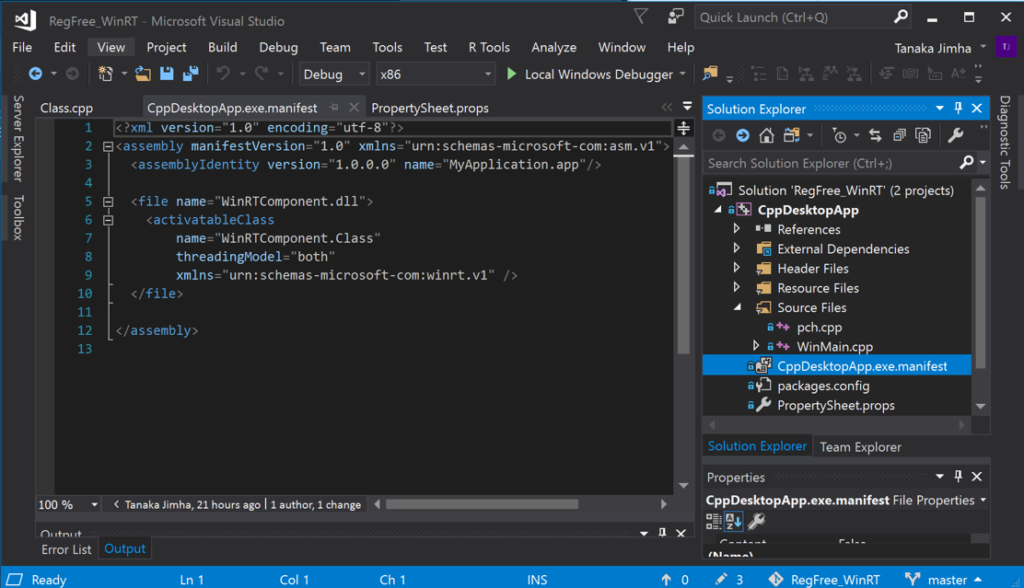
We then add an application manifest to our app and specify the component DLL and component classes we’re making use of:

Win32 Application Manifest in C++ App

Figure 8: Win32 Application Manifest in C++ App

And this is what we get when we build and run the app:

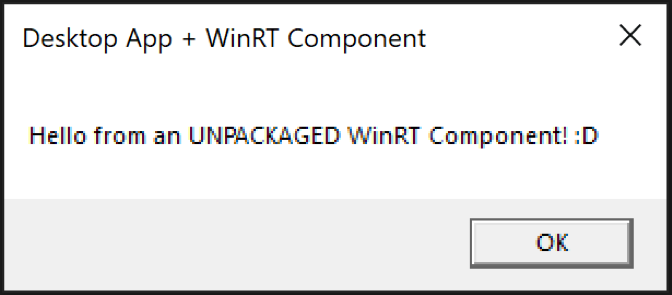
Running C++ Host App

Figure 9: Running C++ Host App

Conclusion

Registration-free WinRT enables you to access more features in the UWP ecosystem by allowing you to use Windows Runtime Components without the requirement to package your application. This makes it easier for you to keep your existing Win32 code investments and enhance your applications by additively taking advantage of modern Windows 10 features. This means you can now take advantage of offerings such as UWP XAML Islands from your non-packaged desktop app. For a detailed look at using UWP XAML Islands in your non-packaged desktop app have a look at these samples: UWP XAML Islands and Win2D. Making use of C++ Windows Runtime components in non-packaged apps comes with the challenge of handling dependencies. While the solutions currently available are not ideal, we aim to make the process easier and more streamlined based on your feedback.

The post Enhancing Non-packaged Desktop Apps using Windows Runtime Components appeared first on Windows Developer Blog.


Calling Windows 10 APIs From a Desktop Application just got easier

$
0
0

Today, we are pleased to announce we posted on nuget.org a preview of the Windows 10 WinRT API Pack. By using these NuGet packages, you can quickly and easily add new Windows functionality to your applications like Geolocation, Windows AI, Machine Learning, and much more. 

We have posted 3 packages: 

Each package includes all of the Windows Runtime (WinRT) APIs included with each specific Windows release. These are preview packages, so please give us feedback and watch for updates to the known issues on our repository.    

How can this help me? 

Previously, in order to access the Windows API surface from your WPF or Winforms app, you needed to specifically add contract files and other reference assemblies to your project. With this release, you can simply add a NuGet package and we will do the heavy lifting to add the contracts. 

In addition, when using the NuGet packages, updating to the latest Windows Runtime (WinRT) APIs in your project will be as simple as checking for an update to the NuGet package.   

Getting Started  

Step 1: Configure your project to support Package Reference  

Step 2: Add the Microsoft.Windows.SDK.Contracts NuGet package to your project  

  1. Open the NuGet Package Manager Console  
  2. Install the package that includes the Windows 10 Contracts you want to target. Currently the following are supported:  

Windows 10 version 1803 

Install-Package Microsoft.Windows.SDK.Contracts -Version 10.0.17134.1000-preview  

Windows 10 version 1809 

Install-Package Microsoft.Windows.SDK.Contracts -Version 10.0.17763.1000-preview  

Windows 10 version 1903 

Install-Package Microsoft.Windows.SDK.Contracts -Version 10.0.18362.2002-preview 

Step 3: Get coding 

By adding one of the above NuGet packages, you now have access to calling the Windows Runtime (WinRT) APIs in your project.   

For example, this snippet shows a WPF Message box displaying the latitude and longitude coordinates: 


private async void Button_Click(object sender, RoutedEventArgs e) 
{ 
    var locator = new Windows.Devices.Geolocation.Geolocator(); 
    var location = await locator.GetGeopositionAsync(); 
    var position = location.Coordinate.Point.Position; 
    var latlong = string.Format("lat:{0}, long:{1}", position.Latitude, position.Longitude); 
    var result = MessageBox.Show(latlong); 
} 

Adaptive code for previous OS 

Each package includes all the supported Windows Runtime APIs up to Windows 10 version of the package.  If you are targeting earlier platforms, consider only offering functionality available on the detected platform version.  For further details, see the following article: Version adaptive code. 

For additional information on calling Windows 10 APIs in your desktop application, please see the following article: Enhance your desktop application for Windows 10. 

If you want to check out a project that is already using these NuGet packages, see: https://github.com/windows-toolkit/Microsoft.Toolkit.Win32. 

The post Calling Windows 10 APIs From a Desktop Application just got easier appeared first on Windows Developer Blog.

Did I leave the garage door open? A no-code project with Azure IoT Central and the MXChip DevKit

$
0
0

Azure IoT DevKitFor whatever reason when a programmer tries something out for the first time, they write a "Hello World!" application. In the IoT (Internet of Things) world of devices, it's always fun to make an LED blink as a good getting started sample project.

When I'm trying out an IoT platform or tiny microcontroller I have my own "Hello World" project - I try to build a simple system that tells me "Did I leave the garage door open?"

I wanted to see how hard it would be to use an Azure IoT MXChip DevKit to build this little system. The DevKit is small and thin but includes Wifi, OLED display, headphone, microphone, sensors like temperature, humidity, motion, pressure sensors. The kit isn't super expensive given all it does and you can buy it most anywhere. The DevKit is also super easy to update and it's actively developed. In fact, I just updated mine to Firmware 1.6.2 yesterday and there is an Azure IoT Device Workbench Extension for VS Code. There is also a fantastic IoT DevKit Project Catalog you should check out.

I wanted to use this little Arduino friendly device and have it talk to Azure. My goal was to see how quickly and simply I could make a solution that would:

  • Detect if my garage door is open
  • If it's open for more than 4 minutes, text me
  • Later, perhaps I'll figure out how to reply to the Text or take an action to close the door remotely.

However, there is an Azure IoT Hub and there's Azure IoT Central and this was initially confusing to me. It seems that Azure IoT Hub is a individual Azure service but it's not an end-to-end IoT solution - it's a tool in the toolbox. Azure IoT Central, on the other hand, is an browser-based system with templates that is a SaaS (Software as a Service) and hides most of the underlying systems. With IoT Central no coding is needed!

Slick. I was fully prepared to write Arduino code to get this garage door sensor working but if I can do it with no code, rock on. I may finish this before lunch is over. I have an Azure account so I went to https://azureiotcentral.com and created a new Application. I chose Pay as You Go but it's free for the first 5 devices so, swag.

Create a New Azure IoT Central App

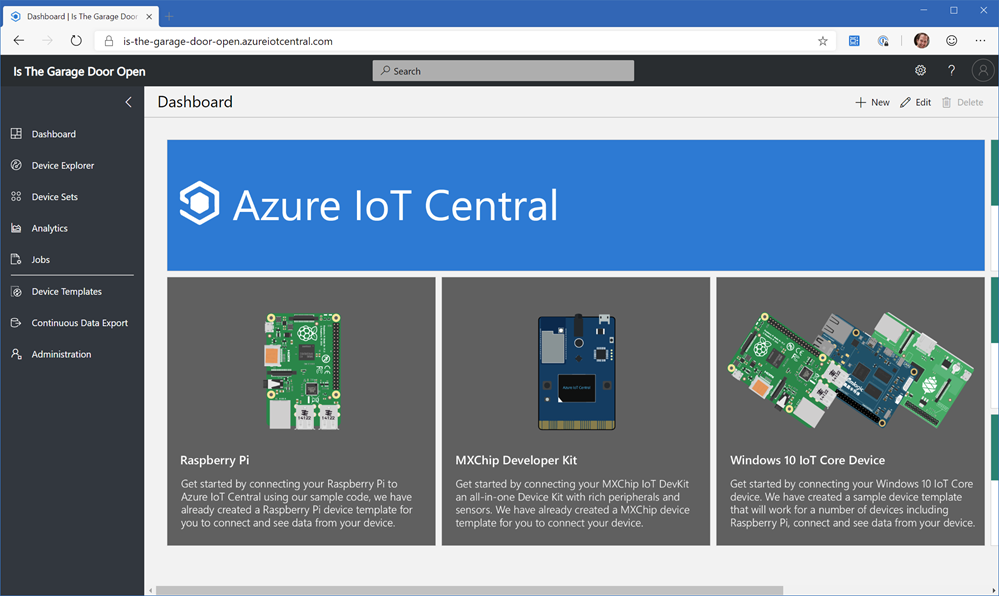
You should totally check this out even if you don't have an IoT DevKit because you likely DO have a Raspberry Pi and it totally has device templates for Pis or even Windows 10 IoT Core Devices.

Azure IoT Central

Updating the firmware for the IoT DevKit couldn't be easier. You plug it into a free USB port, it shows up as a disk drive, and you drag in the new (or alternate) firmware. If you're doing something in production you'll likely want to do OTA (Over-the-air) firmware updates with Azure IoT Hub automatic device management, so it's good to know that's also an option. The default DevKit firmware is fun to explore but I am connecting this device to Azure (and my Wifi) so I used the firmware and instructions from here which is firmware specific to Azure IoT Central.

The device reboots as a temporary hotspot (very clever) and then you can connect to it's wifi, and then it'll connect to yours over WPA2. Once you're connected to Wifi, you can add a new Real (or Simulated - you can actually do everything I'm doing where without a real device!) device using a Device ID that you'll pair with your Mxchip IoT DevKit. After it's connect you'll see tons of telemetry pour into Azure. You can, of course, choose what you want to send and send just the least amount your projects needs, but it's still a very cool first experience to see temp, humidity, and on and on from this little device.

MxChip in Azure

Here's a wonderful HIGH QUALITY diagram of my Garage door planned system. You only wish your specifications were this sophisticated. ;)

Basically the idea is that when the door is closed I'll have the IoT DevKit taped to the door with a battery, then when it open it'll rotate 90 degrees and the Z axis of the Accelerometer will change! If it stays there for more than 5 minutes then it should text me!

image

In Azure IoT central I made a Device Template with a Telemetry Rule that listens to the changes in the accelerometer Z and when the average is less than 900 (I figured this number out by moving it around and testing) then it fires an Action.

The "Action" is using an Azure Monitor action group that can either SMS or even call me voice!

In this chart when the accelerometer is above the line the garage door is closed and when it drops below the line it's open!

The gyroscope Z changing with time

Here's the Azure Monitoring alert that texts me when I leave the garage door open too long.

Azure Activity Monitor

And here's my alert SMS!

mxchip

I was very impressed I didn't have to write any code to pull this off. I'm going to try this same "Hello World" later with custom code using a AdaFruit Huzzah Feather and an ADXL345 Accelerometer. I'll write Arduino C code and still have it talk to Azure for Alerts.

It's amazing how clean and simple the building blocks are for projects like this today.


Sponsor: Manage GitHub Pull Requests right from the IDE with the latest JetBrains Rider. An integrated performance profiler on Windows comes to the rescue as well.


© 2018 Scott Hanselman. All rights reserved.
     

Building recommender systems with Azure Machine Learning service

$
0
0

Title card: Building recommendation systems locally and in the cloud with Azure Machine Learning Service.

Recommendation systems are used in a variety of industries, from retail to news and media. If you’ve ever used a streaming service or ecommerce site that has surfaced recommendations for you based on what you’ve previously watched or purchased, you’ve interacted with a recommendation system. With the availability of large amounts of data, many businesses are turning to recommendation systems as a critical revenue driver. However, finding the right recommender algorithms can be very time consuming for data scientists. This is why Microsoft has provided a GitHub repository with Python best practice examples to facilitate the building and evaluation of recommendation systems using Azure Machine Learning services.

What is a recommendation system?

There are two main types of recommendation systems: collaborative filtering and content-based filtering. Collaborative filtering (commonly used in e-commerce scenarios), identifies interactions between users and the items they rate in order to recommend new items they have not seen before. Content-based filtering (commonly used by streaming services) identifies features about users’ profiles or item descriptions to make recommendations for new content. These approaches can also be combined for a hybrid approach.

Recommender systems keep customers on a businesses’ site longer, they interact with more products/content, and it suggests products or content a customer is likely to purchase or engage with as a store sales associate might. Below, we’ll show you what this repository is, and how it eases pain points for data scientists building and implementing recommender systems.

Easing the process for data scientists

The recommender algorithm GitHub repository provides examples and best practices for building recommendation systems, provided as Jupyter notebooks. The examples detail our learnings on five key tasks:

  • Data preparation - Preparing and loading data for each recommender algorithm
  • Modeling - Building models using various classical and deep learning recommender algorithms such as Alternating Least Squares (ALS) or eXtreme Deep Factorization Machines (xDeepFM)
  • Evaluating - Evaluating algorithms with offline metrics
  • Model selection and optimization - Tuning and optimizing hyperparameters for recommender models
  • Operationalizing - Operationalizing models in a production environment on Azure

Several utilities are provided in reco utils to support common tasks such as loading datasets in the format expected by different algorithms, evaluating model outputs, and splitting training/test data. Implementations of several state-of-the-art algorithms are provided for self-study and customization in an organization or data scientists’ own applications.
In the image below, you’ll find a list of recommender algorithms available in the repository. We’re always adding more recommender algorithms, so go to the GitHub repository to see the most up-to-date list.

  A chart showing different algorithms and their uses.

Let’s take a closer look at how the recommender repository addresses data scientists’ pain points.

  1. It’s time consuming to evaluate different options for recommender algorithms

    • One of the key benefits of the recommender GitHub repository is that it provides a set of options and shows which algorithms are best for solving certain types of problems. It also provides a rough framework for how to switch between different algorithms. If model performance accuracy isn’t enough, an algorithm better suited for real-time results is needed, or the originally chosen algorithm isn’t the best fit for the type of data being used, a data scientist may want to switch to a different algorithm.
  2. Choosing, understanding, and implementing newer models for recommender systems can be costly

    • Selecting the right recommender algorithm from scratch and implementing new models for recommender systems can be costly as they require ample time for training and testing as well as large amounts of compute power. The recommender GitHub repository streamlines the selection process, reducing costs by saving data scientists time in testing many algorithms that are not a good fit for their projects/scenarios. This, coupled with Azure’s various pricing options, reduces data scientists’ costs on testing and organization’s costs in deployment.
  3. Implementing more state-of-the-art algorithms can appear daunting

    • When asked to build a recommender system, data scientists will often turn to more commonly known algorithms to alleviate the time and costs needed to choose and test more state-of-the-art algorithms, even if these more advanced algorithms may be a better fit for the project/data set. The recommender GitHub repository provides a library of well-known and state-of-the-art recommender algorithms that best fit certain scenarios. It also provides best practices that, when followed, make implementing more state-of-the-art algorithms easier to approach.
  4. Data scientists are unfamiliar with how to use Azure Machine Learning service to train, test, optimize, and deploy recommender algorithms

    • Finally, the recommender GitHub repository provides best practices for how to train, test, optimize, and deploy recommender models on Azure and Azure Machine Learning (Azure ML) service. In fact, there are several notebooks available on how to run the recommender algorithms in the repository on Azure ML service. Data scientists can also take any notebook that has already been created and submit it to Azure with minimal or no changes.

Azure ML can be used intensively across various notebooks for tasks relating to AI model development, such as:

  • Hyperparameter tuning
  • Tracking and monitoring metrics to enhance the model creation process
  • Scaling up and out on compute like DSVM and Azure ML Compute
  • Deploying a web service to Azure Kubernetes Service
  • Submitting pipelines

Learn more

Utilize the GitHub repository for your own recommender systems.

Learn more about the Azure Machine Learning service.

Get started with a free trial of Azure Machine Learning service.

Monitoring enhancements for VMware and physical workloads protected with Azure Site Recovery

$
0
0

Azure Site Recovery has enhanced the health monitoring of your workloads by introducing various health signals on the replication component, Process Server. The Process Server (PS) in a hybrid DR scenario is a vital component of data replication. It handles replication caching, data compression, and data transfer. Once the workloads are protected issues can be triggered due to multiple factors including high data change rate (churn) at source, network connectivity, available bandwidth, under provisioning the Process Server, or protecting large number of workloads with a single Process Server. These may lead to bad state of the PS and have a cascading effect on replication of VMs.

Troubleshooting these issues is now made easier with additional health signals from the Process Server. It is quick to identify which Process Server is being used by a virtual machine, and easy to relate the health between the two. Notifications are raised on multiple parameters of PS – free space utilization, memory usage, CPU utilization, and achieved throughput. Both warning and critical alerts are released so that action can be taken at the right time. This helps users avoid running into large scale issue which may impact multiple machines connected to a PS.

Process Server Blade

View of the PS blade

Warning and critical events are raised as per the below thresholds set by Azure Site Recovery. Supplemental alerts include issues related to PS services and PS heartbeat. On the portal all these health events are collated on PS blade for deep dive monitoring with up to 72 hours of data points in the events table. Note that throughput is measured in terms of achievable RPO.

Parameter Warning Threshold Critical Threshold
CPU utilization 80% 95%
Memory usage 80% 95%
Free Space 30% 25%
Achievable RPO >30 mins >45 mins

A clear relation between the PS and its replicated items is established on the replicated item blade. This helps in faster issue identification and resolution for ongoing replication.

Replicated Item Blade

A view of the replicated item blade.

All these health signals roll up to consolidated Process Server health. This visible parameter helps in choosing a PS when new machines need to be protected, or when load balancing between existing PSes is required. At the time of Process Server selection the warning health status deters the user’s choice by raising warning, while critical health completely blocks the PS selection. The signals are powerful as the scale of the workloads grows. This guidance ensures that the apt number of virtual machines are connected to a Process Server, and that related issues can be avoided.

                                       Healthy Process Server Critical Process Server

Enable Replication Workflow with Healthy Process Server (Left) and with Critical Process Server (Right)

Process Server health signals for CPU utilization, memory usage and free space are available from 9.24 version onwards. Throughput related alerts will be available in the subsequent releases.

Related links and additional content

5 internal capabilities to help you increase IoT success

Viewing all 5971 articles
Browse latest View live


<script src="https://jsc.adskeeper.com/r/s/rssing.com.1596347.js" async> </script>