Quantcast
Channel: Category Name
Viewing all 5971 articles
Browse latest View live

Power your Azure GPU workstations with flexible GPU partitioning

$
0
0

Today we're sharing the general availability of NVv4 virtual machines in South Central US, East US, and West Europe regions, with additional regions planned in the coming months. With NVv4, Azure is the first public cloud to offer GPU partitioning built on industry-standard SR-IOV technology.

NVv4 VMs feature AMD’s Radeon Instinct MI25 GPU, up to 32 AMD EPYC™ 7002-series vCPUs with clock frequencies up to 3.3 GHz, 112 GB of RAM, 480 MB of L3 cache, and simultaneous multithreading (SMT).

Pay-As-You-Go pricing for Windows  deployments is available now. One- and three-year Reserved Instance and Spot Pricing for NVv4 VMs will be available on April 1. Support for Linux will be available soon.

Affordable, modern GPU powered virtual desktops in the cloud

As enterprises look to the cloud to provide virtual desktops and workstations in a secure way to a highly mobile workforce, they face the significant challenge of managing cost and performance while meeting user experience expectations. Traditionally, public clouds offered virtual machines with one or more GPUs, which are best suited for the most GPU intensive workloads that required the full power and resources of a GPU. But for the regular knowledge worker profile, a full GPU could be overkill. For some of these customers, multi-session virtual desktops like those offered by Windows Virtual Desktop fit the bill, by letting concurrent sessions share the GPU dynamically. However, some VDI customers need a dedicated virtual machine (VM) per user, either for performance or isolation reasons. For these kinds of workloads, customers are looking for a scale-down option to choose the right GPU size to meet the requirements.

Our customers needed cost-effective VM options that are sized appropriately with dedicated GPU resources for each user, starting from office workers running productivity apps to engineering workstations running GPU-powered workloads such as CAD, gaming, and simulation.

“With the new AMD-powered Workspot cloud desktops on Azure, we now have several perfectly sized cloud workstations for our different workloads. We’ve found the new entry level cloud workstation, using a fraction of the AMD GPU, is just right for our users running Microsoft Office 365 productivity tools and Adobe design tools (Photoshop, Illustrator and InDesign). This fills in an additional much-needed point on the price/performance curve, which allows us to move even more users to the AMD-powered Workspot cloud desktops on Azure.” Andy Knauf, CIO, Mead & Hunt

Pick the right GPU virtual machine size for the VDI user profile

The NVv4 virtual machine series is designed specifically for the cloud virtual desktop infrastructure (VDI) and the desktop-as-a-service (DaaS) markets. We wanted to bring GPU processing power to the masses by putting a slice of the GPU in every desktop in the cloud. NVv4 enables enterprises to provide modern desktops in the cloud, with the ideal balance of price and performance for their workloads.

The following diagram shows how the different VM sizes align with the different VDI user profiles and requirements.

The NVv4 VM sizes mapped to different VDI user profiles to guide customers to pick the right sized VM

“Based on the application requirements of each engineer, we can dedicate all or a fraction of the AMD GPU to their Workspot workstation on Azure. This finer resolution of control gives us the financial edge we need to move more people to Workspot cloud desktops on Azure and increase our overall productivity.”  Eric Quinn, CTO, C&S Companies.

Predictable performance and security with hardware partitioning of the GPU

In Azure, the security of the customer's workload is always a top priority. SR-IOV based GPU partitioning provides a strong, hardware-backed security boundary with predictable performance for each virtual machine. We partition a single AMD Radeon Instinct MI 25 GPU and allocate it up to eight virtual machines. Each virtual machine can only access the GPU resources dedicated to them and the secure hardware partitioning prevents unauthorized access by other VMs.

The diagram describes the interactions between the host and the guest SR-IOV drivers for GPU partitioning

“The Azure NVv4 VM series offers ArcGIS Pro users an exceptional graphical user experience. The four NVv4 sizes provide flexibility to accommodate workloads ranging from light GIS editing to 3D manipulation. ”  Ryan Danzey, Sr. Product Engineer – Performance, ESRI ArcGIS

Designed to work with Windows Virtual Desktop and VDI partners you use today

Customers in the VDI segment have many choices for remote protocol and infrastructure management. We worked closely with the key partners to ensure support for NVv4 virtual machines.

Windows Virtual Desktop supports the new NVv4 virtual machines with native WVD deployments that use RDP as well as solutions delivered by Citrix and VMware, our approved providers.

NVv4 virtual machines support Microsoft Remote Desktop Protocol (RDP), Teradici PCoIP, and HDX 3D Pro. The graphics API support covers DirectX 9 through 12, OpenGL 4.6, and Vulkan 1.1.

Windows Virtual Desktop, Citrix, Teradici, Workspot, and Nutanix Frame are some of the Azure VDI partners who have extensively validated the new NVv4 virtual machines and are ready to offer it to their customers.

"This is exciting news for our Citrix customers who are delivering Citrix Workspaces from the cloud. As we see more customers migrate to the cloud, the release of the NVv4 instance ensures that customers have more options to deliver graphically accelerated  Citrix workloads  on Azure while optimizing costs." - Carisa Stringer, Sr Director Workspace Services Product Marketing

"The new Azure NV_v4 series will give our Xi Frame customers a wider range of GPU options for their virtual desktop and application streaming needs. By enabling virtualized GPUs in the cloud, Azure now delivers a whole new level of value that unlocks a much broader set of use cases."  Carsten Puls, Sr. Director of Xi Frame at Nutanix.

“The flexibility that Azure NVv4 provides to share and access GPU resources as needed is a valuable feature that we see will benefit many Teradici customers. We are excited to be working with Microsoft and AMD to enable more flexible, cost-effective GPU options for virtual desktop and virtual workstation use cases such as AEC.”  Ziad Lammam, Vice President of Product Management at Teradici

“With the new AMD-powered Workspot cloud workstations and the use of industry leading cloud offerings in Azure, ASTI and Workspot are positioned to address the needs of the SMB market for Virtual Desktop Infrastructure in the AEC industry. These new AMD-powered systems will provide the computing power and graphics power of enterprise class systems, that allow an organization to spend less time managing their resources and more time completing projects.  They provide a balance of computing power and graphics performance without costly over provisioning.” Doug Dahlberg, Director of IT Operations, Applied Software (ASTI) - Workspot and Microsoft Partner

Next steps

For more information on topics covered here, see the following documentation:


Azure Container Registry: Preview of customer-managed keys

$
0
0

The Azure Container Registry team is sharing the preview of customer-managed keys for data encryption at rest. Azure Container Registry already encrypts data at rest using service-managed keys. With the introduction of customer-managed keys you can supplement default encryption with an additional encryption layer using keys that you create and manage in Azure Key Vault. This additional encryption should help you meet your company’s regulatory or compliance needs.

Figure 1: Create Container Registry with customer-managed keys encryption enabled

Azure Container Registry encryption is supported through integration with Azure Key Vault. You can create your own encryption keys and store them in a Key Vault, or you can use Azure Key Vault API to generate encryption keys. With Azure Key Vault, you can also audit key usage.

During preview, customer-managed keys can only be enabled while creating a new registry in the Premium SKU. Enabling and disabling the feature on an existing registry will be available in an upcoming release.

With this release, you can try out the following scenarios on a customer-managed keys enabled registry:

  1. Rotate the encryption keys using the Azure portal or the Azure command-line interface (CLI).
  2. Geo-replicated registries and Virtual Network integration are supported.
  3. You can enforce encryption for your registries through the built-in Azure Policy.

You can try out this feature using Azure Portal or the Azure CLI. For details, please see the documentation.

Availability and feedback

The Azure portal and CLI experience for customer-managed keys in Azure Container Registry are now in preview. As always, we love to hear your feedback on existing features as well as ideas for our product roadmap.

Roadmap: For visibility into our planned work.

UserVoice: To vote for existing requests or create a new request.

Issues: To view existing bugs and issues or log new ones.

ACR documents: For Azure Container Registry tutorials and documentation.

Announcing the general availability of Azure Monitor for virtual machines

$
0
0

Today we're announcing the general availability of Azure Monitor for virtual machines (VMs), which provides an in-depth view of VM performance trends and dependencies. You can access Azure Monitor for VMs from the Azure VM resource blade to view details about a single VM, from the Azure Virtual Machine Scale Sets (VMSS) resource blade to view details about a single VM scale set, and from Azure Monitor to understand compute issues at scale.

Azure Monitor for VMs brings together key monitoring data about your Windows and Linux VMs, allowing you to:

  • Troubleshoot guest-level performance issues and understand trends in VM resource utilization.
  • Determine whether back-end VM dependencies are connected properly and which clients of a VM may be affected by any issues the VM is having.
  • Discover VM hotspots at scale based on resource utilization, connection metrics, performance trends, and alerts.

Performance

Performance views are powered by Log Analytics, and offer powerful aggregation and filtering capabilities including “Top N” VM sorting and searching across subscriptions and regions, aggregation of VM metrics (such as average memory) across all VMs in a resource group across regions, percentiles of performance values over time, and breakdown and selection of VM Scale Set instances.

It can be challenging to monitor thousands of VMs. Our performance views were created to address this problem. You can use them to figure out which VMs are resource constrained, which ones are having logical disk or memory consumption issues, or to get performance diagnostics.

1.	At scale performance list view of all the VMs in a subscription
Performance view for a single VM

Maps

Azure Monitor for VMs includes dependency maps powered by the Service Map dependency agent extension. Maps deliver an Azure-centric user experience, with VM resource blade integration, Azure metadata, and dependency maps for Resource Groups and Subscriptions. Maps show how VMs and processes are interacting and can identify dependencies on third party services. Azure Monitor for VMs also monitors connection failures, live connection counts, network bytes sent and received by process, and service-level latency.

Dependency map for the VMs in a subscription

In addition to the visual experience and group-level mapping in the user experience, you can query the data sets in Log Analytics to alert on spikes in network traffic from selected workloads, query at scale for failed dependencies, and plan Azure migrations from on-premises VMs by analyzing connections over weeks or months. To assist in this analysis we offer several workbooks that provide tabular views into this rich network data set.


Connections workbook showing outbound connections for all VMs in a subscription

Getting started

To get started with an Azure resource, go to the resource blade for your VM or VM scale set and click on Insights in the Monitoring section. When you click Enable, you’ll be prompted to pick an existing Log Analytics workspace or create one.

Enable detailed monitoring for a VM

Once you’re comfortable with the capabilities on a few VMs, you can view VMs at scale in Azure Monitor under Virtual Machines, and on-board to entire resource groups and subscriptions using our Get Started page, Azure Policy, or Powershell.

Get started with onboarding several VMs to detailed monitoring

Check out our full documentation to get more details. Pricing is based on data ingestion and retention to your Log Analytics workspace. We’d love to hear what you like and don’t like about Azure Monitor for VMs, and where you’d like us to take it. Please click Provide Feedback in the user experience to share your thoughts.

Learn new strategies and technologies to optimize your hybrid cloud

$
0
0

IT environments are becoming more complex as organizations are combining on-premises, cloud, and edge infrastructures. There are some major benefits to having a flexible, hybrid IT environment, such as the ability to create new business value while also meeting local and industry compliance requirements, but the headaches of managing and securing these environments are hard to ignore. But, with a solid strategy and the right tools, there’s enormous potential for innovation and growth with a hybrid environment.

This is why we're sharing the upcoming one-hour Azure Hybrid Virtual Event on Tuesday, March 31, 2020 starting at 8:00 AM Pacific Time. At this free online event, you’ll get to watch demos, learn hybrid best practices, and find out which strategies work—and which don’t—from two real Azure hybrid customers: online retailer ASOS and professional services company KPMG. Julia White, Corporate Vice President of Microsoft Azure Marketing, will kick off the event with a keynote on current and future hybrid cloud trends, followed by some great sessions:

  • Insights from Bain & Company—building a successful hybrid cloud: Hear from Bill Radzevych, a partner at Bain & Company, about market trends and customer insights with digital transformation and cloud adoption. 
  • Seamlessly manage and govern resources: Learn how to seamlessly manage, govern, and secure resources across on-premises, multicloud, and the edge from a single control plane.
  • Bring cloud services to any infrastructure: Learn how to bring cloud services to your existing infrastructure to take advantage of cloud innovation everywhere and discuss real-world examples from companies like KPMG.
  • Modernize your datacenter: Learn how to modernize virtualized apps or bring cloud to your datacenter while meeting regulatory and data sovereignty requirements.
  • Bring AI to the edge: Learn about different ways to take advantage of edge computing to create new business opportunities.
  • Secure your organization: Hear from George Mudie, Chief Information Security Officer from ASOS, on how Azure Sentinel empowers their SecOps to improve organizational security and efficiency.


See you there

Azure Hybrid Virtual Event: Tuesday, March 31, 2020 from 8:00 AM to 9:00 AM Pacific Time.

Delivered in partnership with Intel.

Screenshot (33)

Visual Studio Code Docker extension 1.0 – Better than Ever!

$
0
0

We recently released the 1.0 version of our Visual Studio Code Docker extension, which is the first general availability (GA) release. The Docker extension makes it easier to build apps that leverage Docker containers. The extension helps scaffold needed files, build Docker images, debug your app inside a container, and an explorer that makes it easy to take actions on containers and images such as start, stop, inspect, remove, and more.

Image Docker GA

Diagram 1: Docker extension 1.0

This version of the extension gives Python developers an integrated debugging experience as well as specific support for Django and Flask apps. It also provides Python and .NET Core developers with the same support for Compose that Node.js developers already have. Install the extension, or if you already have it installed then it should update automatically. There are several features that will make your Docker container development experience easier and more efficient when scaffolding, running, debugging, and troubleshooting your containerized apps in Visual Studio Code.

What’s New in 1.0

There are several new features in the 1.0 version of the extension, the following focuses on a few of them.

Docker Tools Love Python

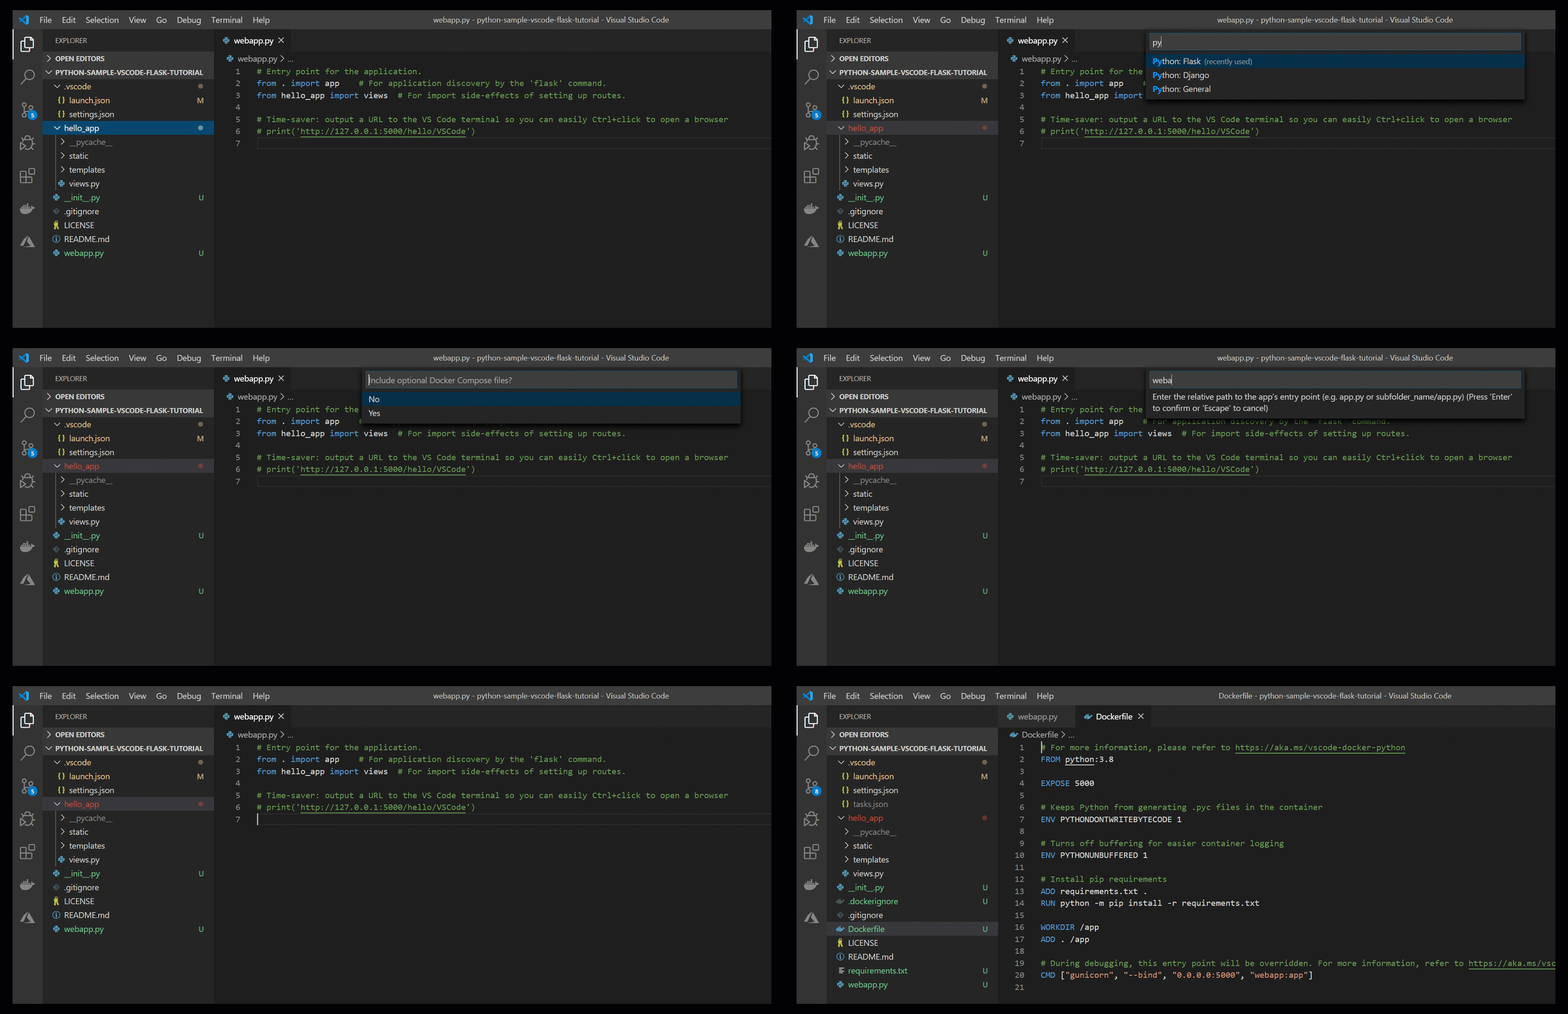
We heard from many of our Python developers that the extension could do a better job scaffolding the initial Dockerfile, especially when using Django or Flask. Now, when you add Docker files to your workspace, you can select Django or Flask. Based on your response we’ll scaffold the appropriate Dockerfile, debugging tasks, and launch configurations. Don’t worry, we still support a “General” option as well if you want a more generic Dockerfile.

Image Docker GA Release Scaffold 3

Diagram 2: Scaffolding a Python Flask Dockerfile

Docker Compose or Dockerfile

Compose is great when you want to start more than one service at a time, or even a single service if you need specify Docker ‘run’ parameters like port mappings, environment variables, volume mappings, and more. That said, if you just need to start a single container with few parameters, using just a Dockerfile might work fine.

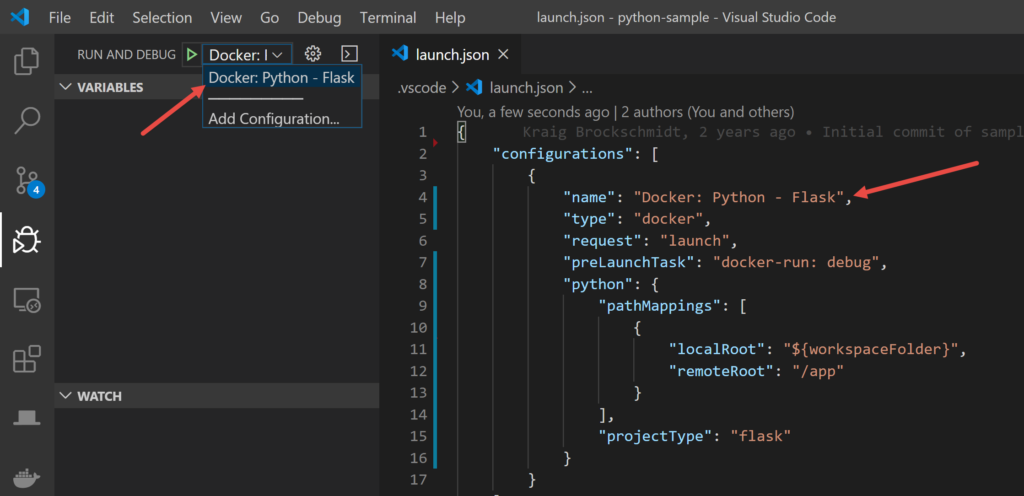
The Docker extension now supports using either a Compose.yml file or only a Dockerfile. Additionally, for Node.js, Python, and .NET Core we support integrated debugging of a single service using a Dockerfile. When using the command “Docker: Add Docker Files to Workspace”, the extension places configurations in the tasks.json and launch.json files. This makes debugging your app inside a container just a couple clicks away. On the Debugger panel, choose a Docker configuration and start debugging. An image will be built using the Dockerfile, a container will be started using this image, and then your app will be started inside the container with the debugger attached. You can now use the debugger to set breakpoints and step through your code.

Image Python Debugging

Diagram 3: Debug configuration for Python (Flask) in a Docker container

Docker Command Customization

When using palette commands or context menus in the explorer, the Docker extension executes commands on your behalf. With the 1.0 release of the extension, you can customize many of these commands. For example, when you run an image, you can now have the extension put the resulting container on a specific network. See the documentation for details on what commands can be customized.

Work with Multiple Containers or Images

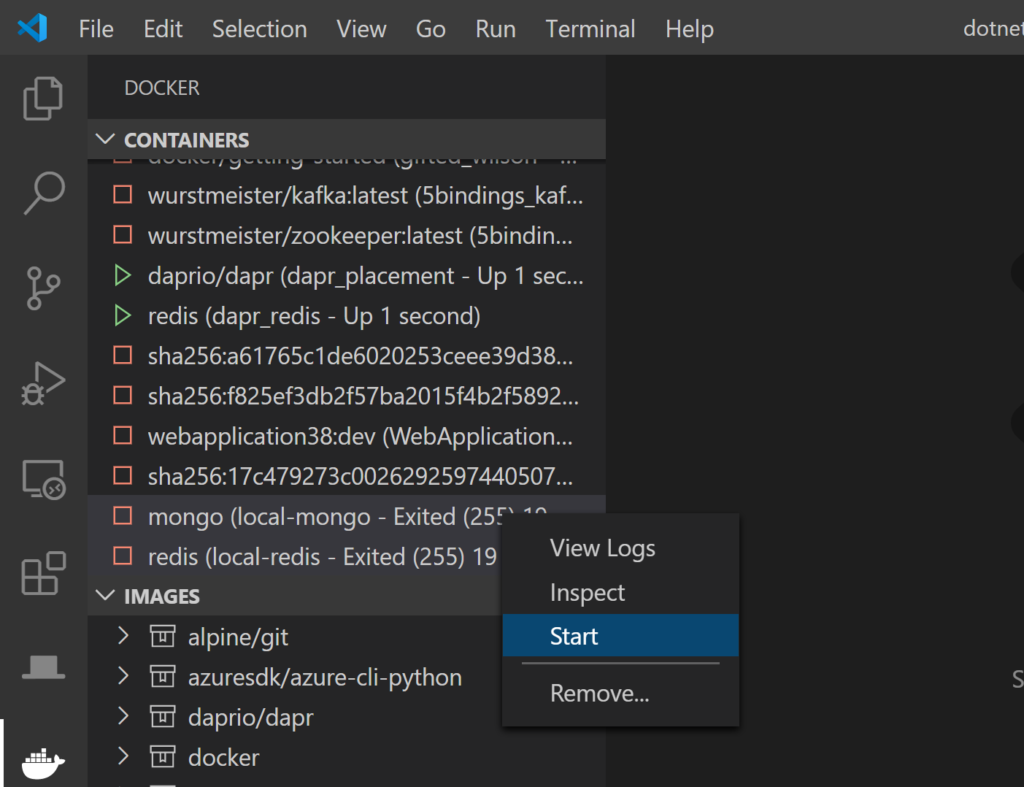
One of the most asked for features was the ability to select multiple containers or images when executing commands, such as starting/stopping containers or running/removing images. You can now select multiple containers or images and then use the context menu to execute a command on all the selected items. In addition, if you run a command from the command palette, such as “Docker Containers: Start” you will see a list of all of the containers that can be started with a checkbox next to each.

Image MultiSelect

Diagram 4: Multi-selecting containers to Start/Stop

WSL 2 (Windows Subsystem for Linux 2) Support

If you are running a version of Windows that includes WSL 2, you can enable the WSL 2 experimental engine in Docker Desktop which leverages WSL 2 rather than using HyperV to run Linux containers. As of the 0.9.0 version of the Docker extension, the use of WSL 2 is supported and encouraged!

And More…

A few other features you will find helpful in the 1.0 release of the Docker extension are:

  • Task-based debugging for Node.js, Python, and .NET Core enables customization of ‘docker build’ and ‘docker run’ scenarios
  • New “Open in Browser” menu added to Containers treeview to quickly open a browser to the exposed port
  • When scaffolding the Dockerfile for .NET Core, it is now placed next to project file which is much better when multiple projects exist in a repo
  • The extension pulls the latest image when executing ‘docker build’ to keep images up to date

Try it Today

If you haven’t already, make sure to download the Visual Studio Code Docker extension. With this release we hope you’ll find scaffolding, running, debugging, and troubleshooting your containerized apps easier and more efficient than ever! We encourage you to leave your comments below or submit an issue on the GitHub repo. As with many of our Visual Studio Code extensions, the Docker extension is open source! This means you can read the code to learn or jump in and work on the code or docs. Together we can make the experience great for everyone.

The post Visual Studio Code Docker extension 1.0 – Better than Ever! appeared first on Visual Studio Blog.

Visual Studio 2019 version 16.5 is now available

$
0
0

The Visual Studio 2019 team here in Redmond has been living under a perpetually grey, wet winter sky since our last minor release. Thankfully, we are beginning to see the sun making regular appearances.  It is our hope this newest release will also brighten your day. Visual Studio 2019 version 16.5 contains anticipated new features from XAML, .NET, C++ and Debugging.  In addition, we have addressed several issues found in our Preview releases. We believe this combination is ready to make your developer journey more productive. If you have any additional ideas to contribute to our product, we invite you to participate in our Developer Community forum.

While I elaborate, why not download our latest version to try for yourself? Also keep in mind, a more complete list of all changes are available in the Visual Studio 2019 release notes.

.NET Mobile Development

Our first feature to discuss is XAML Hot Reload for Xamarin.Forms. This feature speeds up your development and makes it easier to build, experiment, and iterate over your mobile app’s user interface. How? You do not need to rebuild your app each time you tweak your UI as changes instantly show while the app is running! Because this updates as you make changes, if you have interacted with the application, the state of the application is not lost as you make the changes.  Consequently, you do not have to recreate the repo as you previously did. That’s pretty exciting, isn’t it?

We heard lots of feedback on a specific need shared via Developer Community Suggestions.  Due to the fact, you wanted to see changes made to your XAML reload instantaneously on multiple targets such as an iOS simulator and Android emulator, so we have added that capability.

 .NET Productivity

To help with .NET Productivity several features ship in this Visual Studio 2019 version 16.5 release.

First of all, you can convert if statements to switch statements or switch expressions. To do this, place your cursor on the if keyword. Press Ctrl+. to trigger the Quick Actions and Refactorings menu. Finally, select Convert to ‘switch’ statement or Convert to ‘switch’ expression.

Convert if statements to switch statements
Convert if statements to switch statement
IntelliSense

Furthermore, IntelliSense now supports completion for unimported extension methods. To access this ability, you will need to enable this option in Tools > Options > Text Editor > C# > Intellisense > and select Show items from unimported namespaces(experimental).

Simplify Interpolation

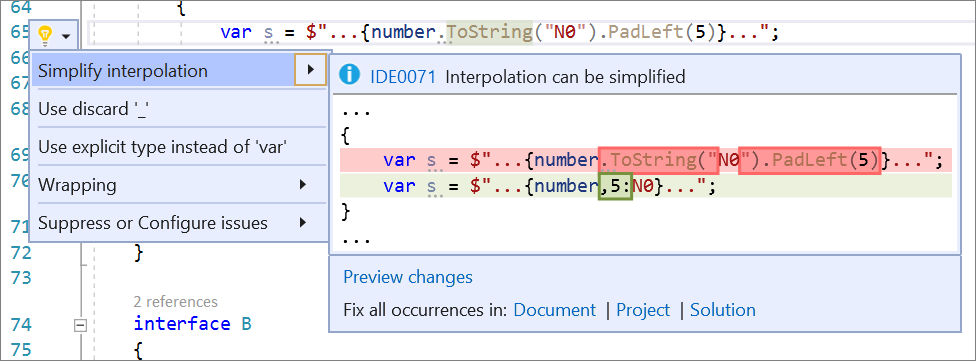
Additionally, we added the ability to simplify string interpolation refactoring. This will help make your string interpolation more legible and concise. Place your cursor on the string interpolation. Press Ctrl+. to trigger the Quick Actions and Refactorings menu and select Simplify interpolation. 

Simplify interpolation
You can Simplify Interpolation through the Quick Actions and Refactorings menu.

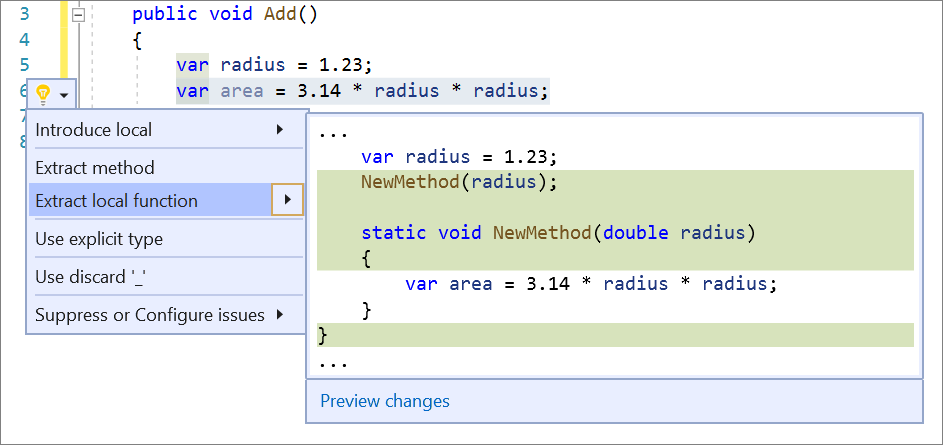
The Extract local function refactoring allows you to turn a fragment of code from an existing method into a local function. Highlight the code you want extracted. Press Ctrl+. to trigger the Quick Actions and Refactorings menu and select Extract local function. 

Extract local function
You can Extract Local Function through the Quick Actions and Refactorings menu

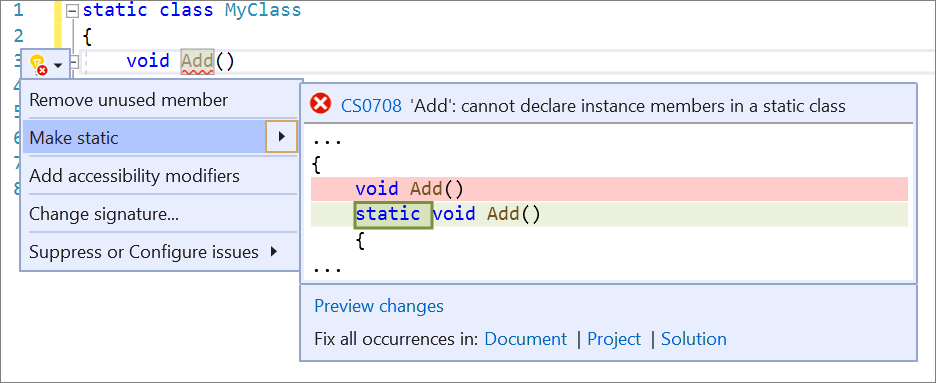
The make members static code fix helps improve readability by making a non-static member static. Place your cursor on the member name. Press Ctrl+. to trigger the Quick Actions and Refactorings menu and select Make static. 

Make a member staticv
You can make a member static through the Quick Actions and Refactorings menu.

Testing

Profiling is an excellent tool for identifying performance issues in your code. You can now profile a .NET Core test. To do so your .NET Core projects must be configured to generate full PDB’s. We also recommend upgrading to a minimum version of 16.4 for the Microsoft.Test.SDK. This will enable you to profile tests in both x86 and x64 architecture settings. To profile a test, select Profile from the context menu in the Test Explorer. Test profiling is supported through static instrumentation and Performance Explorer (.vsp) document in Visual Studio.

Debugging in C++ and .NET

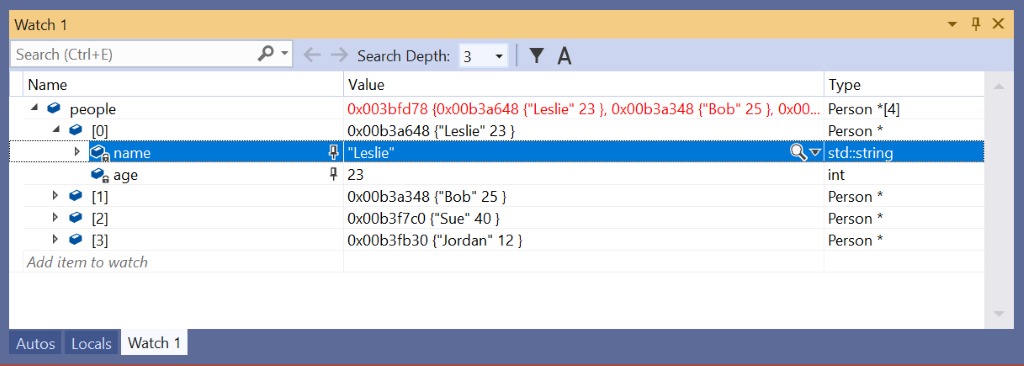
Pinnable Properties has been a popular tool for managed code debugging. Specifically, this allows quick visibility of an object’s property without the need of drilling into an object. This feature is now available in C++ for DataTips and the Autos, Locals, and Watch windows.  To use the tool, hover over a property and select the toggle-able pin icon that appears or select the Pin Member as Favorite option in the context menu, bubbling your selected property to the top of your debugger display. 

Pinnable Properties in Debugger
Pinnable Properties tool in Debugger

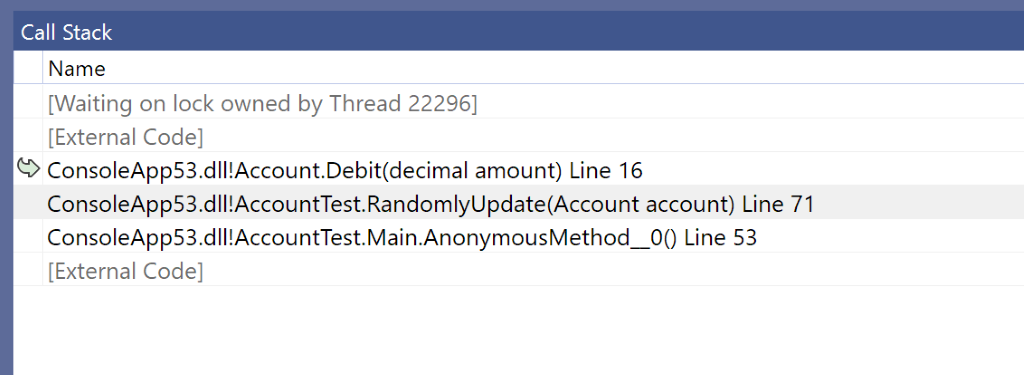
We’ve also added a new capability to assist you in debugging multithreaded applications.  This helps avoid struggling to determine the source of a deadlock or other thread-related bugs. Subsequently, you can now view which managed thread is holding a .NET object lock in the Call Stack window, Parallel Stacks window and the location column of the Threads window. 

Call Stack Window
.NET Object lock in the Call Stack window, Parallel Stacks window

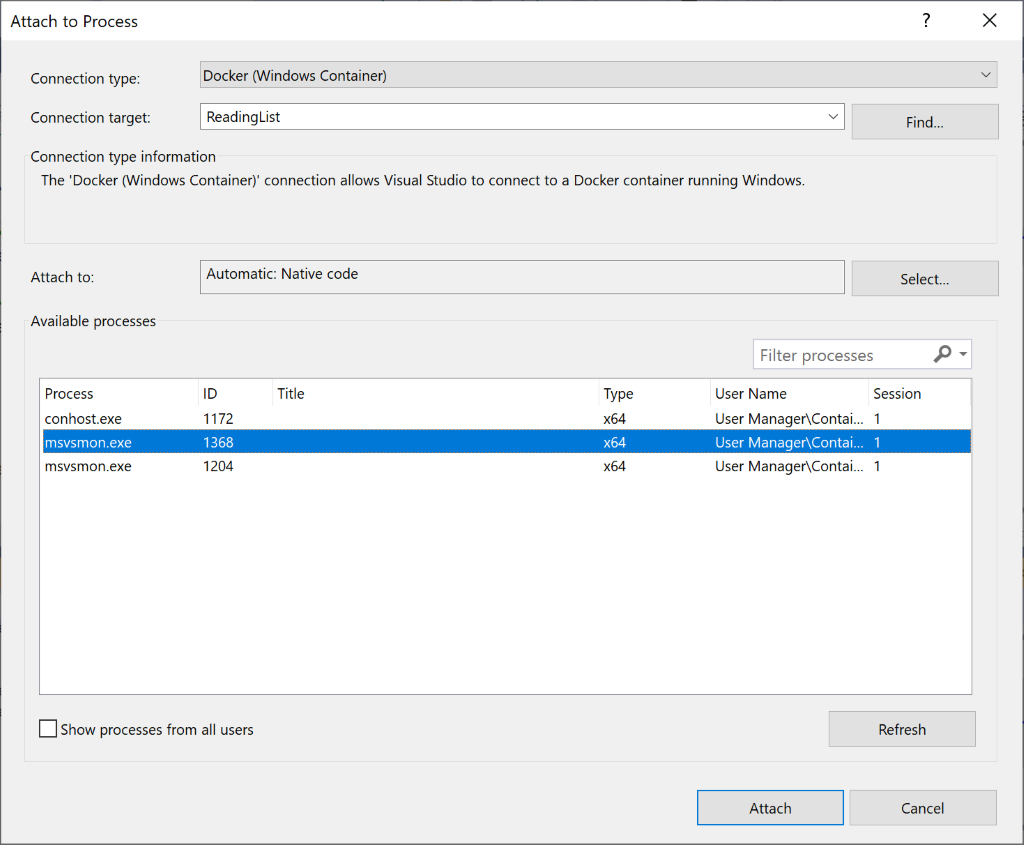
In a previous update, we made it possible to debug processes running in Docker Linux containers. Now, you can do the same in Docker Windows containers. To give this at try, attach and debug that .NET Framework, .NET Core, and C++ process in the Attach to Process window by selecting the Docker (Windows Container) connection type.   

Docker Window Container
Docker Window Container Process

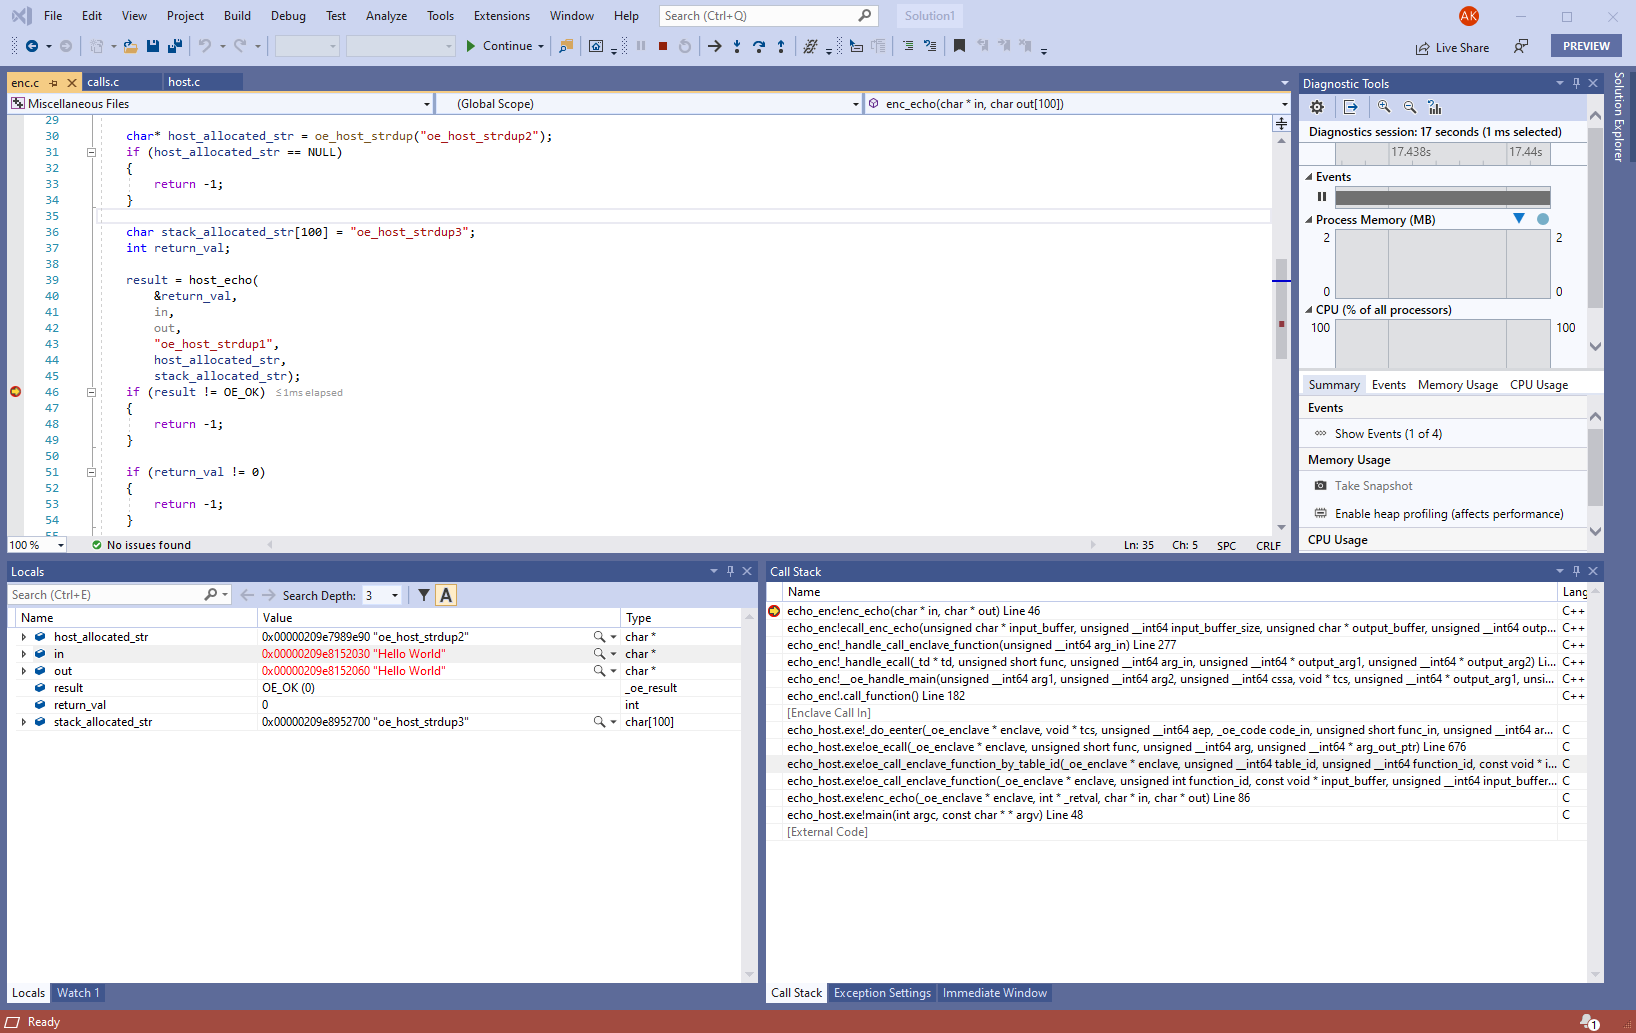
Finally, for developers building applications on top of the Open Enclave SDK we’ve added debugging support in Visual Studio 2019 version 16.5. So, you can now debug those applications from within the product, for more information, go to aka.ms/OpenEnclaveVisualStudio. 

Image 165GAdockerwindow2


.NET Object Allocation Tool

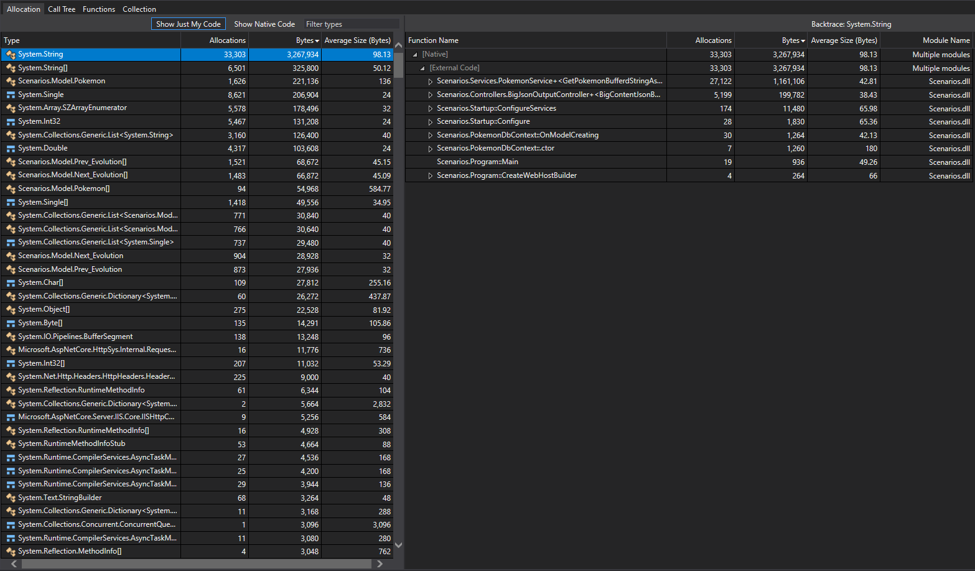
The .NET Object Allocation tool has been updated with changes aimed to help you visualize your data more easily and reduce the time you spend on memory investigations.  

First, the backtrace view has been moved to a separate panel to enable you to more easily distinguish between the allocation type and the functions within the type being called. Additionally, when an allocation type is selected the call tree is oriented from the leaf to root node to more quickly see what specific function is allocating the most memory and needs to be changed. Lastly, a new average size column has been added both to the allocation type panel and backtrace view. This information is helpful if you are trying to investigate what allocation types or functions are taking up a lot of memory per allocation. Furthermore, all of these columns are sortable and can be toggled on or off so that you can customize the tables to look the way you want. 

Also, take notice of the new icons added to the allocation, call tree, and functions view, so it is easier to visualize the classes and structures being allocated. The two icons represent value types (blue) and reference types (yellow). By the way, a number of other user experiences such as more icons and performance improvements are coming soon to Visual Studio! 

.NET Object Allocation Tool


C++ Improvements in Visual Studio 2019 version 16.5

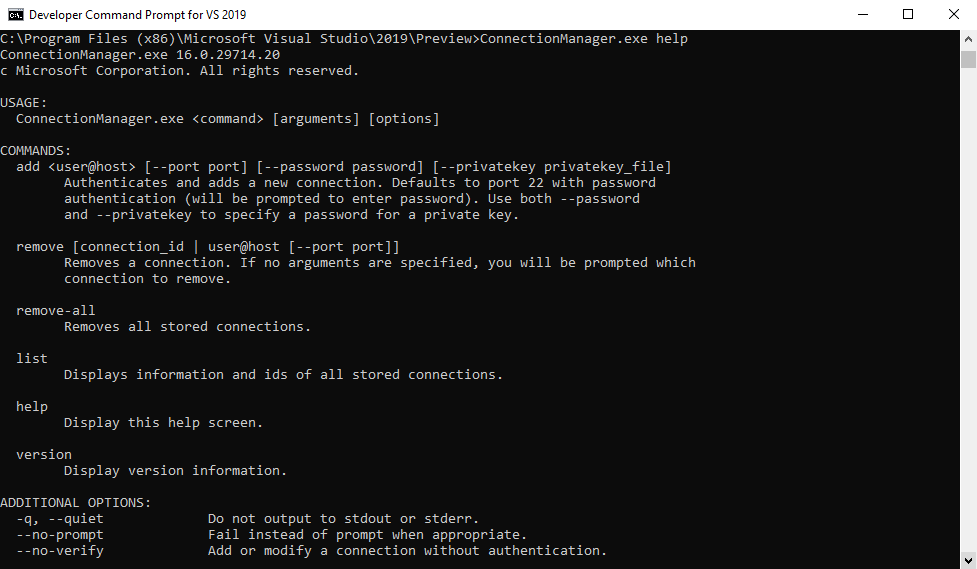
Visual Studio 2019 version 16.5 brings several improvements to the C++ cross-platform and CMake development experience. Starting with this release, you’re now able to interact with your stored remote connections over the command line. This is useful for tasks such as provisioning new development machines or setting up Visual Studio in continuous integration. 

Interact with stored remove connections through the Developer Command Prompt

In addition, this release brings the ability to leverage native support for Windows Subsystem for Linux when separating your build system from a remote deploy machine, allowing you to build natively on WSL and to deploy the build artifacts to a second remote machine for debugging. This workflow is supported by both CMake projects and MSBuild-based Linux projects. 

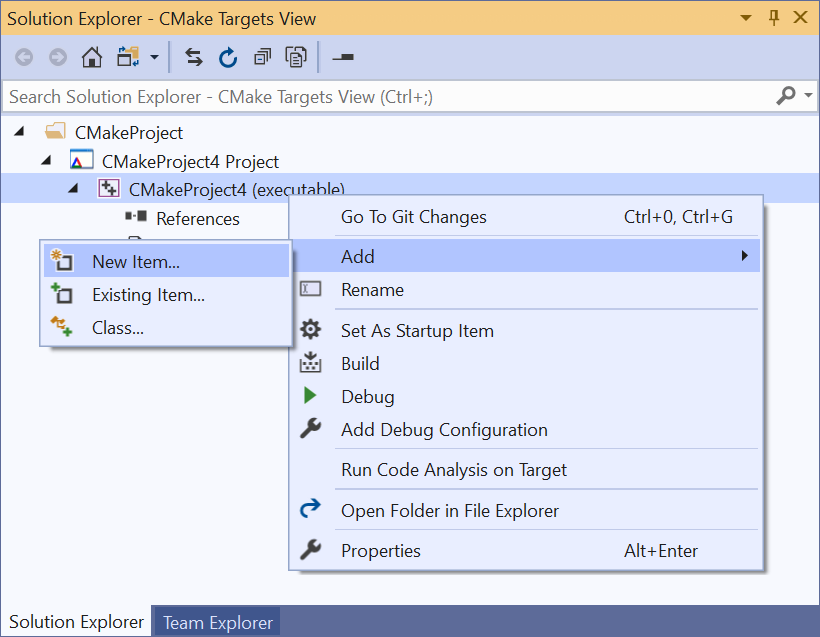
Visual Studio version 16.5 makes it easier than ever to work with CMake projects in Visual Studio. Specifically, this release brings the ability to add, remove, and rename source files and targets in your CMake projects from the IDE without manually editing your CMake scripts. When adding and removing files with the Solution Explorer, Visual Studio will automatically edit your CMake project. Furthermore, you can also add, remove, and rename the project’s targets from the Solution Explorer’s Targets View, as shown below. You can learn more about this and related features at the C++ Team Blog. 

Add, remove, and rename source files in CMake projects

New CMake code navigation features such as Go To Definition and Find All References make it easier to explore and understand complex CMake projects. The navigation feature supports variables, functions, and targets in CMake script files. They work across your entire CMake project to offer more productivity than naïve text search across files and folders. Also, they are integrated with other IDE productivity features such as Peek Definition. 

Download Visual Studio 2019 version 16.5 Today!

As you can see, Visual Studio 2019 version 16.5 gives plenty of new functionality to help you with your development projects. Give it a try today and tell us what you think.

Additionally, if you would like to try out future features, check out our Preview channel to give our next product iteration a try. This Preview release brings additional changes to WFT/UWP Tooling, JavaScript/TypeScript, and Web Tooling. The version 16.6 Preview 1 release notes give full details about each of these features.

As always, we look forward to your feedback!


The post Visual Studio 2019 version 16.5 is now available appeared first on Visual Studio Blog.

Stay informed on the coronavirus pandemic with Bing and Microsoft News

$
0
0
In an effort to help you stay up-to-date on the COVID-19 pandemic, Bing has released features that help you discover comprehensive information on case locations, infection prevention, and more.

Simply search for “covid19”, “coronavirus information”, or a related term, and you’ll find a tally of the cases in your geographic region as well as an up-to-date summary of global cases. This information is aggregated across multiple sources such as the Center for Disease Control, the World Health Organization, and other authoritative sources. As the situation is changing rapidly, we’re refreshing the data multiple times per day, and show a timestamp for when we published the latest available data.

You can also click the “additional info” tab for links to reliable sources on relevant topics such as prevention, symptoms, and treatment. These views are currently live in the US and we plan to make them available in more countries soon.
 
serp_results.png
 
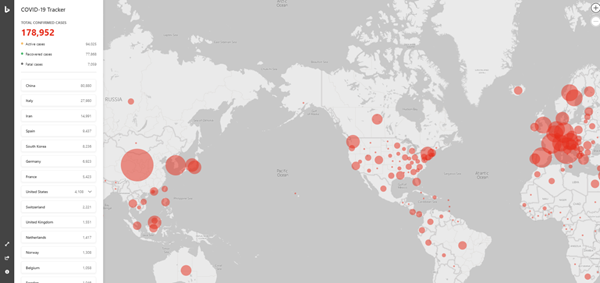
You can also click on the expand button on the map or go to bing.com/covid to see a full-page view of active cases, recovered cases, and deaths by country overlaid onto an interactive map of the world. We are working on providing a more granular view of data; currently, we have cases on a per-state view in the US and plan to have regional data for other countries soon. This page is available globally and on mobile via the Bing app and the mobile website.
 
map.png
 
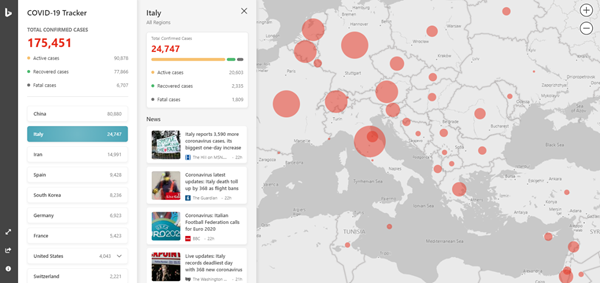
In addition to the per-country data, you can click on a region to see links to top local news related to the coronavirus.
 
map_news.png

You can also see full-page coverage up coronavirus updates at Microsoft News, which features dedicated global and local coverage of coronavirus news in 39 countries and all 50 US states.

microsoft_news.png

These features are just the beginning. We’re working hard to provide additional resources as the situation continues to evolve. If you have feedback, please click the ‘Feedback’ button at the bottom of the search results page.
 

New features for Form Recognizer now available

$
0
0

Extracting text and structure information from documents is a core enabling technology for robotic process automation and workflow automation. Since its preview release in May 2019, Azure Form Recognizer has attracted thousands of customers to extract text, key and value pairs, and tables from documents to accelerate their business processes.

Today, we're sharing the new Form Recognizner features that are available.

Updates for Azure Form Recognizer

The Form Recognizer March release is a major update that includes many new features our customers have asked for:

  • Customization: The service now supports training with and without labels, which makes it easier for customers to reliably extract valuable information from their forms. The APIs have also been redesigned as long-running operations to improve support for larger customer data sets. Automatic detection of key value pairs and table extraction have been enhanced and improved. A new sample labeling tool UX container will help customers label data more efficiently and extract the values of interest.
      

Form Recognizer Custom showing Train with Labels, Form Recognizer Sample Labeling Tool

Form Recognizer Custom: Train with Labels, Form Recognizer Sample Labeling Tool.

In addition, Form Recognizer Sample Labeling Tool is now available as an open source project located here. You can integrate it within your solutions and make customer-specific changes to meet your needs.

  • Layout: We released a new Layout API that is capable of extracting text and tables from documents with high accuracy optical character recognition (OCR) results on small texts. It also extracts tables from arbitrary documents, enabling a very popular application scenario for document extraction.

Layout text and table extraction, showing table extracted with 5 columns and 30 rows

Layout text and table extraction: Table extracted with 5 columns and 30 rows.

  • Pre-Built Receipt: The new version features major accuracy improvements. Error rates for certain fields like merchant name, phone number, transaction time, and subtotal have been reduced by more than 30 percent. We also added support for recognizing tips, receipt type, and line items, as well as providing confidence values.
       

Pre-built Receipt , showing key fields extracted from itemized sales receipt

Pre-built Receipt: Key fields extracted from itemized sales receipt.

Learn more on what’s new in Form Recognizer here.

Our customers

Acumatica and Zelros are customers using Azure Form Recognizer and have shared their experiences with Microsoft.

“By automating expense reporting with Form Recognizer, we can eliminate almost all human errors—which really helps accounting teams streamline approvals and reimbursement.“ Ajoy Krishnamoorthy, Vice President of Platform and Technology Acumatica.

Learn more in our case study with Acumatica here.

“Zelros Documents2Insights leverages Form Recognizer to speed up the insurers' and bancassurers’ underwriting process. Identity card, proof of residence, vehicle registration document, driving license, and more. Speeding up and simplifying this business process is key to improve the experience of policyholders. Zelros Documents2Insights automates the underwriting processes, based on the Cognitive Services Computer Vision API and built on top of the Form Recognizer feature, the solution automatically reads and analyzes documents. It also cross-references information in order to correct and lower the error rate, while complying with regulatory requirements. With this, we are to process documents and subscriptions faster.”  Fabien Vauchelles, CTO of Zelros

Getting started

To get started, please login to the Azure Portal to create a Form Recognizer resource. Once your resource is created you can extract data from your forms by following one of our Quickstart templetes:

Custom: Train a custom model for your forms to extract text, key value pairs, and tables.

Prebuilt receipts: Extract data from USA sales receipts.

Layout: Extract text and table structure (row and column numbers) from your documents.


OData Connected Service version 0.5.0 Release

$
0
0

OData Connected Service 0.5.0 has been released and is available in the Visual Studio Marketplace.

The new version has the following new features:

  1. A new version of the Microsoft.OData.Client library(v7.6.3)
  2. Supports mocking of the generated functions and properties.
  3. An option to open the generated files in the IDE after code generation.

In addition to the above features, the new version has the following improvements and fixes:

  1. Generation of type definitions using their underlying types.
  2. The Microsoft WCF Toolkit dependency has been removed.
  3. All features and fixes from OData Client Code Generator are now in OData Connected Service.

Microsoft.OData.Client v7.6.3

OData Connected Service version 0.5.0 comes with Microsoft.OData.Client v7.6.3 which has great improvements: Some of the improvements are: 

  1. Save ODataPath ToList for improved performance.
  2. Performance improvements in FunctionOverloadResolver.
  3. Fixes for OData.net Client throwing InvalidOperationException when calling ‘Move’ on a DataServiceCollection.
  4. Fixes for supporting escape function and key values terminating in colon.
  5. Fixes for IN operator fails on strings with commas in them.
  6. Allow Microsoft.OData.Client.Serializer.GetKeyString to receive an IDictionary Object.
  7. Fixes for $filter in (null) not working.
  8. Fixes for Combine Dispose methods on JsonWriter.

Supports Mocking of the generated functions and properties

The generated methods and properties can be mocked for purposes of testing your client code. You can use any Mock Framework to mock these methods.The following is a simple example to show that the generated methods can be mocked using the Moq Framework.

public string AddPerson(DefaultContainer defaultContainer)
{
    Person person = new Person
    {
        FirstName = "PersonA"
        //…there are many more fields here. 
    };
    try
    {
        defaultContainer.AddToPeople(person).
        return "Saved Successfully".
    } catch (Exception exception)
    {
        return "Not Saved Successfully”. 
    }   
}

Using the Moq Framework, we can setup the AddToPeople() method to return whatever we want it to return whenever we call it. Like below.

public void Return_SavedSuccessfully_WhenAddToPeopleMethodIsCalled()
{
     string response = "Add".
     Mock<DefaultContainer> mock = new Mock<DefaultContainer>(null).
     mock.CallBase = true;
     mock.Setup(x => x.AddToPeople(It.IsAny<Person>())).Callback(() => { response = "Saved Successfully"; });
     Users users = new Users ();
     string result = users.AddPerson(mock.Object);
     Assert.Equal(result, response).
}

An Option to open the generated files in the IDE after code generation

This option has been added on the OData Connected Service setup wizard. It is on the Advanced Settings page. You can use this setting when you want the generated file to open in the IDE after code generation.To set this option, follow the following steps:

If you have the OData Connected Service extension installed,

  1. Right click on the project you are working on from the solution explorer.
  2. Select Add->Connected Service from the context menu.
  3. From the Connected Service Window that opens, select the Microsoft OData Connected Service.
  4. On the wizard window, configure your service endpoint by providing the service name and the OData URL endpoint then click Next.
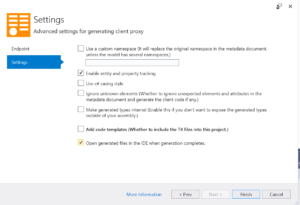
  5. On the Next page, click on the “AdvancedSettings” link.

Image snap1

Check the checkbox beside the “Open generated files in the IDE when generation completes” configuration on this page then click finish.

Image snap2

The generated file will open in the IDE once the code generation process completes.

Generation of type definitions using their underlying types.

The previous versions of OData Connected Service could not generate code for an endpoint whose schema had:

  1. Elements with type definitions like the Outlook Beta API  
    <TypeDefinition Name="DateTime" UnderlyingType="Edm.String"/>
  2. Functions with parameters whose types are based on type definitions like below:
    <Function Name="MyFunc" IsBound="true">
       <Parameter Name="StartDate" Type="MyNamespace.DateTime" />
       <ReturnType Type="Edm.Int32" Nullable="false" />
    </Function>

This issue has been solved in the OData Connected Service version 0.5.0. The OData Connected Service can now generate type definitions using their underlying types without any errors or exceptions.

All features and fixes from OData Client Code Generator are now in OData Connected Service.

The OData Connected Service version 0.5.0 is now in sync with the latest version of the Microsoft OData Client Code Generator. All features and fixes in the Microsoft OData Client Code Generator are now available in OData Connected Service.

Removed the Microsoft WCF Toolkit dependency .

The Microsoft WCF Toolkit dependency has been removed from this version. That is, you do not need to install the WCF Toolkit for you to generate client code.

There are more features and fixes coming to OData Connected Service soon, so stay tuned for upcoming releases.

The post OData Connected Service version 0.5.0 Release appeared first on OData.

Updates on .NET Core Windows Forms designer

$
0
0

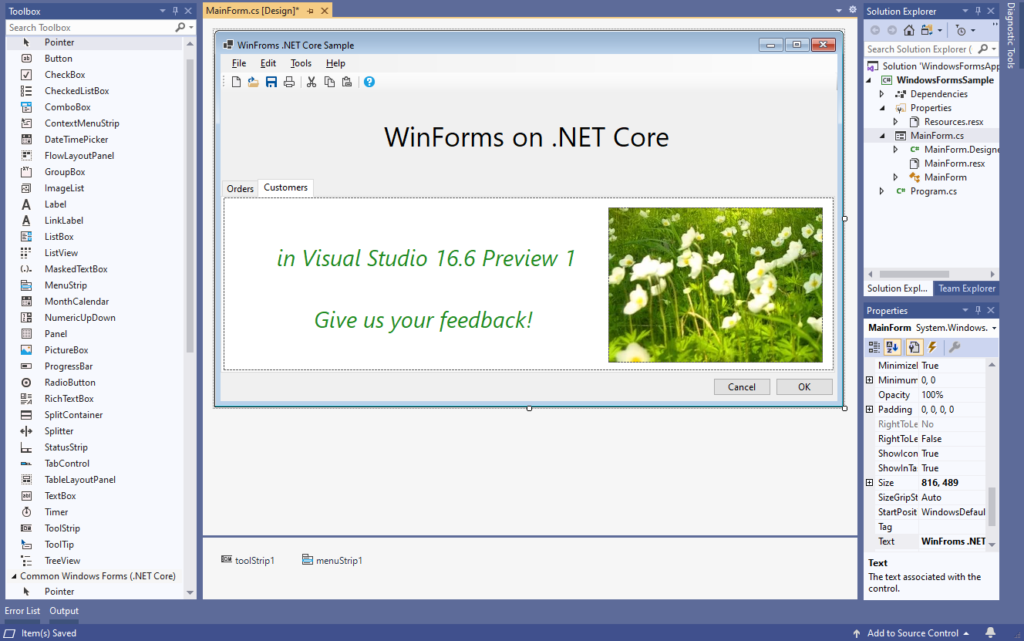
We released a preview version of Visual Studio 16.6 – Visual Studio 2019 version 16.6 Preview 1 and with it a new version of .NET Core Windows Forms designer.

.NET Core Windows Forms designer in Visual Studio

This release contains

  • Support for the following controls:

    • FlowLayoutPanel,
    • GroupBox,
    • ImageList,
    • MenuStrip (via the PropertyBrowser and context menu),
    • Panel,
    • SplitContainer,
    • Splitter,
    • TabControl,
    • TableLayoutPanel,
    • ToolStrip (via the PropertyBrowser, context menu and designer actions).
  • Local resources and localized forms were enabled in the designer.

  • Support for LayoutMode and ShowGrid/SnapToGrid settings via Tools->Options.

  • Reliability and performance improvements.

  • Other minor fixes and tweaks.

Coming next

In the future releases we will be working on User Controls and third-party controls support, integration with popular controls vendors, support for Data Controls and related scenarios, performance improvements and other features.

How to use the designer

  • You need to use Visual Studio Preview channel
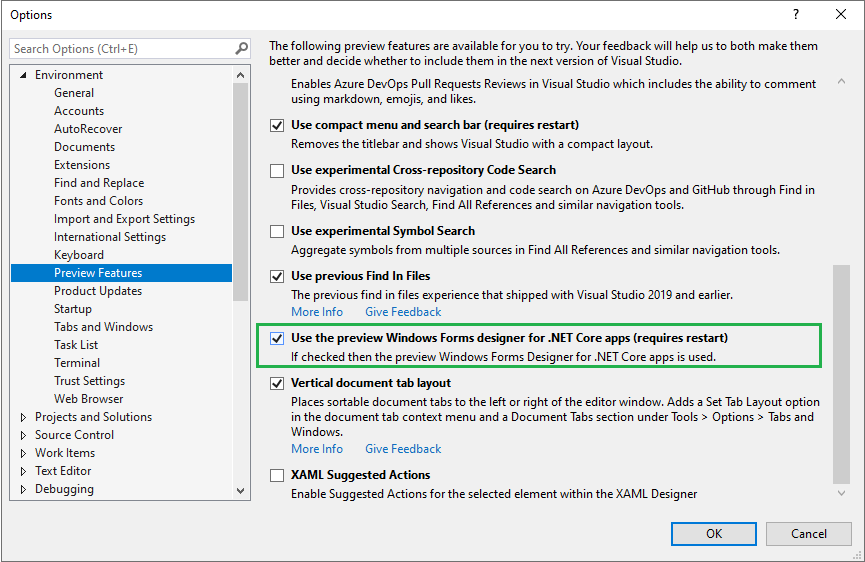
  • You need to enable the designer in Visual Studio. Go to Tools > Options > Environment > Preview Features and select the Use the preview Windows Forms designer for .NET Core apps option.

Enabling .NET Core Windows Forms designer in Visual Studio Settings

How to report issues

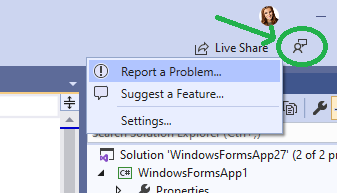
Your feedback is important to us! Please report issues and send feature requests via the Visual Studio Feedback channel. Use the “Send Feedback” icon in Visual Studio top-right corner as shown below and specify that it is related to the “WinForms .NET Core” area.

Visual Studio Feedback channel

The post Updates on .NET Core Windows Forms designer appeared first on .NET Blog.

.NET Framework March 2020 Update for Windows 10 1607 (Anniversary Update) and Windows Server 2016.

$
0
0

Today, we are releasing an update for .NET Framework 4.8 on Windows 10 1607 (Anniversary Update) and Windows Server 2016.

Security

This update does not contain any new security fixes. See January 2020 Security and Quality Rollup for the latest security updates.

Quality and Reliability

This release contains the following quality and reliability improvement.

CLR1

  • Addresses an issue when the hosting of a .NET Framework implemented COM server in a DllSurrogate (e.g. dllhost.exe) that is running elevated is unable to opt-out of a security mechanism put in place in .NET Framework 4.8. This fix respects the opt-out mechanism and permits the COM server the ability to properly activate. This update does nothing to change the behavior or robustness of .NET Framework 4.8 when the opt-out mechanism is not set.

1 Common Language Runtime (CLR)

Getting the Update

The Update is available via Microsoft Update Catalog only.

Microsoft Update Catalog

You can get the update via the Microsoft Update Catalog. For Windows 10, NET Framework 4.8 updates are available via Microsoft Update Catalog.

Note: Before applying this update, please ensure that you carefully review the .NET Framework version applicability, to ensure that you only install the update on systems where it applies.

Product Version Update
Windows 10 1607 (Anniversary Update) and Windows Server 2016
.NET Framework 4.8 Catalog 4550993

Previous Monthly Rollups

The last few .NET Framework Monthly updates are listed below for your convenience:

The post .NET Framework March 2020 Update for Windows 10 1607 (Anniversary Update) and Windows Server 2016. appeared first on .NET Blog.

Helping small and medium-sized businesses work remotely with Teams

Visual Studio for Mac: Refresh(); event recap

$
0
0

We had a great time at the Visual Studio for Mac: Refresh(); event on February 24th! All the videos, slides, and links to demo code are available for you to watch, use for your own virtual events, blog posts, etc. in this repo.

In case you couldn’t watch it then, here’s a session recap and links to the on-demand videos:

Keynote: A Fresh Look at Visual Studio for Mac

Video | Slides | Links

Amanda Silver (CVP of Product for Developer Division) kicked off the event by describing how Visual Studio for Mac fits in to Microsoft’s suite of developer tools that meet the challenges of modern software development. She reviewed the Visual Studio for Mac release roadmap, with a focus on recent improvements in stability, performance, and .NET developer features. Next, Aaron LeBeau (Mobile Technologies Tech Lead at EY) reviewed how his team uses Visual Studio for Mac to develop .NET applications, including web, mobile, and shared libraries. Finally, Scott Hunter wrapped up with a review of what’s new in .NET Core 3.1, with some compelling demonstrations running in Visual Studio for Mac.
Image vsformacrefresh 3

Building Blazor applications on a Mac

Video | Slides | Links
Daniel Roth (Program Manager for Blazor) and Kendra Havens (Program Manager on the Visual Studio team) gave an exciting introduction to building modern web applications using web assembly using Blazor. Learn how to get started building Blazor applications on Mac from this all-star team!

Realtime web applications, from your Mac to the Cloud, with SignalR + Azure

Video | Slides | Links

Brady Gaster (Program Manager for SignalR) showed how to build real-time web applications using SignalR, with lots of fun features like WebSockets on Azure App services, client targeting, Blazor integration, automatic reconnection, and scaling with Azure SignalR Service. Along the way, he showed off some cool Visual Studio for Mac features like Run Configurations and integrated Docker support. Let’s party in real-time!

ASP.NET Core on macOS

Video | Slides | Links

Sayed Ibrahim Hashimi and I overviewed web development using ASP.NET Core on macOS. Sayed demonstrated how the ASP.NET Core project templates make it easy to create new ASP.NET Core projects, including some more sophisticated cases like Blazor, React.js, and Angular projects with authentication. Once you get going, there’s also support for unit testing, scaffolding, and debugging. Sayed and Jon recommended the Razor Pages Movie tutorial for getting started with ASP.NET Core development on Mac.

Serverless on a Mac

Video | Slides | Links

Jeff Hollan gives a great introduction to serverless development using Azure Functions and Visual Studio for Mac. He starts with basic definitions and serverless application patterns, explains the different project templates, shows how to develop and debug locally on your Mac, then shows how to deploy to Azure from Visual Studio for Mac. Once your serverless applications are deployed, you’ll want to monitor and scale them, and Jeff shows how to do that, too.

Building Mobile Applications on .NET with Xamarin

Image vsformacrefresh 4Video | Slides | Links
You can build mobile applications that run on iOS, Android, macOS, and more using Xamarin. Maddy Leger and James Montemagno introduce Xamarin, then show off tons of cool demonstrations of Xamarin development in Visual Studio for Mac. And now that we’ve got dual screen devices on the way, James and Maddy wrap up by showing off dual screen support in Xamarin.Forms.


Game Development with Unity

Video | Slides | Links

Want to learn about game development on Mac? Abdullah Hamed and Sarah Sexton have you covered! They start with overviewing the Unity environment, then dig into script editing and debugging features in Visual Studio for Mac. Finally, they show off some new features in Visual Studio for Mac 2019, like the Roslyn analyzers for Unity. During the Q&A section at the end, there’s some really good information on getting started resources and useful assets in the Unity Asset Store.

How to be productive developing .NET on a Mac

Video | Slides | Links

Ready to geek out on some cool tips and tricks for .NET dev on your Mac? Great! So are Mikayla Hutchinson and Kendra Havens! Get ready to learn about features that will speed up your code editing and navigation, simplify things like code formatting and searching, and much more. Two top short-links from this session that you’ll want to keep handy:

Closing and Virtual Attendee Party

Video

Jeff Fritz and I recapped the event and raffled off lots of prizes. There are tons of trivia, a few of Jeff’s wacky sound effects, and a bonus demo from keynote demo speaker Aaron LeBeau showcasing a native Mac application he wrote on the plane using Visual Studio for Mac. And coming up, we’ve got Jeff Fritz’s “May is for Macs” Twitch stream series, when he’ll be spending the whole month developing .NET apps on macOS.

The post Visual Studio for Mac: Refresh(); event recap appeared first on Visual Studio Blog.

Delivering online meetings and events

$
0
0

Microsoft Teams Meetings, Microsoft 365 live events, LinkedIn Live, and—coming soon—PowerPoint Live are all designed to help you create engaging, effective virtual gatherings. And we want to help you make the most of them.

The post Delivering online meetings and events appeared first on Microsoft 365 Blog.

Unified network monitoring with Connection Monitor now in preview

$
0
0

Azure Network Watcher’s new and improved Connection Monitor now provides unified end-to-end connection monitoring capabilities for hybrid and Azure deployments. Users can now use the same solution to monitor connectivity for on-premises, Azure, and multi-cloud setups. In this preview phase, the solution brings together the best of two key capabilities—Network Watcher's Connection Monitor and Network Performance Monitor's (NPM) Service Connectivity Monitor. Check out the documentation and start using Connection Monitor to check connectivity in your network.

The monitoring question

Customers have long stressed over the need for unified connection monitoring for hybrid deployments, where complex applications transact across Azure, on-premises, and with other public applications to deliver business-critical functionality. These challenges escalate in multi-cloud environments. Monitoring teams then wrestle with basic challenges including:

  • Which monitoring solution to use in these complex set-ups?
  • Do I need different monitoring solutions for on-premises and Azure or any other clouds?
  • Where does my data go and how do I correlate data from multiple sources?
  • How do I get the fastest alerts when things go wrong in my network?

Connection Monitor in preview

With the new Connection Monitor, you can now configure both Azure and non-Azure virtual machines and hosts for monitoring connectivity to global endpoints from a single console. You can set up Connection Monitor and create multiple test groups for various use cases including connectivity between Azure regions, connectivity to Office 365, and connectivity between app and database tiers. With the ability to add multiple sources and destinations in one test group, configuring monitoring gets much easier. You also benefit from an aggregated view of your network parameters, with the ability to drill down to individual links at the time of troubleshooting.

You can monitor loss and latency of network connections both within Azure and between Azure and external destinations, and view the topology to localize issues. The solution identifies the top five tests in your Connection Monitor, test groups, sources, and destinations, then highlights potential problem tests. For Azure resources, issues with your hops are shown in the topology.

Alerts and data storage

Monitoring data is stored in both Azure Monitor as metrics and in Log Analytics workspaces. You can now set up fast, metrics-based alerts to react to issues expeditiously. To build additional correlations on your historical data, use Log Analytics queries.
Other benefits

  • Single console for configuring and monitoring connectivity and network quality from Azure and on-premises virtual machines and hosts.
  • Monitor multiple endpoints within and across Azure regions, on-premises sites, and global service locations.
  • Higher and configurable probing frequencies.
  • More protocols supported to give better visibility into network performance.
  • Cross-region, cross-workspace monitoring.
  • Access to historical monitoring data retained in Log Analytics.
  • Rich user experience.
  • Automation through PowerShell and CLI.

cm-coverage-and-data

cm-tg-test

Start monitoring today

The new Connection Monitor feature will be available for no charge during preview. The general availability pricing for Connection Monitor will be available soon on the pricing page. For more details, please visit the Connection Monitor (Preview) documentation.

We're here for you

We would love to hear from you. Send us your suggestions via the User Voice page.


New Deploy to Azure extension for Visual Studio Code

$
0
0

Organizations and teams that adopt DevOps methodologies are consistently seeing improvements in their ability to deliver high-quality code, with faster release cycles, and ultimately achieve higher level of satisfaction for their own customers, whether they’re internal or external. Continuous Integration and Continuous Delivery (CI/CD) is one of the pillars of DevOps, consisting in automatically building, testing and deploying applications, but setting up a full CI/CD pipeline can be a complex task.

Today, we’re sharing the launch of the Deploy to Azure extension for Visual Studio Code. This new extension allows developers working in Visual Studio Code to seamlessly create, build, and deploy their apps in a continuous manner to the cloud, without leaving the editor.

Deploy to Azure extension

The Deploy to Azure extension works with both GitHub Actions and Azure Pipelines. It helps developers by auto-generating a CI/CD pipeline definition that takes care of building and deploying your app to the cloud with Azure. You can use Deploy to Azure extension to deploy application code present in your local system, or in Azure Repos or GitHub. We plan to expand the scope to other Git repositories in future.

You can use this extension to set up CI/CD pipeline for every code push. It will give you an auto-generated and fully-customizable CI/CD pipeline, defined in a YAML file that is formatted for either GitHub Actions or Azure Pipelines. The YAML file is pre-populated with build and release tasks, which can be edited by the developers as needed.

In the workflow, we are also setting up Azure Pipelines and GitHub with relevant Azure-related configurations, as well as repository-related configurations, without you needing to do worry about the plumbing of the systems.

Installation and usage

The Deploy to Azure extension can be downloaded for free from the Visual Studio Code Marketplace. After installing it, you can invoke it from the Command Palette (Ctrl + P or Cmd + P) > Deploy to Azure: Configure Pipeline.

Deploy to Azure animated  visualizatoin

Once you run the pipeline creation workflow, the extension will inspect your application’s code and generate a pipeline optimized for your project.

In this first release, the Deploy to Azure extension in Visual Studio Code supports generating pipelines to deploy Node.js-based apps to Azure App Service or Azure Functions App, as well as any containerized application (with a Dockerfile) to Azure Kubernetes Service.

We’re working on adding support for creating workflows for other languages, starting with Python, and for other Azure resources. Additionally, we will roll out support for other Git repository providers; in addition to GitHub and Azure Repos which are available today, we’re working on supporting source code on BitBucket and other locations.

We will also roll out support for other Git repository providers; in addition to GitHub and Azure Repos which are available today, we’re working on supporting source code on BitBucket and other locations.

Get started

You can get started today by installing the extension. Then, start adding CI/CD pipelines to your apps and have them deployed to the cloud continuously.

Please let us know your thoughts on this extension and how it helps your workflows, and anything we can do to improve your experience. You can connect with us on the extension’s project page on GitHub.

Facebook’s RapiD Editor Now Includes Microsoft Building Footprints

$
0
0

Over the past few years, Bing Maps has generated high quality building footprints leveraging the power of AI. In September 2019, our team released another Open Buildings Dataset. However, so far there has been no mechanism to get such data into the hands of mappers and speed up the process of mapping.

When Facebook reached out to our team, right around the latest buildings data release, to partner on enriching their RapiD editor with Microsoft Buildings, it was an obvious match. Microsoft is a partner in the Missing Maps initiative, which works to update OpenStreetMap (OSM) to map the largely unmapped parts of the world while RapiD is a tool that makes mapping even easier!

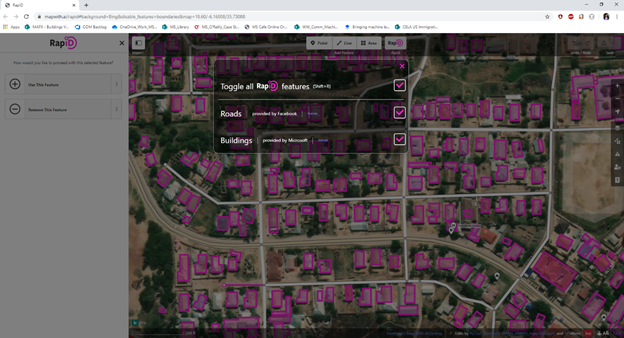
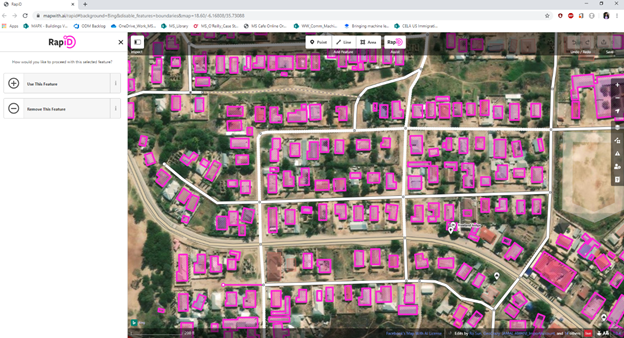
Facebook's RapiD editor is an enhanced version of the popular OSM editing tool, iD. RapiD editor puts AI-generated features (e.g., Facebook Roads or Microsoft Buildings) at the fingertips of mappers allowing them to map more quickly, and more importantly, produce a higher level of detail, quality, and accuracy on the resulting map. RapiD is part of Facebook's Map With AI, an AI-powered set of services and tools the company released publicly in the summer of 2019. Check out the video showing the difference between iD and RapiD.

Facebook and Bing Maps teams worked closely together to integrate Microsoft's buildings dataset into RapiD, including sharing the results with communities at various open mapping conferences like State of the Map (SOTM) US, Humanitarian OpenStreetMap Team (HOT) Summit and SOTM International. The response from these events was very encouraging! Facebook's RapiD with Microsoft's buildings included went live at the end of November 2019, and we are excited to be a part of the effort. We’re happy to announce that all of Microsoft's open building datasets are now available from within the RapiD Editor.

RapiD users now have easy access to a massive collection of approximately 155 M building polygons from Microsoft, outlining structures derived using computer vision models on satellite imagery. While this is great progress, there are still too many places around the world that remain unmapped. AI-assisted mapping can help accelerate the process, taking away the tedious pieces and allowing mappers to add valuable context to maps.

Facebook RapiD - Features

Facebook RapiD - Features


Microsoft has made significant investments in deep learning, computer vision and AI that have been applied to mapping. We are working to further increase the coverage of building footprints with releases of data in the United States, Canada, Tanzania and Uganda with more to come. We'll continue to share any new open buildings with the community through RapiD.

To learn more about our building footprint dataset, how it is derived from imagery, and download it for yourself, go to our GitHub Projects:

For more information about the Bing Maps Platform, go to www.microsoft.com/maps. And you can check out the latest updates to the Map With AI service, including expanded coverage, new tools, and our partnership here: https://tech.fb.com/map-with-ai-updates/.

- Bing Maps Team

Visual Studio for Mac: Become a Productivity Pro

$
0
0

Despite continued advancement and innovation in the IDE space, the bottom line is that IDEs are a productivity tool. As a software developer, the value of an IDE is directly related to how much using the tool increases your productivity. Subsequently, when we make decisions about how to improve Visual Studio for Mac, your productivity is always at the forefront. With that in mind, I want to share with you my favorite time-savers within the IDE that help boost my productivity, and I hope they boost yours as well.


Add Custom Tools

Custom tools are a super powerful feature of Visual Studio for Mac that allow you to add any executable or command line tool to your IDE for easy access and usage. Not only can you add the tool to the Tools menu within Visual Studio for Mac, you can also assign a hotkey to quickly launch the tool.

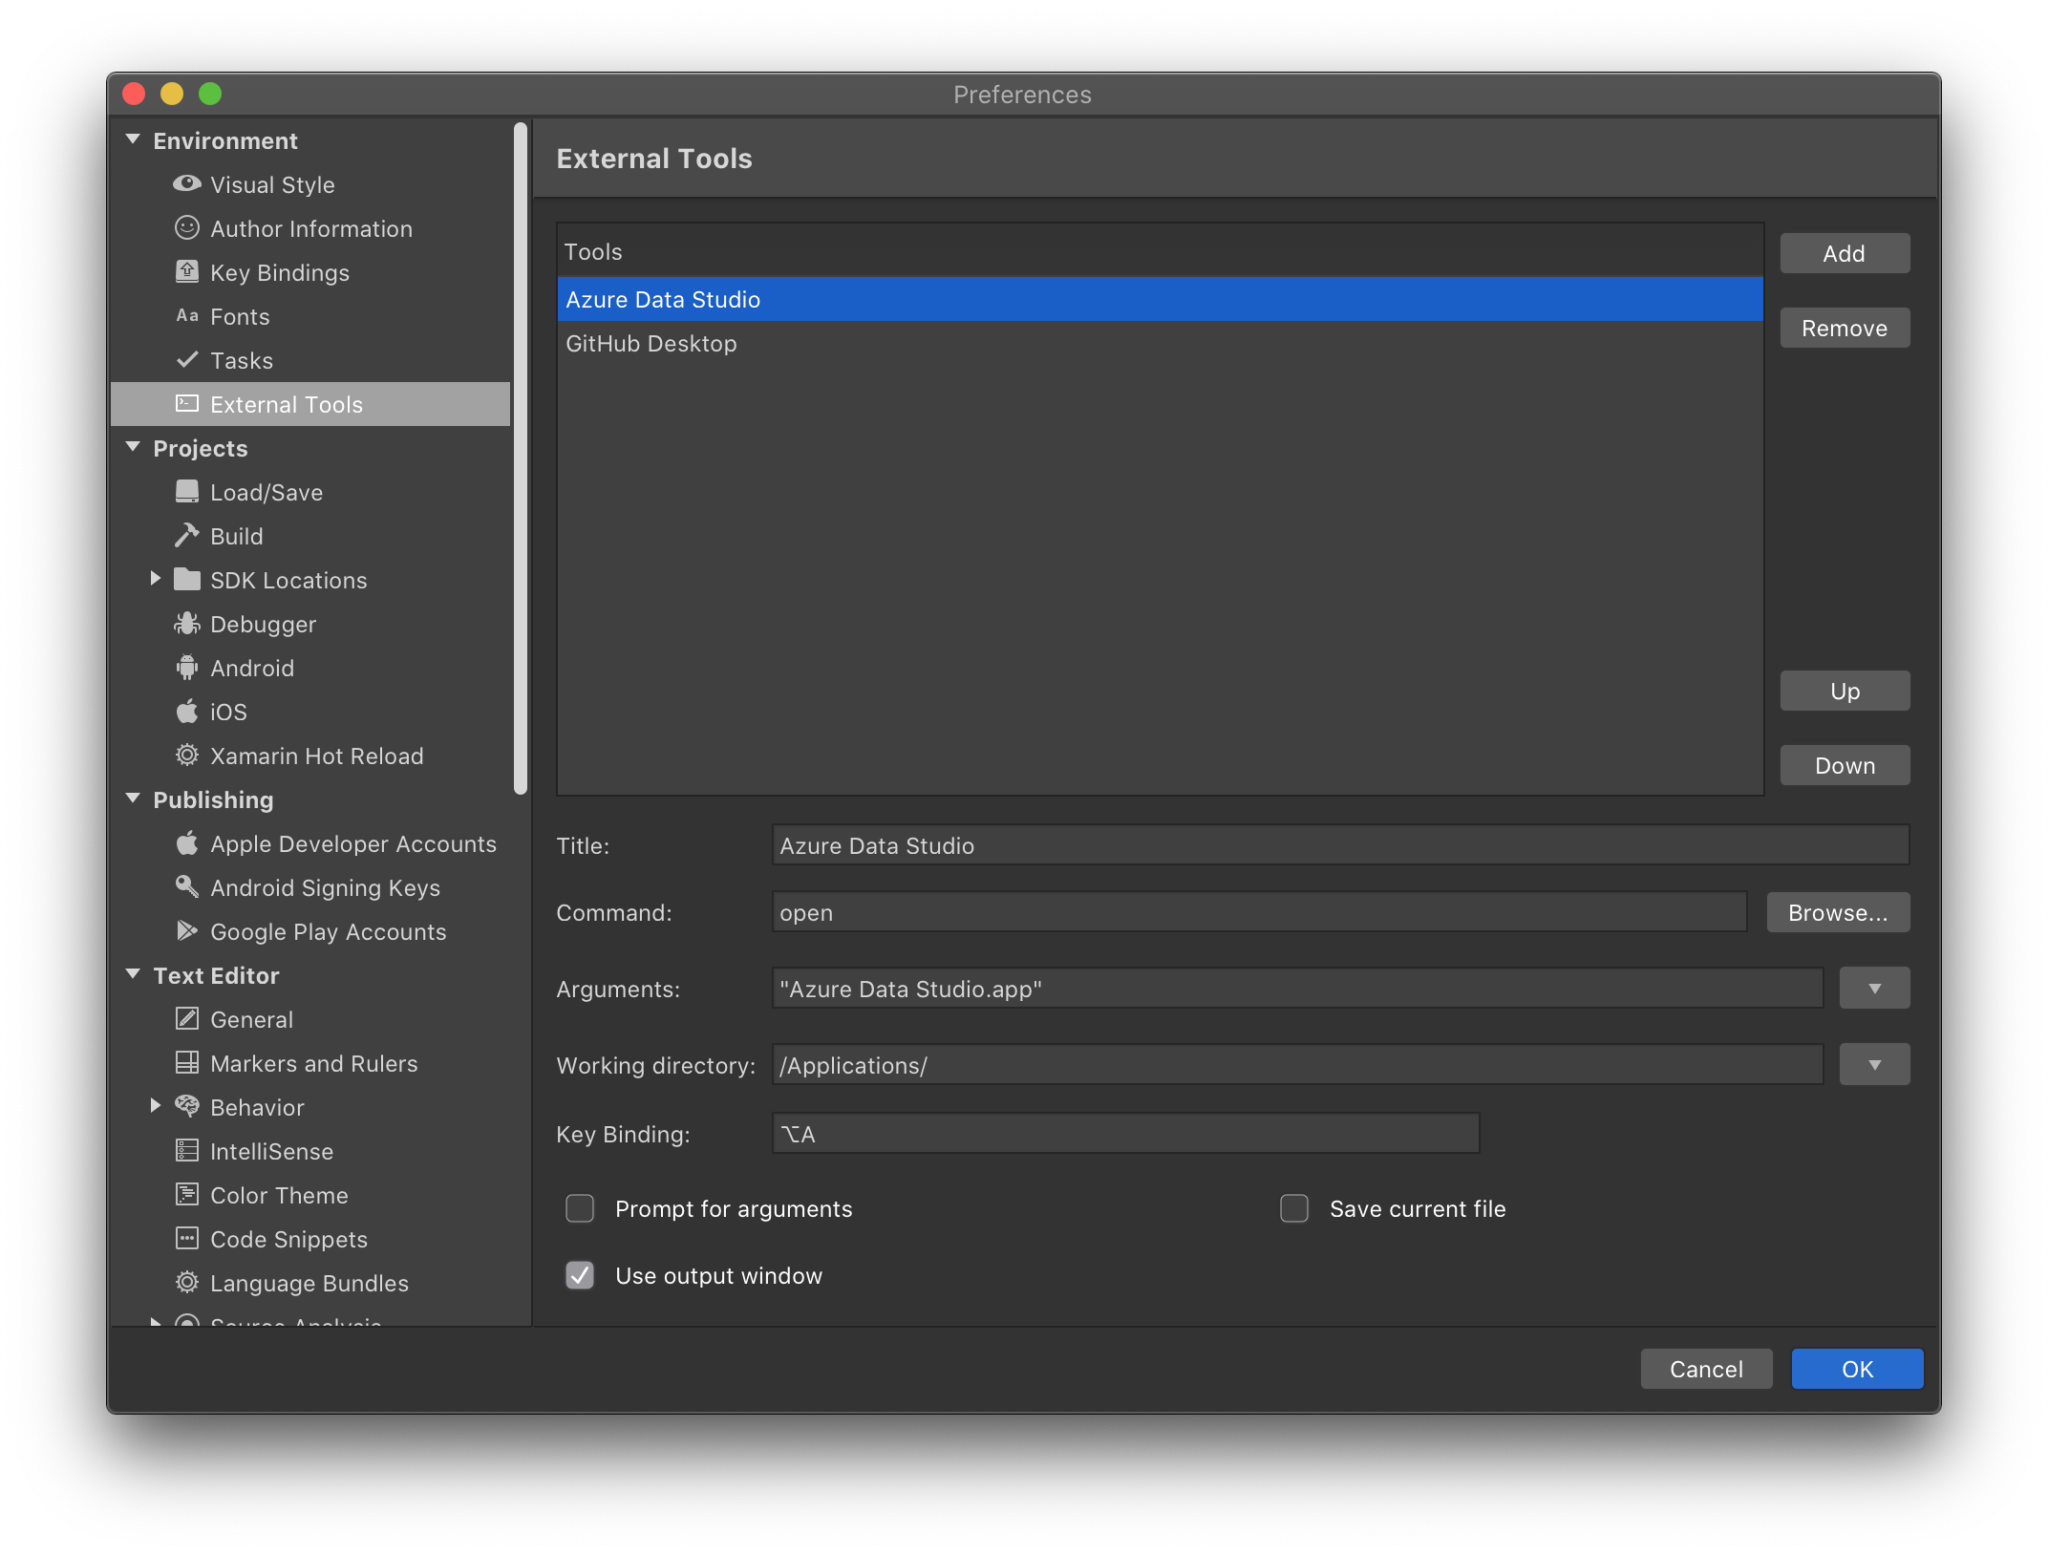
One tool that I simply can’t live without is Azure Data Studio, it is a lightweight SQL management client that allows me to perform SQL commands from my Mac to a SQL server either hosted in Azure or locally (such as within a Docker container on macOS). To add Azure Data Studio to your IDE, simply open Tools > Edit Custom Tools and click “Add”. Here is my configuration for Azure Data Studio:


Image prodtools external


There are a few things to point out here, the first being the command. Since the Custom Tools process issues what is essentially a command line call, we want the command to be “open”, as that is the macOS command for launching an application. From there, we want the Argument to be the name of the .app bundle, extension included. Finally, we want to set the working directory, so the “open” command knows where to find the application bundle.

I also set a Key Binding so I can quickly access the greatness that is the Azure Data Studio. In my case, I used “option-a”, but any key combination not already used elsewhere in the IDE works.


Image CustomTool Retina


Be an editing expert

The next productivity booster I find super useful is to take full advantage of the advanced features in the editor. From multi-caret editing to emoji support, the editor in Visual Studio for Mac offers a bunch of productivity enhancements that make editing code faster, more fluid and more functional. The two features I want to show off today are multi-caret editing and show import items. Both enhancements are focused on improving your productivity, so let’s look at how they work.

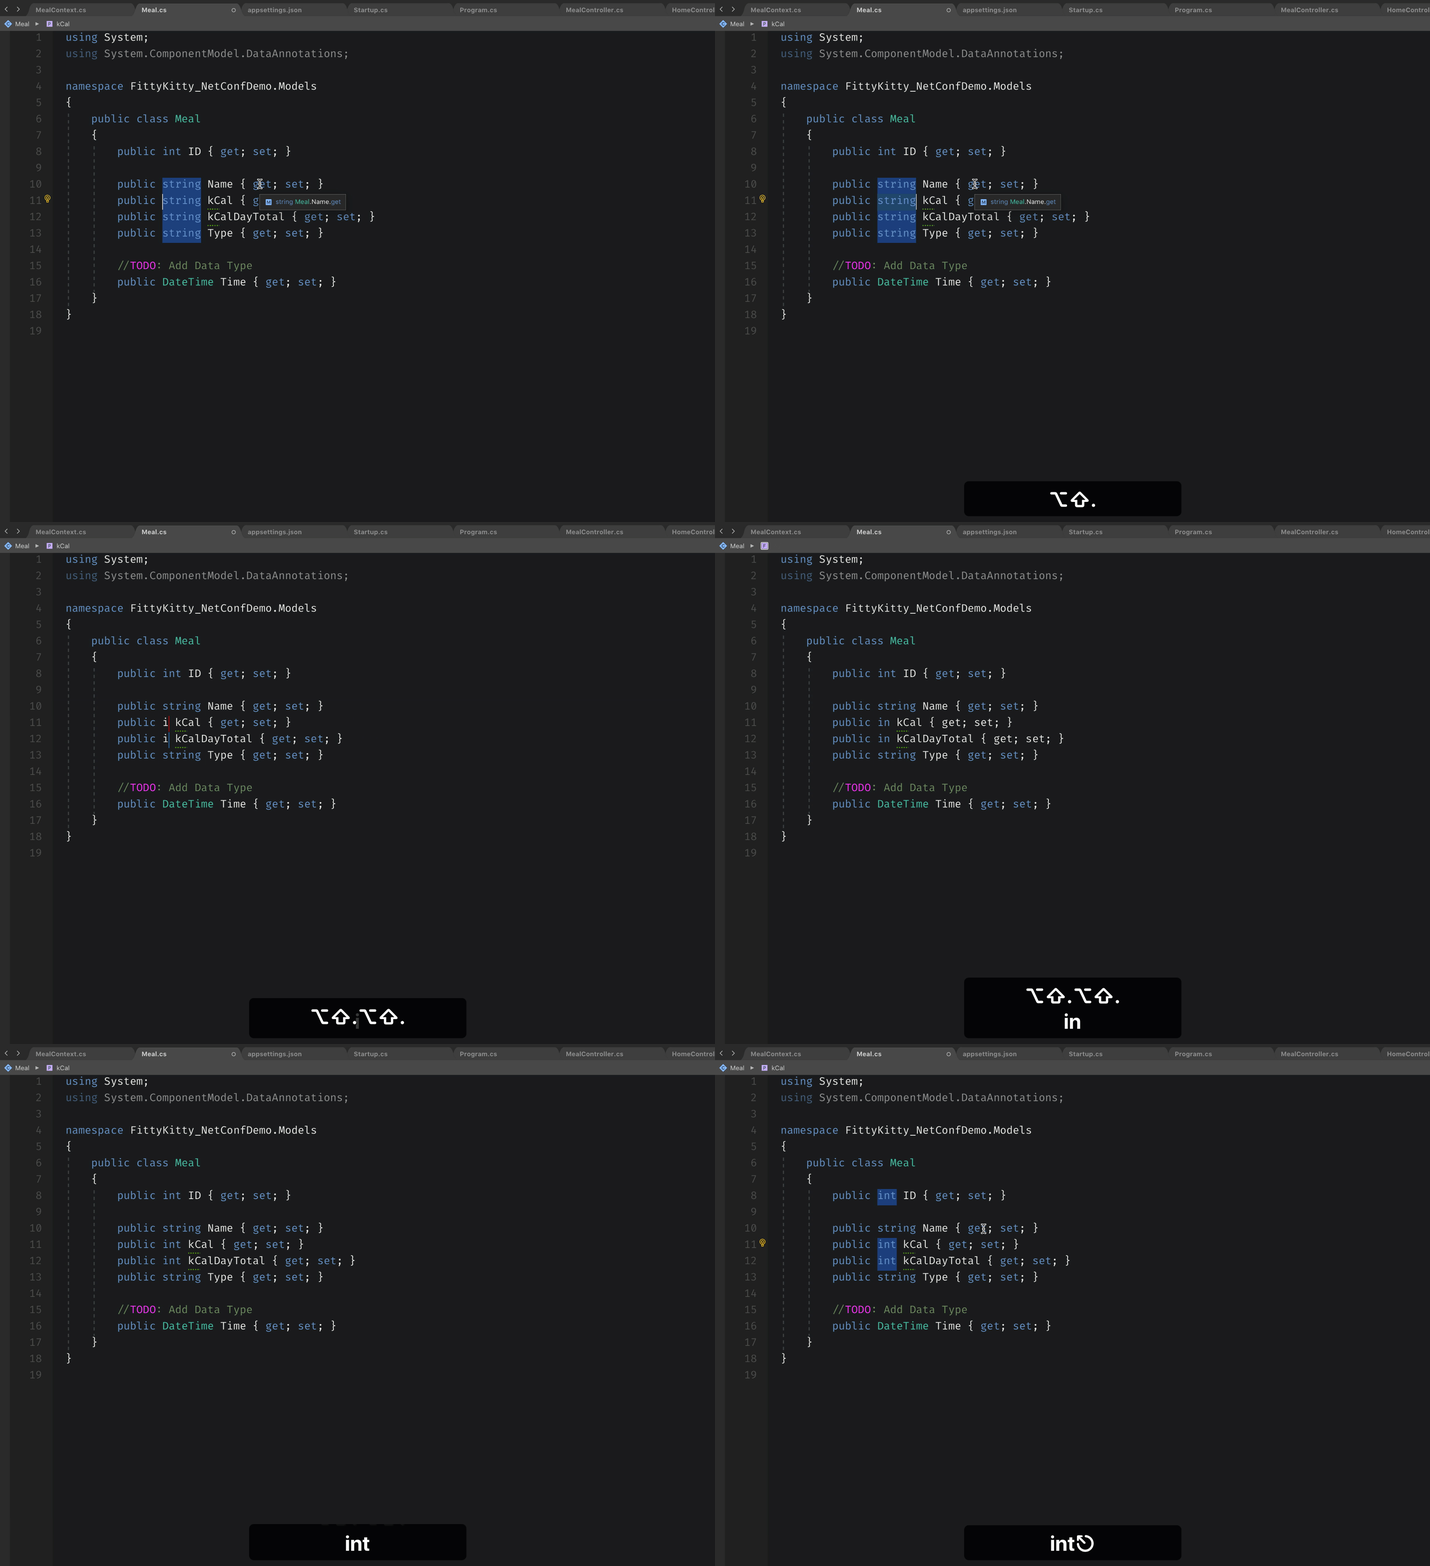
There are two approaches for enabling multi-caret mode. The first is via the keyboard, the other being the mouse. In the below example, I used the keyboard command “option-shift-.” to insert the next matching caret. This will add a caret at the next line with a matching value each time you press the command. You can also use “option-control-click” to manually place carets with the mouse, or “command-shift-drag” to do a block selection with the mouse.


Image MCE Retina Dark


In multi-caret edit mode, you can edit multiple lines at the same time with the same content. Once you’ve used it, you will find yourself unable to live without it!

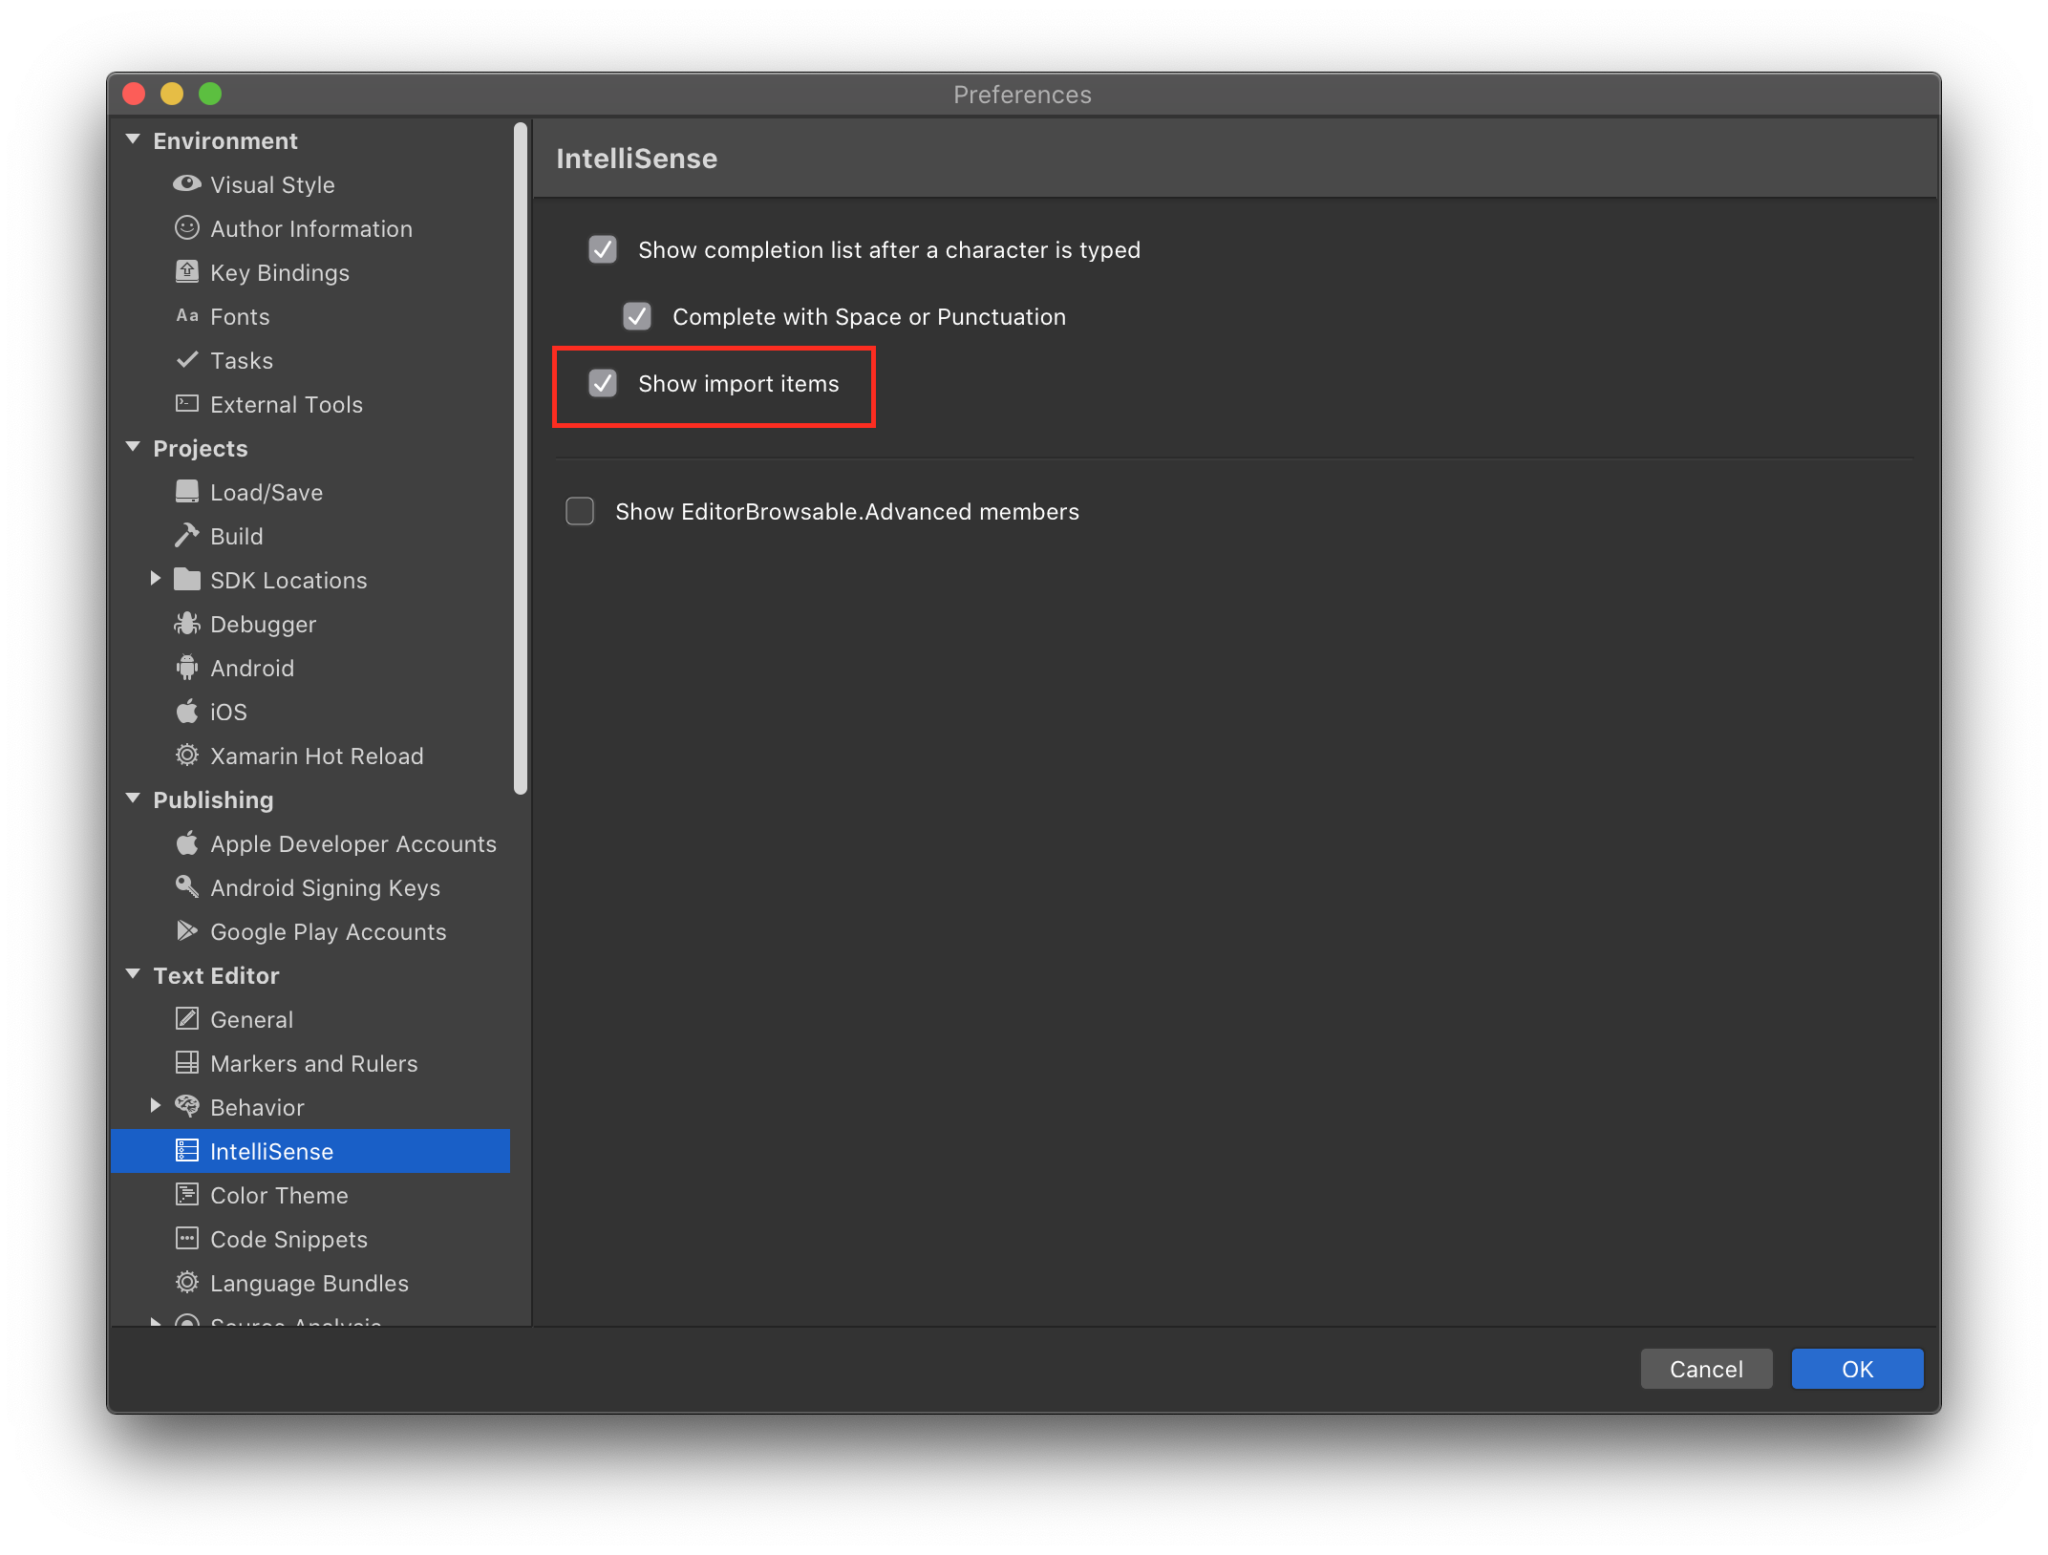
The next editor feature isn’t technically an editor feature, but a feature of IntelliSense: the ability to show completions from namespaces not yet imported and then import them automatically. This is better known as the “Show Import Items” feature, and it is amazing. Start by enabling “Show Import Items” in Visual Studio for Mac via Visual Studio > Preferences > Text Editor > IntelliSense and checking the box corresponding with “Show Import Items”

Image showimport productive dark

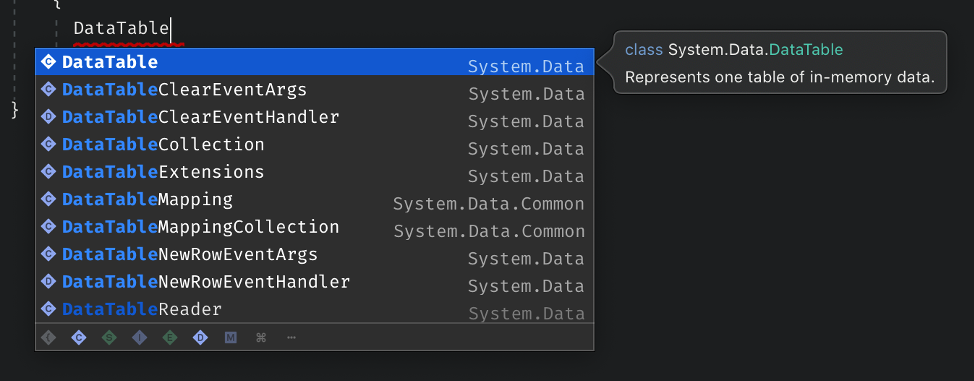
Now, as you type, the IntelliSense list will not only show completions from libraries you’ve already imported, but also from those which are available to import. In the below example, I try to create a DataTable, and IntelliSense proves the completion. IntelliSense also tells me that System.Data needs to be imported. If I complete that suggestion, not only does the completion finish but System.Data is imported as a Using statement in the file header.


Image Picture1

This is another huge time saver that I’ve come to rely on. Not only does it save me having to scroll up, add my using statement, scroll back down and continue where I left off, but it also helps me remember exactly which namespace needs to be imported 😂.


Don’t let NuGets manage you!

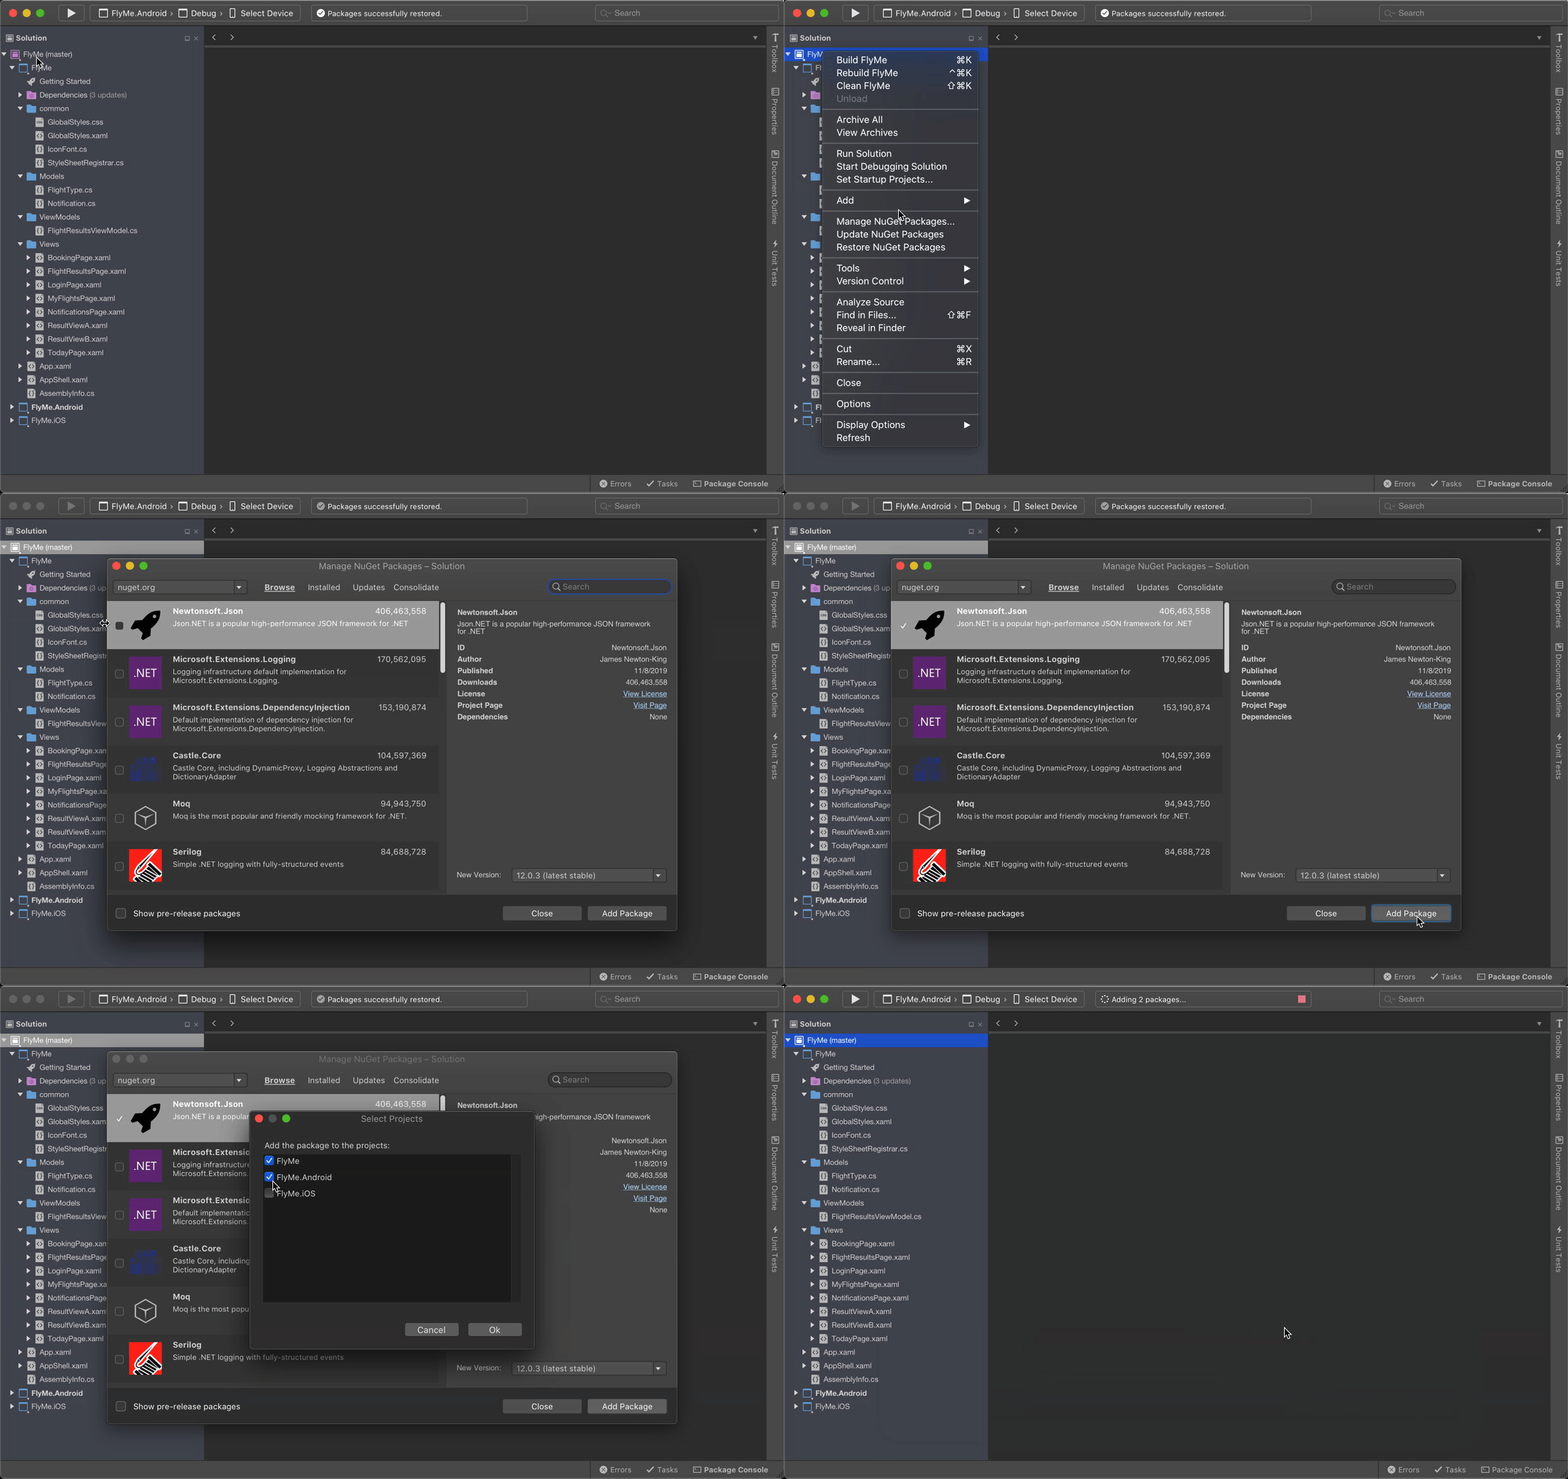
In the past, managing NuGet packages across a solution in Visual Studio for Mac was admittedly a less than seamless experience. You had to manually manage NuGet packages for each project, even if each project used the exact same NuGet package. If you’ve worked within solutions with numerous projects, you know how time consuming that can be, but luckily that reality is no more! With the new NuGet package manager in Visual Studio for Mac, you can quickly manage NuGet packages for the entire solution, from one window. In the example below, I want to add a package to two of my three projects. No big deal.Simply select those projects and away you go!


Image NuGetManage


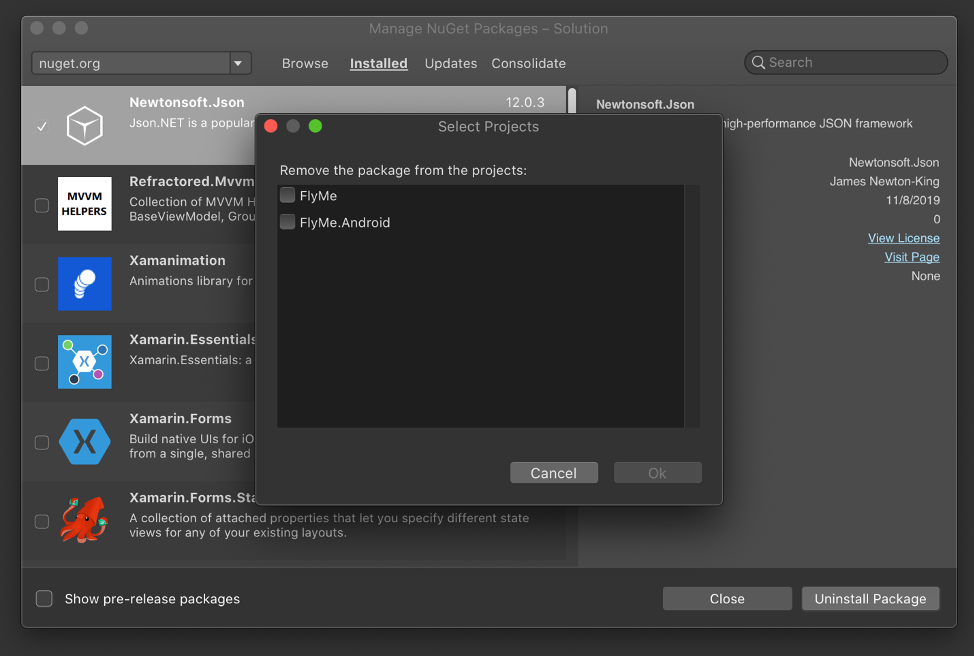
Removing packages is just as easy: all you need to do is click on the “Installed”, find the package you want to remove and click “Uninstall Package” and you will be greeted with a window letting you select which projects you want to remove the package from. Notice that only projects that currently contain the package are listed, as opposed to every project in your solution.


Image Picture2


I really hope that you found this post useful. I love sharing tips that have helped me become more productive and hope they will help you be more productive as well. After-all, at their core, IDEs are productivity tools. If you are interested in testing out the latest preview of Visual Studio for Mac, make sure you’ve downloaded and installed Visual Studio 2019 for Mac, then switch to the Preview channel.

As always, if you have any feedback on this, or any, version of Visual Studio for Mac, we invite you to leave them in the comments below this post or to reach out to us on Twitter at @VisualStudioMac. If you run into issues while using Visual Studio for Mac, you can use Report a Problem to notify the team. In addition to product issues, we also welcome your feature suggestions on the Visual Studio Developer Community website.

The post Visual Studio for Mac: Become a Productivity Pro appeared first on Visual Studio Blog.

Extending the Reach of Windows ML and DirectML

$
0
0

Since the initial release, Windows ML has powered numerous Machine Learning (ML) experiences on Windows. Delivering reliable, high-performance results across the breadth of Windows hardware, Windows ML is designed to make ML deployment easier, allowing developers to focus on creating innovative applications.

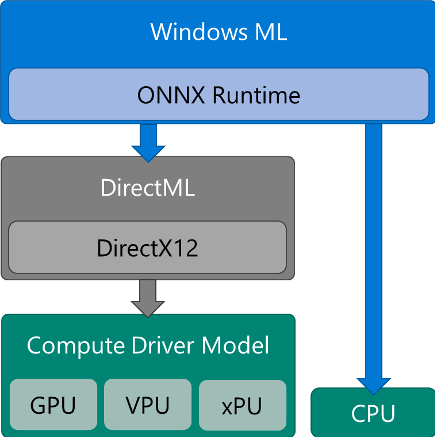
Windows ML is built upon ONNX Runtime to provide a simple, model-based, WinRT API optimized for Windows developers. This API enables you to take your ONNX model and seamlessly integrate it into your application to power ML experiences. Layered below the ONNX Runtime is the DirectML API for cross-vendor hardware acceleration. DirectML is part of the DirectX family and provides full control for real-time, performance-critical scenarios.

This end-to-end stack provides developers with the ability to run inferences on any Windows device, regardless of the machine’s hardware configuration, all from a single and compatible codebase.

Graphic showing The Windows AI Platform stack.

Figure 1 – The Windows AI Platform stack

Windows ML is used in a variety of real-world application scenarios. The Windows Photos app uses it to help organize your photo collection for an easier and richer browsing experience. The Windows Ink stack uses Windows ML to analyze your handwriting, converting ink strokes into text, shapes, lists and more. Adobe Premier Pro offers a feature that will take your video and crop it to the aspect ratio of your choice, all while preserving the important action in each frame.

With the next release of Windows 10, we are continuing to build on this momentum and are further expanding to support more exciting and unique experiences. The interest and engagement from the community provided valuable feedback that allowed us to focus on what our customers need most. Today, we are pleased to share with you some of that important feedback and how we are continually working to build from it.

Bringing Windows ML and Direct ML ton More Places 

Today, Windows ML is fully supported as a built-in Windows component on Windows 10 version 1809 (October 2018 Update) and newer. Developers can use the corresponding Windows Software Development Kit (SDK) and immediately begin leveraging Windows ML in their application. For developers that want to continue using this built-in version, we will continue to update and innovate Windows ML and provide you with the feature set and performance you need with each new Windows release.

A common piece of feedback we’ve heard is that developers today want the ability to ship products and applications that have feature parity to all of their customers. In other words, developers want to leverage Windows ML on applications targeting older versions of Windows and not just the most recent. To support this, we are going to make Windows ML available as a stand-alone package that can be shipped with your application. This redistributable path enables Windows ML support for CPU inference on Windows versions 8.1 and newer, and GPU hardware-acceleration on Windows 10 1709 and newer.

Going forward, with each new update of Windows ML, there will be a corresponding redist package, with matching new features and optimizations, available on GitHub. Developers will find that with either option they choose, they will receive an official Windows offering that is extensively tested, guaranteeing reliability and high performance.

Windows ML, ONNX Runtime, and Direct ML

In addition to bringing Windows ML support to more versions of Windows, we are also unifying our approach with Windows ML, ONNX Runtime, and DirectML. At the core of this stack, ONNX Runtime is designed to be a cross-platform inference engine. With Windows ML and DirectML, we build around this runtime to offer a rich set of features and hardware scaling, designed for Windows and the diverse hardware ecosystem.

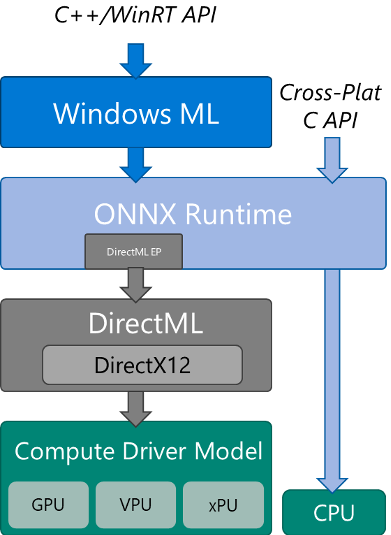
We understand the complexities developers face in building applications that offer a great customer experience, while also reaching their wide customer base. In order to provide developers with the right flexibility, we are bringing the Windows ML API and a DirectML execution provider to the ONNX Runtime GitHub project. Developers can now choose the API set that works best for their application scenarios and still benefit from DirectML’s high-performance and consistent hardware acceleration across the breadth of devices supported in the Windows ecosystem.

In GitHub today, the Windows ML and DirectML preview is available as source, with instructions and samples on how to build it, as well as a prebuilt NuGet package for CPU deployments.

Are you a Windows app developer that needs a friendly WinRT API that will integrate easily with your other application code and is optimized for Windows devices? Windows ML is a perfect choice for that. Do you need to build an application with a single code-path that can work across other non-Windows devices? The ONNX Runtime cross-platform C API can provide that.

Graphic depicting newly layered Windows AI and ONNX Runtime.

Figure 2 – newly layered Windows AI and ONNX Runtime

Developers already using the ONNX Runtime C-API and who want to check out the DirectML EP (Preview) can follow these steps.

Experience it for yourself

We are already making great progress on these new features.

You can get access to the preview of Windows ML and Direct ML for the ONNX Runtime here. We invite you to join us on GitHub and provide feedback at AskWindowsML@microsoft.com

The official Windows ML redistributable package will be available on NuGet in May 2020.

As always, we greatly appreciate all the support from the developer community. We’ll continue to share updates as we make more progress with these upcoming features.

The post Extending the Reach of Windows ML and DirectML appeared first on Windows Developer Blog.

2 weeks in: what we’ve learned about remote work

Viewing all 5971 articles
Browse latest View live