Teams meetings is now integrated into popular learning management systems.
The post Host your virtual class with Microsoft Teams appeared first on Microsoft 365 Blog.
Teams meetings is now integrated into popular learning management systems.
The post Host your virtual class with Microsoft Teams appeared first on Microsoft 365 Blog.
As the world comes together to combat COVID-19, and remote work becomes a critical capability for many companies, customers have asked us how to best maintain the security posture of their cloud assets while enabling more remote workers to access them.
Misconfiguration of cloud security controls has been at the root of several recent data breaches, so it’s extremely important to continue monitoring your security posture as usage of cloud assets increases.
To help you prioritize the actions that you need to take, we are listing three common scenarios for remote workers and how to leverage Azure Security Center security controls to prioritize relevant recommendations for these scenarios:
1. As more users need to access resources remotely, you need to ensure that Multi-Factor Authentication (MFA) is enabled to enhance their identity protection.
2. Some users might need remote access via RDP or SSH to servers that are in your Azure infrastructure.
3. Some of the workloads (servers, containers, databases) that will be accessed remotely by users might be missing critical security updates.
Security posture management is an ongoing process. Review your secure score to understand your progress towards a fully compliant environment.
Users of Azure are likely just a portion of your user base. Below is additional guidance on enabling and securing remote work for the rest of your organization:
Whether you're a new student, thriving startup, or the largest enterprise, you have financial constraints and you need to know what you're spending, where, and how to plan for the future. Nobody wants a surprise when it comes to the bill, and this is where Azure Cost Management + Billing comes in.
We're always looking for ways to learn more about your challenges and how Azure Cost Management + Billing can help you better understand where you're accruing costs in the cloud, identify and prevent bad spending patterns, and optimize costs to empower you to do more with less. Here are a few of the latest improvements and updates based on your feedback:
Let's dig into the details.
Managing and staying up to date on your Azure invoices just got a whole lot better with a few key improvements for Pay-As-You-Go (PAYG) subscriptions:
These are all based on your feedback, so please keep it coming. Our goal is to make it easier than ever to manage and pay your invoices. What would you like to see next?
As you know, we're always looking for ways to learn more about your needs and expectations. This month, we'd like to learn about the most important reporting tasks and goals you have when managing and optimizing costs. We'll use your inputs from this survey to help prioritize reporting improvements within Cost Management + Billing experiences over the coming months. The 12-question survey should take about 10 minutes.
With Cost Management Labs, you get a sneak peek at what's coming in Azure Cost Management and can engage directly with us to share feedback and help us better understand how you use the service, so we can deliver more tuned and optimized experiences. Here are a few features you can see in Cost Management Labs:
Of course, that's not all. Every change in Azure Cost Management is available in Cost Management Labs a week before it's in the full Azure portal. We're eager to hear your thoughts and understand what you'd like to see next. What are you waiting for? Try Cost Management Labs today.
Lots of cost optimization improvements over the past month. Here are a few you might be interested in:
Many organizations use the full Azure usage and charges to understand what's being used, identify what charges should be internally billed to which teams, or to look for opportunities to optimize costs with Azure reservations and Azure Hybrid Benefit, just to name a few. If you're doing any analysis or have setup integration based on product details in the usage data, please update your logic for the following services.
The following change will start effective April 1:
Also, remember the key-based Enterprise Agreement (EA) billing APIs have been replaced by new Azure Resource Manager APIs. The key-based APIs will still work through the end of your enrollment, but will no longer be available when you renew and transition into Microsoft Customer Agreement. Please plan your migration to the latest version of the UsageDetails API to ease your transition to Microsoft Customer Agreement at your next renewal.
For those visual learners out there, we have a wealth of new videos this month:
Follow the Azure Cost Management + Billing YouTube channel to stay in the loop with new videos as they're released and let us know what you'd like to see next.
Want a more guided experience? Start with Predict costs and optimize spending for Azure.
Here are a few documentation updates you might be interested in:
Want to keep an eye on all of the documentation updates? Check out the Cost Management + Billing doc change history in the azure-docs repository on GitHub. If you see something missing, select Edit at the top of the document and submit a quick pull request.
These are just a few of the big updates from last month. We're always listening and making constant improvements based on your feedback, so please keep the feedback coming.
Follow @AzureCostMgmt on Twitter and subscribe to the YouTube channel for updates, tips, and tricks. And, as always, share your ideas and vote up others in the Cost Management feedback forum.
Late last year, we’ve announced the general availability of Azure Dedicated Hosts. This blog provides an update regarding the new and recently added capabilities since we introduced Azure Dedicated Hosts in preview.
Azure Dedicated Host provides a single-tenant physical server to run your Azure Virtual Machines for Windows Server and Linux. With Azure Dedicated Host, you can address specific compliance requirements while increasing visibility and control over your underlying infrastructure.
We recently introduced the ability for you to purchase Azure reservations for Dedicated Hosts. You are now able to reduce costs by buying Azure Dedicated Hosts reservations. The reservation discount is applied automatically to the number of running dedicated hosts that match the reservation scope and attributes. You don't need to assign a reservation to a specific dedicated host to get the discounts. You may also delete and create hosts and have the reservation apply to the hosts already deployed at any given time.
The Azure Dedicated Hosts pricing page contains the complete list of Dedicated Hosts SKUs, their CPU information, and various pricing options including Azure reservations discounts.
Azure Dedicated Host SKUs, unlike Azure Virtual Machines, are defined based on the virtual machine (VM) series and hardware generation. With Azure Dedicated Hosts, your reservation will automatically apply to any host SKUs supporting the same VM series. For example, if you acquired a reservation for Dsv3_Type1 dedicated host, you would be able to use it with Dsv3_Type2 dedicated hosts.
The maintenance control feature for Azure Dedicated Hosts gives control over platform maintenance operations to customers with highly sensitive workloads. Using this feature, customers can manage platform updates that don’t require a reboot. Maintenance control batch updates into one update package and gives you the option to delay platform updates and apply them within a 35-day rolling window.
You can take advantage of this new capability, by creating a maintenance configuration object and then apply it to your dedicated hosts. Then, you can check for pending updates and apply them at the host level. All VMs assigned to the host will be impacted at the same time.
Prior to applying the maintenance, you can check the impact type and expected duration of the impact

To learn more, refer to our documentation Control updates with Maintenance Control.
Since the preview was announced, we have added support for additional VM series and host types. We’re currently supporting both Intel and AMD SKUs with a variety of VM series: Dsv3, Esv3, Dasv4, Easv4, Fsv2, Lsv2, and Msv2. This will enable our customers to run a broad range of workloads on Dedicated Hosts including and not limited to general purpose or memory, storage, and compute intensive applications.
Visit the Azure Dedicated Host pricing page to learn more about these new SKUs and the options available to you.
Azure Resource Health alerts can notify you in near real-time when your dedicated hosts experience a change with respect to their health status. Creating Resource Health alerts programmatically let users create and customize alerts in bulk. You can create an action group and specify the steps to take once an alert is triggered. Follow the steps to create activity log alerts using Azure Resource Manager Template and remember to modify the template to include resources of type dedicated hosts.
Start by visiting the Azure Dedicated Host page, read more in the documentation page, or watch a video introduction to Azure Dedicated Host.
Deploy Dedicated Host using Azure CLI, the Azure portal, Azure REST API, or Azure PowerShell.
Azure Government Secret recently achieved Provisional Authorization (PA) at Department of Defense Impact Level 6 (IL6) and Intelligence Community Directive (ICD) 503 with facilities at ICD 705. We’re also announcing a third region to enable even higher availability for national security missions to stay ahead of their unique threats.
Built exclusively for the needs of US government and operated by cleared US citizens, Azure Government Secret delivers dedicated regions to maintain the security and integrity of classified Secret workloads while enabling reliable access to critical data. The first cloud natively connected to classified networks; Azure Government Secret enables customers to leverage options for private, resilient, high-bandwidth connectivity.
Azure Government Secret is designed for the unique requirements of critical national security workloads that cannot be served out of a single geographic location. To provide the geodiversity required, Azure Government Secret delivers across three dedicated regions for US Federal Civilian, Department of Defense (DoD), Intelligence Community (IC), and US government partners working within Secret enclaves. These dedicated Azure regions are located over 500 miles apart to enable applications to stay running in the face of a disaster without a break in continuity of operations.
In addition, these regions provide greater choice when working across multiple locations and delivering cloud-to-edge scenarios. With comprehensive cloud services Azure Government Secret enables faster innovation for the mission from cloud to tactical edge meeting the critical availability needs of the warfighter.
Designed and built for Infrastructure as a Service (IaaS), Platform as a Service (PaaS), Software as a Service (SaaS) and Marketplace solutions, Azure Government Secret provides a broad range of commercial innovation for classified workloads. Some of the services include: identity, analytics, security, and high performance computing to support advanced artificial intelligence (AI) and machine learning.
Operated by cleared US citizens, these new regions are part of Azure Government, delivering a familiar, consistent experience and alignment with existing resellers and programs. Eligible customers can also leverage cleared Microsoft cloud support for their workloads.
With Azure Government Secret, customers can connect natively to classified networks or leverage options for private, resilient, high-bandwidth connectivity using ExpressRoute and ExpressRoute Direct:
In addition to serving mission customers at DoD IL6 and ICD 503, we continue to invest in rapidly delivering new Azure Government capabilities to support mission needs across all data classifications for any US government customer. In the last six months we’ve continued our drive toward commercial parity, adding hundreds of features and launching 40+ new services and 101 total services in FedRAMP High, with more to come across Azure commercial, Azure Government and Azure Government Secret.
These continued investments enable customers across the full spectrum of government, including departments in every state, all the federal cabinet agencies, and each military branch, modernize their IT to better achieve their missions.
To learn more about Azure Government Secret contact us or visit Azure Government for national security.
Azure Container Registry announces preview support for Azure Private Link, a means to limit network traffic of resources within the Azure network.
With Private Link, the registry endpoints are assigned private IP addresses, routing traffic within a customer-defined virtual network. Private network support has been one of the top customer asks, allowing customers to benefit from the Azure management of their registry while benefiting from tightly controlled network ingress and egress.

Private Links are available across a wide range of Azure resources with more coming soon, allowing a wide range of container workloads with the security of a private virtual network.
Private Link provides private endpoints to be available through private IPs. In the above case, the contoso.azurecr.io registry has a private IP of 10.0.0.6 which is only available to resources in contoso-aks-eastus-vnet. This allows the resources in this VNet to securely communicate. The other resources may be restricted to resources only within the VNet.
At the same time, the public endpoint for the contoso.azurecr.io registry may still be public for the development team. In a coming release, Azure Container Registry (ACR) Private Link will support disabling the public endpoint, limiting access to only private endpoints, configured under private link.
Customers looking to establish a private link between two Azure tenants, where an Azure container registry is in one tenant and while container hosts are in other tenants can use the Private Link Manual Approval workflow. This workflow enables many Azure services, including Azure Machine Learning, to securely interact with your registry. Development teams working in different subscriptions and tenants may also utilize private link manual approval to grant access.
ACR Service Endpoint preview support was released in March 2019. Service Endpoints provide access from Azure VNets through IP tagging. All traffic to the service endpoint is limited to the Azure backbone network through routing. The public endpoint still exists; however, firewall rules limit public access. Private Link capabilities take this a step further by providing a private endpoint (IP address). As Private Links are more secure and a superset of capabilities of Service Endpoints, Private link support will replace Azure Container Registry Service Endpoint support. While both Service Endpoints and Private Link are currently in preview, we plan to release Private Link capabilities as generally available shortly. We encourage Service Endpoint customers to evaluate ACR Private Link capabilities.
During the preview period, private link support is limited to registries that are not geo-replicated. The feature will move to general availability as we assess feedback and geo-replication support is complete.
We’ve heard clearly that customers requiring private networks also require production support. As such, all support requests will be honored through standard support channels.
Azure Container Registry Private Link support is available across 28 regions through the premium tier.
Additional links:
We're announcing the general availability of incremental snapshots of Azure Managed Disks. Incremental snapshots are a cost-effective, point-in-time backup of managed disks. Unlike current snapshots, which are billed for the full size, incremental snapshots are billed for the delta changes to disks since the last snapshot and are always stored on the most cost-effective storage, Standard HDD storage irrespective of the storage type of the parent disks. For additional reliability, Managed Disks are also stored on Zone Redundant Storage (ZRS) by default in regions that support ZRS.
Incremental snapshots provide differential capability, enabling customers and independent solution vendors (ISVs) to build backup and disaster recovery solutions for Managed Disks. It allows you to get the changes between two snapshots of the same disk, thus copying only changed data between two snapshots across regions, reducing time and cost for backup and disaster recovery. Incremental snapshots are accessible instantaneously; you can read the underlying data of incremental snapshots or restore disks from them as soon as they are created. Azure Managed Disk inherit all the compelling capabilities of current snapshots and have a lifetime independent from their parent managed disks and independent of each other.
Let’s look at a few examples to understand how the incremental snapshots help you reduce cost.
If you were using a disk with 100 GiB already occupied and added 20 GiB of data to the disk, you took the first incremental snapshot before 20 GiB of data was added to the disk, making the first copy occupy 100 GiB of data. Then 20 GiB of data was added on the disk before you created the second incremental snapshot. Now with incremental snapshots, the second snapshot occupies only 20 GiB and you’re billed for only 20 GiB compared to the current full snapshots that would have occupied 120 GiB and billed for 120 GiB of data, reducing your cost.
The second incremental snapshot references 100 GiB of data from the first snapshot. When you restore the disk from the second incremental snapshot, the system can restore 120 GiB of data by copying 100 GiB of data from the first snapshot and 20 GiB of data from the second snapshot.
 Let's now understand what happens when 5 GiB of data was modified on the disk before you took the third incremental snapshot. The third snapshot then occupies only 5 GiB of data, references 95 GiB of data from the first snapshot, and references 20 GiB of data from the second snapshot.
Now, if you deleted the first incremental snapshot the second and the third snapshots continue to function normally as incremental snapshots are independent of each other. The system merges the data occupied by the first snapshot with the second snapshot under the hood to ensure that the second and the third snapshots are not impacted due to the deletion of the first snapshot. The second snapshot now occupies 120 GiB of data.  Since we launched the preview for incremental snapshot in September 2019, our ISVs have used this capability on a wide range of workloads to reduce the cost and time for backup and disaster recovery.
Below are some quotes from partners in our preview program:
“Zerto has been helping enterprise customers who leverage Microsoft Azure become IT Resilient for years. Extending Azure Managed Disks with the incremental snapshots API has enabled Zerto to improve upon industry-best RTOs and RPOs in Azure. The powerful capabilities of Azure Managed Disks enable Zerto to meet the scale and performance requirements of a modern enterprise. With Zerto and Microsoft’s continued collaboration and integration, we’ll continue to pave the way for IT Resilience in the public cloud.” - Michael Khusid, Director of Product Management, Zerto, Inc.
“Combining Rubrik Azure data protection with the latest Microsoft API delivering incremental snapshots, we reduce the time and cost for backup and recovery, and help our joint customers achieve 18x lower costs, high storage efficiency, reduced network traffic, and hourly RPOs. Together, Rubrik and Microsoft enable our enterprise customers to accelerate their cloud journey while unlocking productivity and better cloud economics.” – Shay Mowlem, Senior Vice President of Product & Strategy, Rubrik
“With incremental snapshots of Azure managed disks, Dell EMC PowerProtect Cloud Snapshot Manager (CSM) customers will be able to reduce their backup times and storage costs significantly. Also, they’ll be able to achieve much shorter recovery time objectives with instant access to their data from snapshots. Designed for any-size cloud infrastructure, CSM provides global visibility and control to gain insights into data protection activities across Azure subscriptions, making CSM a great solution for protecting customer workloads in public cloud environments.” – Laura Dubois, vice president, product management, Dell Technologies Data Protection
You can now create incremental snapshots in all regions, including sovereign regions.
Incremental snapshots are charged per GiB of the storage occupied by the delta changes since the last snapshot. For example, if you're using a managed disk with a provisioned size of 128 GiB, with 100 GiB used, the first incremental snapshot is billed only for the used size of 100 GiB. 20 GiB of data is added on the disk before you create the second snapshot. Now, the second incremental snapshot is billed for only 20 GiB.
Incremental snapshots are always stored on standard storage irrespective of the storage type of parent managed disks and charged as per the pricing of standard storage. For example, incremental snapshots of a Premium SSD Managed Disk are stored on standard storage. They are stored on ZRS by default in regions that support ZRS. Otherwise, they are stored on locally redundant storage (LRS). The per GB pricing of both the LRS and ZRS options is the same.
Incremental snapshots cannot be stored on premium storage. If you are using current snapshots on premium storage to scale up virtual machine deployments, we recommend you use custom images on standard storage in Shared Image Gallery. This will help you to achieve higher scale with lower cost.
You can visit the Managed Disk Pricing for more details about the snapshot pricing.
If you use Office 365, you have likely seen the Microsoft PowerPoint Designer appear to offer helpful ideas when you insert a picture into a PowerPoint slide. You may also have found it under the Home tab in the ribbon. In either case, Designer provides users with redesigned slides to maximize their engagement and visual appeal. These designs include different ways to represent your text as diagrams, layouts to make your images pop, and now it can even surface relevant icons and images to bring your slides to the next level. Ultimately, it saves users time while enhancing their slides to create stunning, memorable, and effective presentations.
Designer uses artificial intelligence (AI) capabilities in Office 365 to enable users to be more productive and unlock greater value from PowerPoint. It applies AI technologies and machine learning based techniques to suggest high-quality professional slide designs. Content on slides such as images, text, and tables are analyzed by Designer and formatted based on professionally designed templates for enhanced effectiveness and visual appeal.
The data science team, working to grow and improve Designer, is comprised of five data scientists with diverse backgrounds in applied machine learning and software engineering. They strive to continue pushing barriers in the AI space, delivering tools that make everyone’s presentation designs more impactful and effortless. They’ve shared some of the efforts behind PowerPoint Designer, just so we can get a peek under the hood of this powerful capability.
Designer has been processing user requests in the production environment for several years and uses machine learning models for problems such as image categorization, content recommendation, text analysis, slide structure analysis, suggestion ranking, and more. Since its launch, Designer users have kept 1.7 billion Designer slides in their presentations. This means the team needs a platform to run their models at a large scale. Plus, the Designer team is regularly retraining models in production and driving model experimentation to provide optimized content recommendations.
Recently, the data analysis and machine learning team within PowerPoint started leveraging Azure Machine Learning and its robust MLOps capabilities to build models faster and at scale, replacing local development. Moving toward content suggestions, like background images, videos, and more, requires a highly performant platform, further necessitating the shift towards Azure Machine Learning.
The team uses Azure Machine Learning and its MLOps capabilities to create automated pipelines that can be iterated on, without disrupting the user experience. The pipeline starts at the Azure Data Lake, where the data is stored. From there, the team gathers data and preprocesses it—merging data from different sources and transforming raw data into a format that models can understand. Utilizing the Azure Machine Learning distributed training, they retrain their current models weekly or monthly. Distributed training allows the team to train models in parallel across multiple virtual machines (VMs) and GPUs (graphic processing units). This saves the team considerable time to ensure the model training doesn’t disrupt the user experience for the data science team, so they can focus on other objectives like experimentation.
The team does experimentation in parallel as well—trying variants, or hyperparameters, and comparing results. The final model is then put back into Azure Data Lake and downloaded to Azure Machine Learning.
The following diagram shows the conceptualized, high-level architecture of data being used from local caches in Azure Data Lake to develop machine learning models on the Azure Machine Learning. These models are then integrated into the micro-service architecture of the Designer backend service that presents PowerPoint users with intelligent slide suggestions.
The PowerPoint team decided to move its workloads over to the Azure Machine Learning based on the following capabilities:
Follow the Azure blog to be the first to know when features leveraging new models that recommend more types of content, such as image classification and content recommendations, are released.
Azure Machine Learning | Azure Data Lake | Azure Machine Learning pipelines
Learn more about Azure Machine Learning.
Get started with a free trial of Azure Machine Learning.
If someone had told me three months ago, that very soon I would be required to stay in my house and only leave for necessities, I wouldn’t have believed it. But many of you, like me, are facing this as a new reality. This means increased work as we juggle working from home with our families, or increased spare time on our hands that we weren’t expecting.
 My cat Nika, attempting to cut off my access to the outside world
COVID-19 continues to impact the lives of people around the world. The Visual Studio Subscriptions team wants to do everything we can to support you, wherever you’re at during this tough time. We’ve got some suggestions for staying productive at home, and ways that you can take advantage of benefits in your Visual Studio subscription to maximize this time of great uncertainty.
Almost everything we’re sharing can be accessed right from your subscription, so just sign into the subscriptions portal to get started.
Many subscriptions include a monthly Azure credit of up to $150 that you can use to explore and try Azure services, including: Visual Studio Online, Windows Virtual Desktop, and Azure Functions to name a few. You can also use your credit to create your first bot or leverage speech service to add speech recognition to an app. Check out some other usage scenarios and get started by activating your credit in the subscriptions portal.
When you reach the monthly cap for your credits, your Azure services will stop until your next monthly credits are added, no additional cost.
In some regions, you may see less options available than usual – in the event of capacity constraints, Azure prioritizes services for first responders, health and emergency management services, critical government infrastructure organizational use, and ensuring remote workers stay up and running. Read more about Azure’s commitment to customers and Microsoft cloud services continuity.
Use your downtime to build new skills—Pluralsight allows you to learn anytime, anywhere, even without an internet connection. If you’re tired of sitting in front of your computer all day, you can sit on your couch with the cat and use apps to stream over 7000 courses to your TV, learning about topics such as: cloud, mobile, security, IT and data. Visual Studio subscribers are eligible for up to six months of free access to Pluralsight courses. Activate your benefit by clicking on the Pluralsight tile in the subscriber portal. Check out this remote work guide from Pluralsight for some great tips and tools to make the most of working from home.
Enhance your skills with expert-led, online video tutorials from industry experts through LinkedIn Learning. You can sign up for the free trial or activate the LinkedIn Learning benefit included in selected Visual Studio subscriptions. Check out the 16 LinkedIn Learning courses available for free, including tips on how to: stay productive, build relationships when you’re not face-to-face, use virtual meeting tools, and balance family and work dynamics in a healthy way.
Increase your data science skills from the comfort of your browser with DataCamp to learn all the data science skills you need from the comfort of your browser. You choose when and what you learn, with no software to install and no special hardware requirements.
If you have a Visual Studio subscription and need to develop at home, you can download it to your home computer and use Visual Studio the same way you do in the office. Make sure your company’s policy allows for this, and don’t forget—only users with an appropriate Visual Studio subscription can use the software.
If you don’t have access to a development environment at home, or don’t have the hardware to support Virtual Machines, cloud services can help. Visual Studio Online is a service that creates cloud-hosted dev environments from any hosted Git repo. You can connect to these environments directly from Visual Studio Code (Visual Studio is in private preview), which provides an experience that looks and feels local. You can also use the built-in browser-based editor, which works on any device. For tasks that require access to specialized hardware, devs can link their existing machine to Visual Studio Online. You can also use your monthly Azure individual dev/test credit for this service.
Working remotely can be a challenge if you participate in peer reviews or pair programming, where you would normally sit side by side and learn from each other. Our developers use Visual Studio Live Share for joint debugging sessions and peer learning. Live Share allows you to work together and independently, and feels a lot like in-person collaboration.
All of us at Microsoft use Teams daily for chat, meetings, calls, and collaboration. Now that we find ourselves working remotely, every meeting is now a Teams meeting. Our team has even started a coffee chat each morning, where those water cooler conversations happen online. I’ve seen online lunches and happy hour meet-ups too!
Teams is part of Office 365. If your organization is licensed for Office 365, you already have it. But Microsoft wants to make sure everyone has access to it during this time. Read this blog post for more on how to get started with Teams.

 Part of the Visual Studio Subscriptions team enjoying a casual afternoon coffee chat
Check out some of these other resources to help you work remotely.
If you don’t have a paid Visual Studio subscription, or have a subscription that doesn’t include all of these benefits, try the free resources in Visual Studio Dev Essentials. You can check out limited offers for Pluralsight, SyncFusion, and a free Azure trial account.
If you’re an active Visual Studio subscriber, edit your profile to opt into the Visual Studio Subscriptions newsletter, which serves a monthly dose of developer resources specific to subscribers.
For more information about eligibility and how to activate your benefits, check out the subscriptions docs.
You no longer need to be concerned with the constraints of physical hardware or your location. Your organization can issue laptops with a Windows Virtual Desktop solution that allows you to remote into your dev environment.
Master core concepts at your speed and on your schedule for free. Whether you’ve got 15 minutes or an hour, you can develop practical skills through interactive modules and paths.
We hope these suggestions give you some ideas about ways to stay productive while working from home. Who knew we’d have an opportunity to brush up on skills and do all the extra things we’ve always wanted to do? Whether this time is brief, or lasts for a while, know that all of us at Microsoft want to help support you. We’re in this together as a close community, and yet also across the globe. We can’t wait to see how we all emerge from this time—hopefully for the better!
Wash your hands, don’t touch your face, and be good to one another. Until next time,
Caity & the Visual Studio Subscriptions team
The post Visual Studio Subscriptions resources for remote learning and productivity appeared first on Visual Studio Blog.
A new preview update of Blazor WebAssembly is now available! Here’s what’s new in this release:
To get started with Blazor WebAssembly 3.2.0 Preview 3 install the latest .NET Core 3.1 SDK.
NOTE: Version 3.1.201 or later of the .NET Core SDK is required to use this Blazor WebAssembly release! Make sure you have the correct .NET Core SDK version by running
dotnet --versionfrom a command prompt.
Once you have the appropriate .NET Core SDK installed, run the following command to install the updated Blazor WebAssembly template:
dotnet new -i Microsoft.AspNetCore.Components.WebAssembly.Templates::3.2.0-preview3.20168.3
If you’re on Windows using Visual Studio, we recommend installing the latest preview of Visual Studio 2019 16.6. Installing Visual Studio 2019 16.6 Preview 2 or later will also install an updated version of the .NET Core 3.1 SDK that includes the Blazor WebAssembly template, so you don’t need to separately install it.
That’s it! You can find additional docs and samples on https://blazor.net.
To upgrade an existing Blazor WebAssembly app from 3.2.0 Preview 2 to 3.2.0 Preview 3:
You’re all set – easy peasy!
You can now debug Blazor WebAssembly apps directly from Visual Studio and Visual Studio Code. You can set breakpoints, inspect locals, and step through your code. You can also simultaneously debug your Blazor WebAssembly app and any .NET code running on the server. Using the browser dev tools to debug your Blazor WebAssembly apps is also still supported.
To enable debugging in an existing Blazor WebAssembly app, update launchSettings.json in the startup project of your app to include the following inspectUri property in each launch profile:
"inspectUri": "{wsProtocol}://{url.hostname}:{url.port}/_framework/debug/ws-proxy?browser={browserInspectUri}"
This property enables the IDE to detect that this is a Blazor WebAssembly app and instructs the script debugging infrastructure to connect to the browser through Blazor’s debugging proxy.
Once updated, your launchSettings.json file should look something like this:
{
    "iisSettings": {
      "windowsAuthentication": false,
      "anonymousAuthentication": true,
      "iisExpress": {
        "applicationUrl": "http://localhost:50454",
        "sslPort": 44399
      }
    },
    "profiles": {
      "IIS Express": {
        "commandName": "IISExpress",
        "launchBrowser": true,
        "inspectUri": "{wsProtocol}://{url.hostname}:{url.port}/_framework/debug/ws-proxy?browser={browserInspectUri}",
        "environmentVariables": {
          "ASPNETCORE_ENVIRONMENT": "Development"
        }
      },
      "BlazorApp1.Server": {
        "commandName": "Project",
        "launchBrowser": true,
        "inspectUri": "{wsProtocol}://{url.hostname}:{url.port}/_framework/debug/ws-proxy?browser={browserInspectUri}",
        "applicationUrl": "https://localhost:5001;http://localhost:5000",
        "environmentVariables": {
          "ASPNETCORE_ENVIRONMENT": "Development"
        }
      }
    }
  }
To debug a Blazor WebAssembly app in Visual Studio:
IncrementCount method.Browser to the Counter tab and click the button to hit the breakpoint:
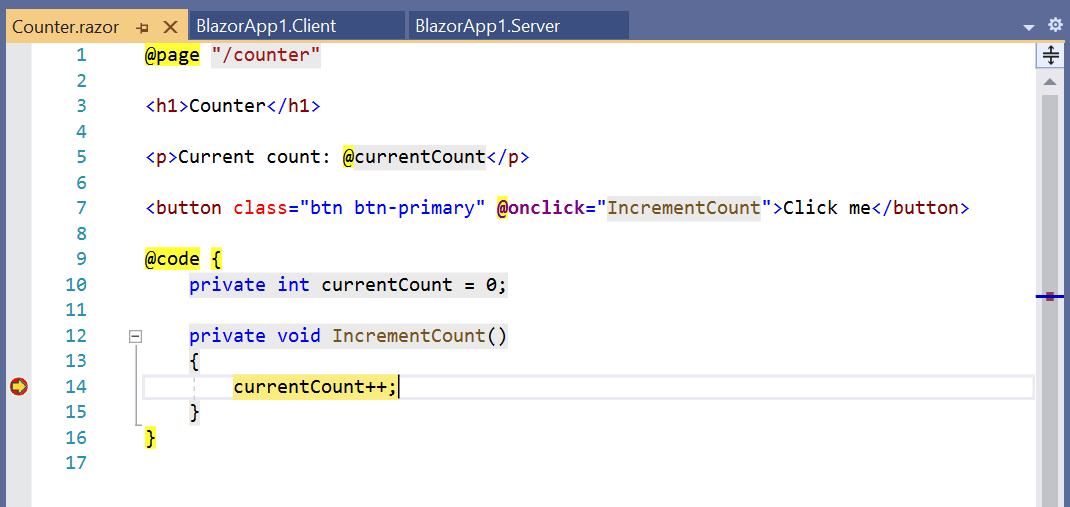
Check out the value of the currentCount field in the locals window:

Hit F5 to continue execution.
While debugging your Blazor WebAssembly app you can also debug your server code:
OnInitializedAsync.WeatherForecastController in the Get action method.Browser to the Fetch Data tab to hit the first breakpoint in the FetchData component just before it issues an HTTP request to the server:

Hit F5 to continue execution and then hit the breakpoint on the server in the WeatherForecastController:
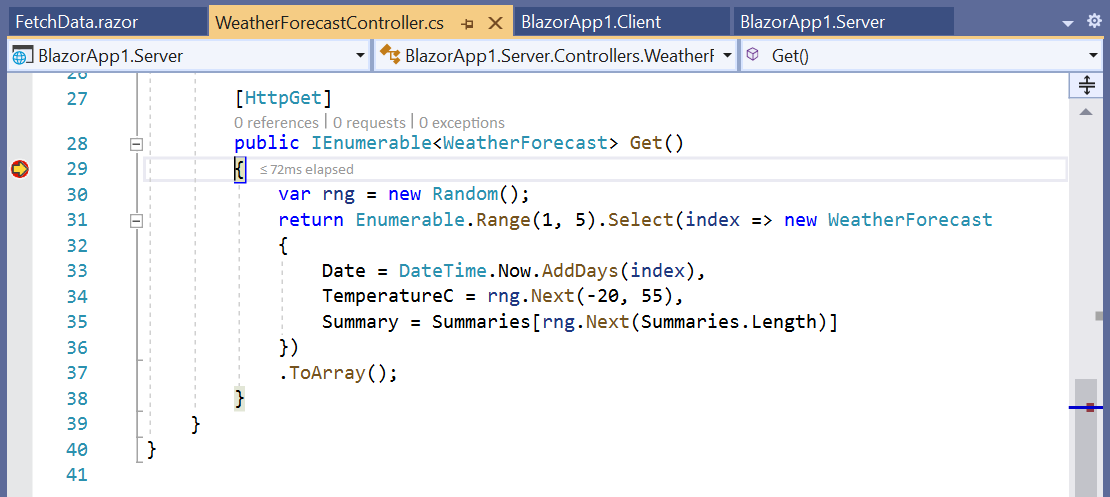
Hit F5 again to let execution continue and see the weather forecast table rendered.
To debug a Blazor WebAssembly app in Visual Studio Code:
Install the C# extension and the JavaScript Debugger (Nightly) extension with the debug.javascript.usePreview setting set to true.


Open an existing Blazor WebAssembly app with debugging enabled.
a. If you get the following notification that additional setup is required to enable debugging, recheck that you have the correct extensions installed and JavaScript preview debugging enabled and then reload the window:

b. A notification should offer to add required assets for building and debugging to the app. Select “Yes”.

Starting the app in the debugger is then a two-step process:
a. Start the app first using the “.NET Core Launch (Blazor Standalone)” launch configuration.
b. Then start the browser using the “.NET Core Debug Blazor Web Assembly in Chrome” launch configuration (requires Chrome). To use the latest stable release of Edge instead of Chrome, change the type of the launch configuration in .vscode/launch.json from pwa-chrome to pwa-msedge.
Set a breakpoint in the IncrementCount method in the Counter component and then select the button to hit the breakpoint:
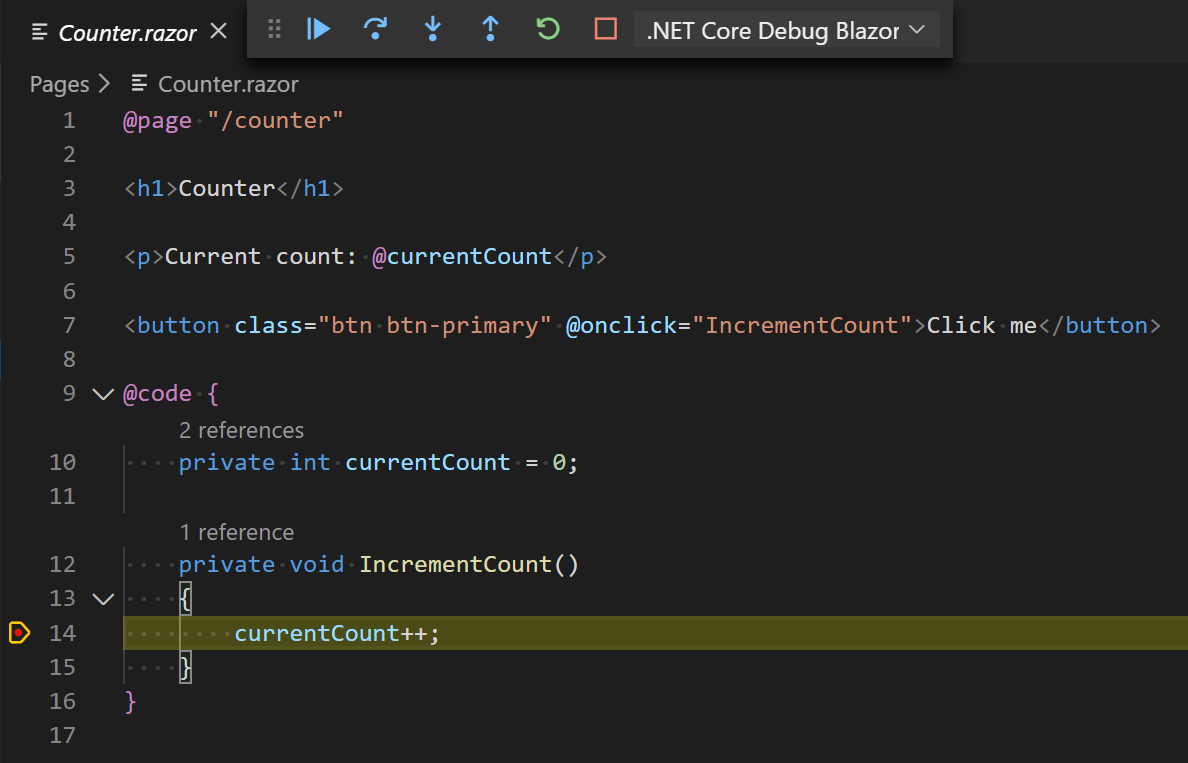
There are a number of limitations with the current debugging experience in Visual Studio and Visual Studio Code. The following debugging features are not yet fully implemented:
We expect to continue to improve the debugging experience in future releases. We appreciate your feedback to help us get the Blazor WebAssembly debugging experience right!
Visual Studio 2019 16.6 will watch for file changes in .cs and .razor files across the solution and automatically rebuild and restart the app so that the changes can been by simply refreshing the browser. This enables auto-rebuild support for Blazor WebAssembly projects and Razor Class Libraries. Instead of manually rebuilding and restarting the app when making code changes, just edit, save, and then refresh the browser.
Blazor WebAssembly apps now have built-in support for loading configuration data from appsettings.json and environment specific configuration data from appsettings.{environment}.json.
To add configuration data to your Blazor WebAssembly app:
{
    "message": "Hello from config!"
}
IConfiguration instance into your components to access the configuration data.@page "/"
@using Microsoft.Extensions.Configuration
@inject IConfiguration Configuration
<h1>Configuration example</h1>
<p>@Configuration["message"]</p>
Run the app to see the configured message displayed on the home page.
To optionally override this configuration with values specific to the Development environment, add an appsettings.Development.json to your wwwroot folder:
{
    "message": "Hello from Development config!"
}
Note: Blazor WebAssembly apps load the configuration data by downloading the JSON files to the browser, so these configuration files must be publicly addressable. Do not store secrets in these configuration files, as they are public and can be viewed by anyone.
The .NET team has been hard at work creating a full set of new extension methods for HttpClient that handle JSON serialization and deserialization using System.Text.Json. These extension methods are now available in preview with the System.Net.Http.Json package and they will replace the existing helper methods in the Microsoft.AspNetCore.Blazor.HttpClient package. We haven’t updated the Blazor WebAssembly template yet to use the new extension methods, but we will in our next Blazor WebAssembly preview update.
You can try the new extension methods yourself by replacing the Microsoft.AspNetCore.Blazor.HttpClient package with the newer System.Net.Http.Json package. Then add @using System.Net.Http.Json to your _Imports.razor file and update your code as follows:
| Microsoft.AspNetCore.Blazor.HttpClient | System.Net.Http.Json |
|---|---|
GetJsonAsync |
GetFromJsonAsync |
PostJsonAsync |
PostAsJsonAsync |
PutJsonAsync |
PutAsJsonAsync |
The updated implementation of the FetchData component in the default Blazor WebAssembly template looks like this:
@code {
    private WeatherForecast[] forecasts;

    protected override async Task OnInitializedAsync()
    {
        forecasts = await Http.GetFromJsonAsync<WeatherForecast[]>("WeatherForecast");
    }
}
System.Net.Http.Json also provides a JsonContent class that can be used for sending serialized JSON, as well as convenient helper methods for reading JSON from an HttpContent instance.
Look for more details on System.Net.Http.Json to be published soon on the .NET blog.
There are a few known issues with this release that you may run into:
When building a Blazor WebAssembly app using an older .NET Core SDK you may see the following build error:
error MSB4018: The "ResolveBlazorRuntimeDependencies" task failed unexpectedly.
error MSB4018: System.IO.FileNotFoundException: Could not load file or assembly 'BlazorApp1objDebugnetstandard2.1BlazorApp1.dll'. The system cannot find the file specified.
error MSB4018: File name: 'BlazorApp1objDebugnetstandard2.1BlazorApp1.dll'
error MSB4018:    at System.Reflection.AssemblyName.nGetFileInformation(String s)
error MSB4018:    at System.Reflection.AssemblyName.GetAssemblyName(String assemblyFile)
error MSB4018:    at Microsoft.AspNetCore.Components.WebAssembly.Build.ResolveBlazorRuntimeDependencies.GetAssemblyName(String assemblyPath)
error MSB4018:    at Microsoft.AspNetCore.Components.WebAssembly.Build.ResolveBlazorRuntimeDependencies.ResolveRuntimeDependenciesCore(String entryPoint, IEnumerable`1 applicationDependencies, IEnumerable`1 monoBclAssemblies)
error MSB4018:    at Microsoft.AspNetCore.Components.WebAssembly.Build.ResolveBlazorRuntimeDependencies.Execute()
error MSB4018:    at Microsoft.Build.BackEnd.TaskExecutionHost.Microsoft.Build.BackEnd.ITaskExecutionHost.Execute()
error MSB4018:    at Microsoft.Build.BackEnd.TaskBuilder.ExecuteInstantiatedTask(ITaskExecutionHost taskExecutionHost, TaskLoggingContext taskLoggingContext, TaskHost taskHost, ItemBucket bucket, TaskExecutionMode howToExecuteTask)
To address this issue, update to version 3.1.201 or later of the .NET Core 3.1 SDK.
You may see the following warning when building from the command-line:
CSC : warning CS8034: Unable to load Analyzer assembly C:Usersuser.nugetpackagesmicrosoft.aspnetcore.components.analyzers3.1.0analyzersdotnetcsMicrosoft.AspNetCore.Components.Analyzers.dll : Assembly with same name is already loaded
To address this issue, update to your package reference to Microsoft.AspNetCore.Components to 3.1.3 or newer. If your project reference the Microsoft.AspNetCore.Components package through a transitive package reference that has not been updated, you can add a reference in your project to resolve the issue in your project.
The following error may occur when publishing an ASP.NET Core hosted Blazor app with the .NET IL linker disabled:
An assembly specified in the application dependencies manifest (BlazorApp1.Server.deps.json) was not found
This error occurs when assemblies shared by the server and Blazor client project get removed during publish (see https://github.com/dotnet/aspnetcore/issues/19926).
To workaround this issue, ensure that you publish with the .NET IL linker enabled. To publish with the linker enabled:
dotnet publish -c Release. The .NET IL linker is automatically run for Release builds, but not for Debug builds. BlazorWebAssemblyEnableLinking to false in your client project file.If you’re hitting issues running with the linker disabled, you may need to configure the linker to preserve code that is being called using reflection. See https://docs.microsoft.com/aspnet/core/host-and-deploy/blazor/configure-linker for details.
We hope you enjoy the new features in this preview release of Blazor WebAssembly! Please let us know what you think by filing issues on GitHub.
Thanks for trying out Blazor!
The post Blazor WebAssembly 3.2.0 Preview 3 release now available appeared first on ASP.NET Blog.
Visual Studio 2019 version 16.6 Preview 2 comes with several new, exciting capabilities for you to try today. We recognize that everyone is facing unprecedented stress and concerns with current world events. The Visual Studio team are all working from home and learning how to navigate the challenges that brings to our day-to-day lives. Alas, even in these uncertain times, the team is extremely excited to bring you this latest update. Visual Studio 2019 version 16.6 Preview 2 comes with several new capabilities for you to try. Also, you have the opportunity to offer feedback in Developer Community. As you download and try these new features, we would like to extend our warmest wishes to your health and safety through the upcoming weeks.
First of all, we are revamping our Git functionality to provide an improved experience when working with code on remote Git hosting services. You can begin working on code by browsing online GitHub or Azure repositories through Visual Studio and cloning them locally. For new projects, you can initialize the Git repository and push it to be hosted on GitHub with a single click. Once the code is loaded in Visual Studio, the new Git tool window consolidates all the Git operations having to do with your code.
Additionally, this feature streamlines the complex navigation for Git that used to live within Team Explorer. The new window minimizes context-switching between tools and applications by focusing on your daily developer workflows with actions like commit, pull, push, stash, and more. From the tool, you can quickly jump to workflows like the new branching experience. Last, there is also a new top-level Git menu to easily find all of your Git commands. This servers as a replacement of the old Teams menu. We continue to work hard to provide a first-class Git and GitHub experience in Visual Studio, and this is just the beginning.
Based on customer feedback, we wanted to minimize the friction involved in using Snapshot Debugger for the first time. You can now install Snapshot Debugger on Azure App Services (ASP.NET Core 3.1) without requiring a restart. This enables you to debug and diagnose live issues without interruption to your service! Attaching to Snapshot Debugger with Visual Studio Enterprise requires an install of the Snapshot Debugger site extension on your App Service deployment. This process previously required a restart.
Visual Studio 2019 version 16.6 Preview 2 has a new .NET Async tool as part of the Performance Profiler suite of tools. This adds ease to understanding and optimizing async/await code in .NET. Basically, you can use this tool to get exact timing information for a variety of tasks including how long they waited to be dispatched to a thread, how long it took to complete, and if the tasks were chained together.
The JavaScript/TypeScript debugger now supports debugging service workers, web workers, iFrames, and your page JavaScript all at the same time! In addition, the new debugging experience adds support for debugging your back-end node server applications and client-side JavaScript in the browser simultaneously.
Almost always providing new updates, the .NET team has added an explicit cast when an expression cannot be implicitly cast. You can access this functionality by placing your cursor on the error and press Ctrl+ to trigger the Quick Actions and Refactorings menu. The option to Add explicit cast beomes available at that point.
Another feedback implementation coming into the product is the ability to automatically generate file headers to existing files, projects, and solutions by using an EditorConfig. If you’d like to give this a try, you can add the file_header_template rule to your EditorConfig file. Next, set the value to equal the header text you would like applied.
Once your cursor is on the first line of any C# or Visual Basic file, you can use Ctrl+ to trigger the Quick Actions and Refactorings menu where the option to Add file banner becomes available. From here you can apply the file header of an existing project or solution by clicking Fix all occurences in. We think this adds some great functionality. Do you?
Also in .NET, you can simplify conditional expressions by removing unnecessary code using the new Simplify conditional expression refactoring capability. Once again, Ctrl+ is the pathway to finding the menu option for Simplify conditional expression. Be sure to give this a try!
Additionally, from the same menu, a new option, Convert verbatim string allows you to convert regular string literals to verbatim string literals. The converse is also true where you can Convert to regular string from verbatim strings.
With the new ML.NET Model Builder, you can easily build and consume machine learning models for text classification, value prediction, recommendation, and image classification in your .NET applications. All you need to do is select your ML scenario and choose your dataset. Model Builder will take care of training models, selecting the best model for your data, and generating the .NET code for consuming the model in your app. You can even scale out to the cloud and take advantage of Azure Machine Learning for image classification models without leaving Visual Studio or .NET.
Publishing now offers a new wizard-like experience for creating new publish profiles. This tool guides you through your various options. Even if some Visual Studio components are missing from your installation, you will still have access to the full set of publishing targets and options. Consequently, any of your missing components will be identified and requested to be installed on demand. The publish profile summary page has also been updated to match the new experience available under the Connected Services tab for configuring dependencies to Azure services as detailed above.
We have added Ninja support for CMake for Linux/WSL. Now, you can use Ninja as the underlying generator when building CMake projects on WSL or a remote system. In addition, Ninja is now the default generator when you are adding a new Linux or WSL configuration. In addition, we have added simplified debugging templates for remote CMake debugging.
We have also improved Doxygen & XML comment generation support by adding the /** trigger sequence and enhancing member list tooltips.
On the same line of adding helpful support, our IntelliSense code linter now underlines code errors and suggests quick fixes in C++ projects. You can enable this tool under Tools > Options > Environment > Preview Features > IntelliSense code linter for C++.
The C++ team has put together blog posts on the Linter and XML commenter if you would like to know more.
We have been working hard to keep bringing enhancements to the product. Also, we continue to address any issues brought up in Developer Community, so we invite you to participate with any issues or suggestions. Thank you for giving these features a try! If you’d like additional information on what we are working on next, check out the newly updated Visual Studio 2019 product roadmap. Meanwhile, we hope you and your loved ones stay healthy and safe.
The post Visual Studio 2019 version 16.6 Preview 2 Brings New Features Your Way appeared first on Visual Studio Blog.
In Visual Studio 2019 version 16.6 Preview 2, we’re excited to announce a new preview feature to help C++ developers identify and fix code defects as they write code. The IntelliSense Code Linter for C++ checks your code “as-you-type,“ underlines problems in the editor, and Lightbulb actions offer suggested fixes.

This new feature is built on the existing IntelliSense capabilities for C++ in Visual Studio. This means results are provided more quickly than results from Background Code Analysis. In order to ensure that IntelliSense stays as fast as possible, the linter checks are focused on easily detected issues. The new linter checks complement existing code analysis tools (like Background Code Analysis using MSVC or Clang-Tidy) which handle complex analysis.
You can try out the linter today by enabling it from the Preview Features pane in the Tools > Options menu.
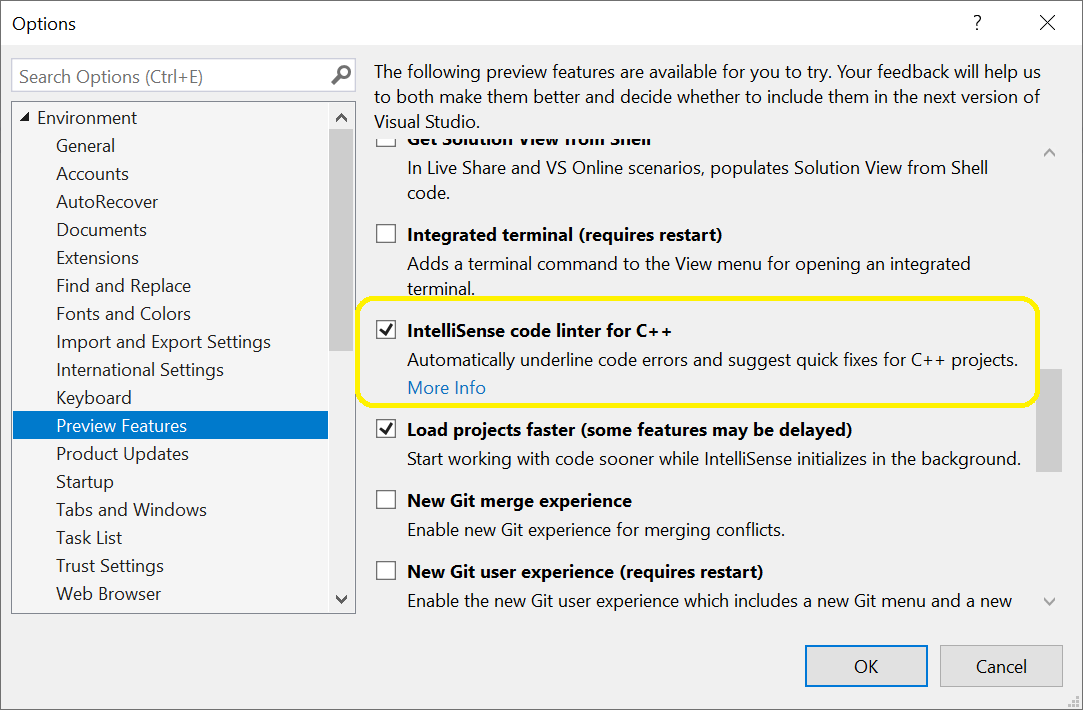
When deciding what would make a good linter check, we kept a few goals in mind.
With these goals in mind, we have implemented the following checks in Preview 2.
This check finds cases where arithmetic is evaluated with 32-bit types and then assigned to a wider type. Assigning to a wider type is a good indication that the developer expected the expression value to exceed the range of a 32-bit type. In C++ the expression will be evaluated as 32-bit, which may overflow, and then widened for assignment.

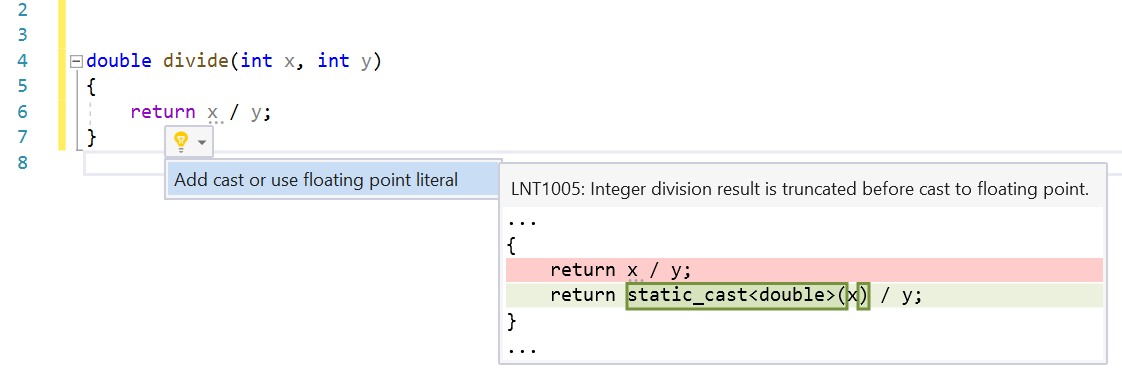
This check finds places where integer division is assigned to a floating-point type. Assigning to a floating-point type is a good indication that the developer wanted the fractional part of the result. In C++, the integer division will be evaluated, and the fractional part will be truncated before the result is assigned to the floating-point type.
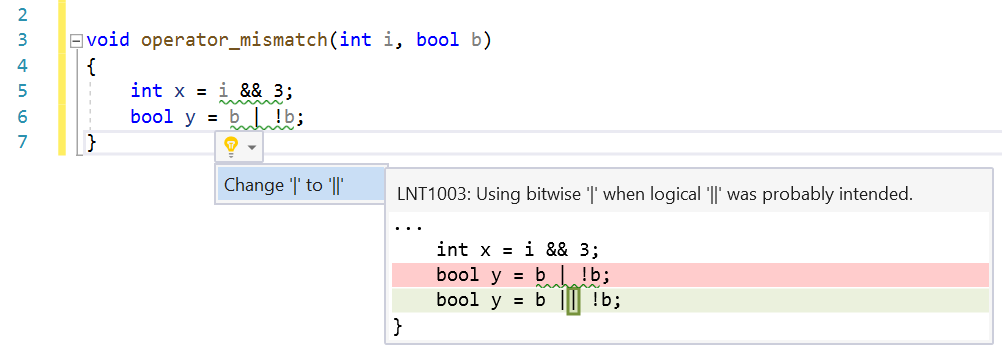
This check finds cases where logical operators are used with integer values or using bitwise operators with Boolean values. C++ allows this because of implicit conversions, but the practice is error prone and hurts code readability.
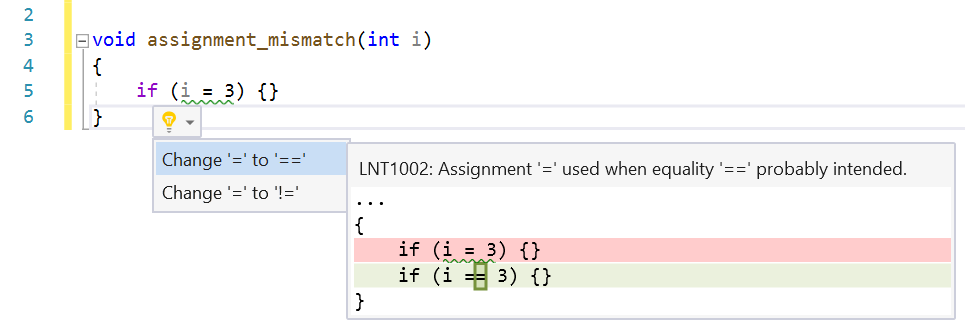
Using the assignment operator in conditional expressions is syntactically correct but may be a logical error. This check looks for cases where variables are being assigned from constants in conditions. This is almost always incorrect because it forces the condition to always be true or false.
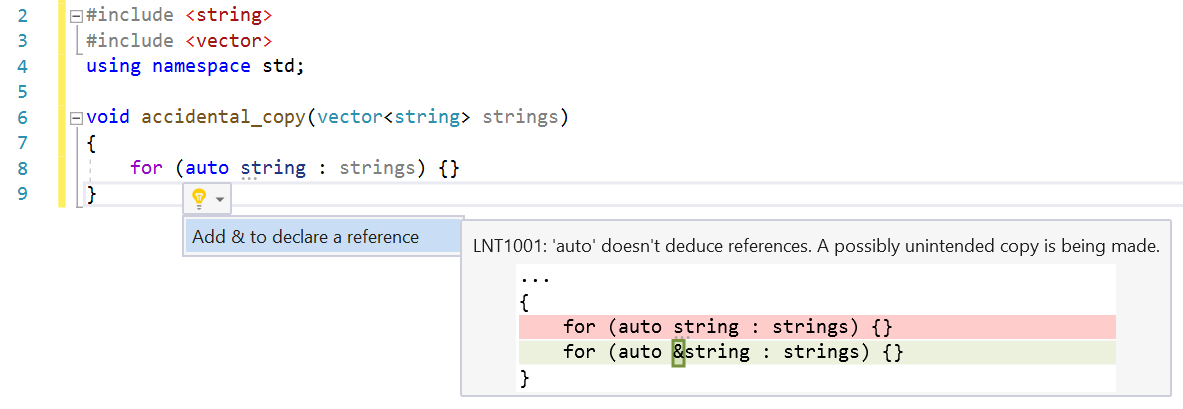
The auto keyword in C++ is a great feature, especially when interacting with templated code. It has one subtle behavior that can be confusing or easily overlooked by C++ developers of all skill levels. auto does not deduce references so in cases where a declared variable is being assigned from an expression that returns a reference, a copy is made. This isn’t always a bug, but we wanted to help developers be aware that a copy is being made, when maybe it wasn’t desired.
Primitive variables in C++ are not initialized to any value by default. This can lead to non-deterministic behaviors at runtime. The current implementation of this check is very aggressive and will warn on any declaration that doesn’t have an initializer.
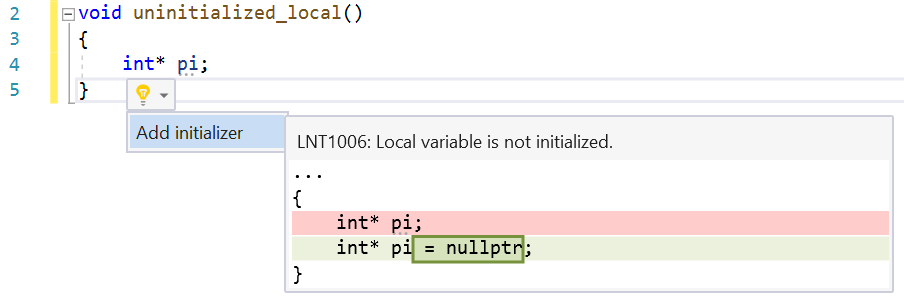
The new linter is still a work in progress, but we are excited to be able to ship a preview release that developers can try out. Here are a few features that will be coming in future releases.
We’ve been working hard to make an editor that helps developers “shift left” and find bugs earlier in the development loop. We hope that you find the new IntelliSense Code Linter for C++ useful. Please try it out and let us know what you think. We can be reached via the comments below, email (visualcpp@microsoft.com), and Twitter (@VisualC). The best way to file a bug or suggest a feature is via Developer Community. Happy coding!
The post IntelliSense Code Linter for C++ appeared first on C++ Team Blog.
Whether you’re using Doxygen or XML Doc Comments, Visual Studio version 16.6 Preview 2 provides automatic comment stub generation as well as Quick Info, Parameter Help, and Member List tooltip support.
By default, the stub generation is set to XML Doc Comments. The comment stub can be generated by typing a triple slash (///) or by using the documentation generation shortcut (Ctrl+/) above the function.
To switch to Doxygen, type “Doxygen” in the Ctrl+Q search box, or go to Tools > Options > Text Editor > C/C++ > > General, and choose your preferred documentation style:
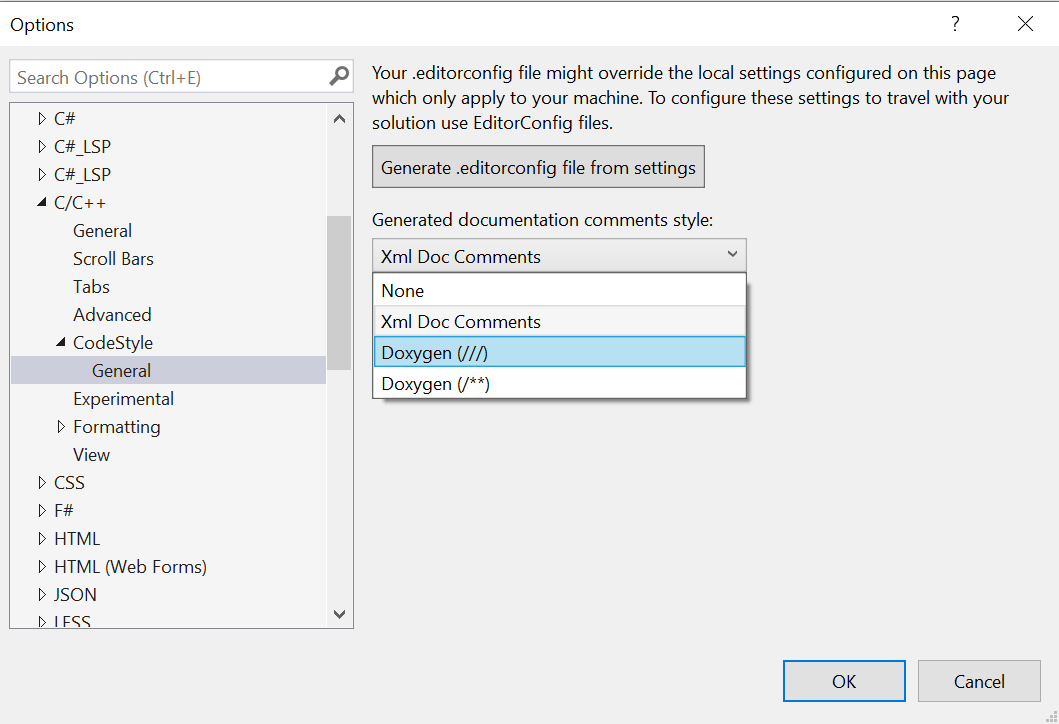
Once specified, you can generate the comment stub by typing the respective “///” or “/**” above a function, or by using the (Ctrl+/) shortcut.
You can also specify this documentation option on a per-folder or per-file basis via .editorconfig files with the corresponding setting:
vc_generate_documentation_comments = none
vc_generate_documentation_comments = xml
vc_generate_documentation_comments = doxygen_triple_slash
vc_generate_documentation_comments = doxygen_slash_star
To get started, you can have Visual Studio generate an .editorconfig file for you based on your existing setting for documentation by using the “Generate .editorconfig file from settings” button shown in the screenshot above.
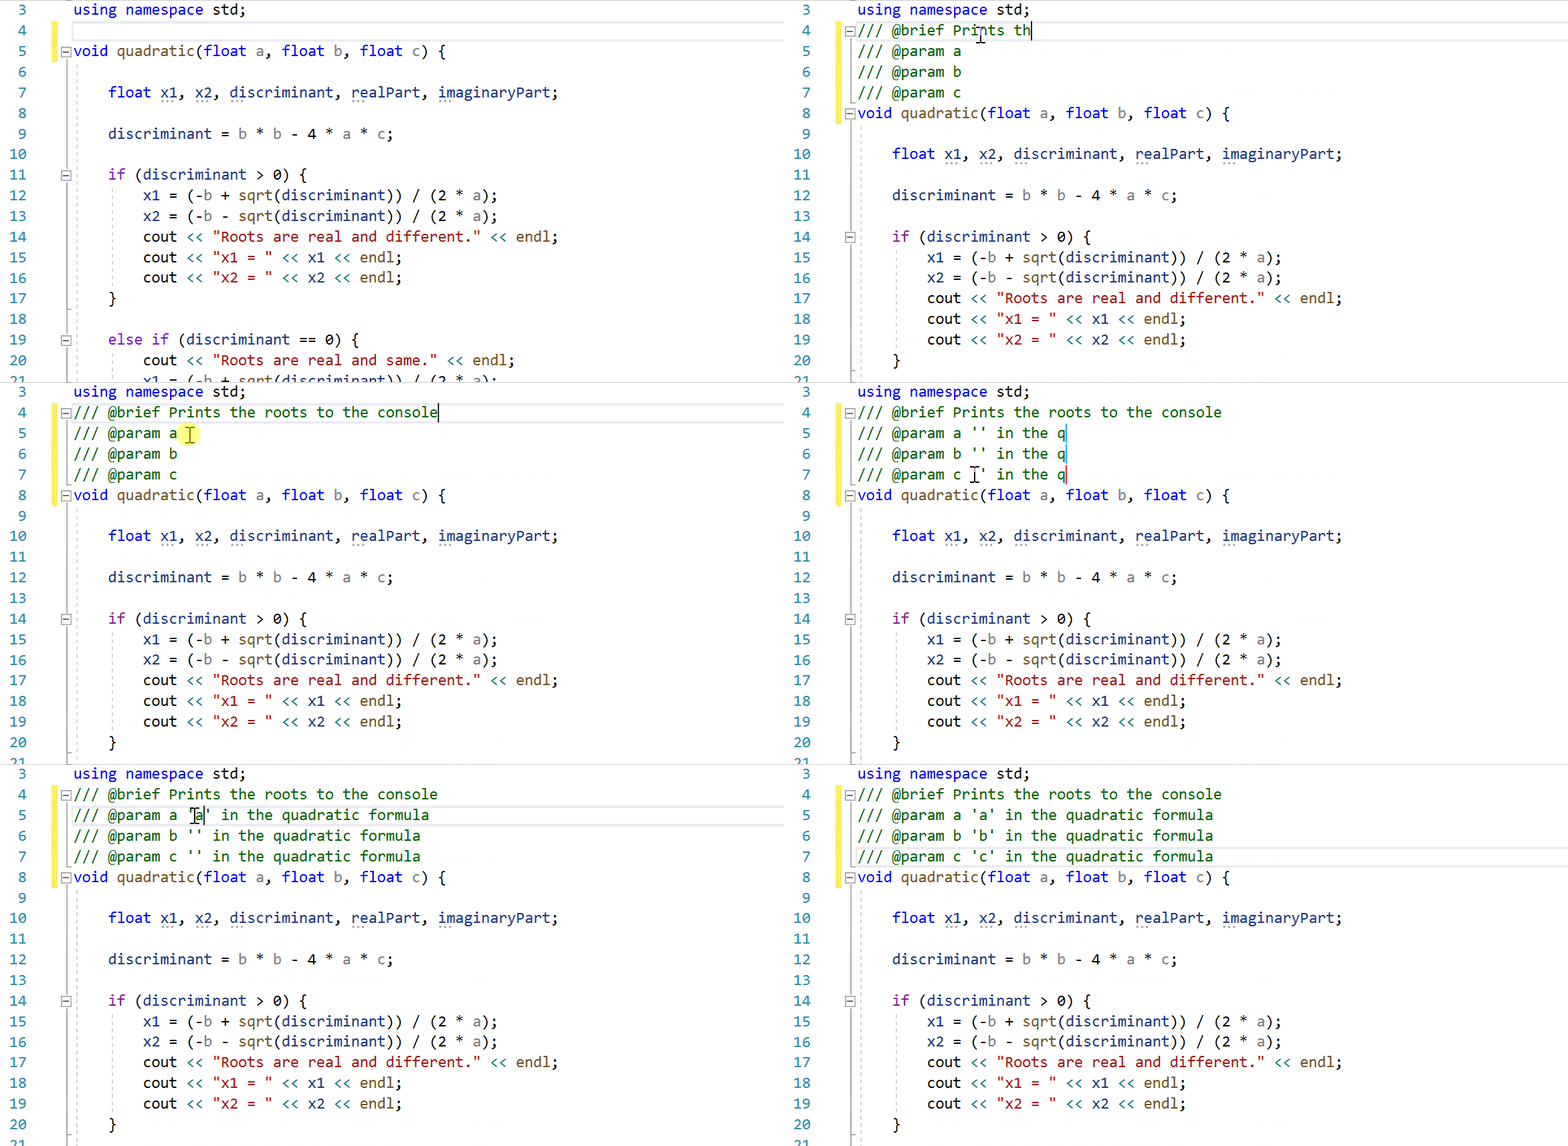
Documentation artifacts will now appear in Quick Info, Member List, and Parameter Help tooltips:

Download Visual Studio 2019 version 16.6 Preview 2 today and give this new documentation support a try. We can be reached via the comments below, email (visualcpp@microsoft.com), and Twitter (@VisualC). The best way to file a bug or suggest a feature is via Developer Community.
The post Doxygen and XML Doc Comment support appeared first on C++ Team Blog.
Here’s what Microsoft’s venture fund learned in the process.
The post M12 turned its Female Founders Competition into a virtual event appeared first on Microsoft 365 Blog.
We are excited to announce full support for a conformant preprocessor in the MSVC toolset starting with Visual Studio 2019 version 16.6 Preview 2.
Since the original blog post announcing preprocessor conformance changes, we’ve come a long way and are now ready to announce the completion of the C/C++ conformant preprocessor and its move to a non-experimental, fully supported state via the /Zc:preprocessor switch. Alongside standard conformance, the preprocessor also supports C++20’s __VA_OPT__ and is also available in the C language mode.
To reach conformance, a couple of additional features have been added to the preprocessor and MSVC compiler, including a variety of bug fixes, __VA_OPT__, and _Pragma support.
Bugfixes involving various parts of the preprocessor, from parameter expansion and special macro names like __FUNCSIG__ to reporting arity errors and line number fixes. Special thanks to Edward Diener for providing a lot of valuable feedback!
__VA_OPT__ is a new feature of variadic macros in C++20. It lets you optionally insert tokens depending on if a variadic macro is invoked with additional arguments. An example usage is comma elision in a standardized manner.
#define M(X, …) X __VA_OPT__(,) __VA_ARGS__
M(3) // expands to 3
M(3, 4) // expands to 3, 4
The _Pragma operator has been one of the long-standing deficiencies of the preprocessor, and a blocker in being standard conformant in C++ and C99. Though MSVC had the non-conformant __pragma, the semantics differ in that _Pragma takes a string literal as its parameter instead of a series of preprocessor tokens. This feature is now implemented.
_Pragma(“once”)
#define GUARD _Pragma(“once”)
There were some contextual keyword changes relating to modules. These changes unblock further C++20 modules work.
Preprocessor-only output (via /E and /P) is now prettier, reducing the amount of line directives and fixing some formatting issues.
All that is needed to use the conformant preprocessor is to add /Zc:preprocessor to your compilation flags. The flag is available in C and C++ language modes. It works with any language level, but we plan to enable it for /std:c++latest in a future release.
| Language mode | /Zc:preprocessor |
| /std:c++14 | Not implied |
| /std:c++17 | Not implied |
| /std:c++latest | Implied in a future update (Not implied in VS 2019 v16.6) |
The conformant preprocessor can be tested by checking if the macro _MSVC_TRADITIONAL is defined and set to 0.
#if defined(_MSVC_TRADITIONAL) && _MSVC_TRADITIONAL
// old behavior
#else
// new behavior
#endif
The legacy preprocessor is not going anywhere, it will continue to serve as a compatibility layer for old code, but it will only be serviced with the intention of keeping old code working. Additionally, the /experimental:preprocessor switch is still available and will activate /Zc:preprocessor in VS 2019 v16.6 but will be removed in a future release. Any projects that have been configured to use the experimental switch should migrate to the supported version.
Improved diagnostics are in the works, which will provide a better expansion context for macro invocation and errors.
This feature is not currently implied by any other flags, but we are planning to include it in /std:c++latest once we stabilize the public SDK headers from using non-conformant macros. Using the latest Windows SDK is advised, as many of the noisy warnings are fixed in later SDK versions.
Let us know how the conformant preprocessor works for you! Get it in Visual Studio 2019 version 16.6 Preview 2 (please see https://visualstudio.microsoft.com/vs/preview/ for download links) and try it out.
As always, we welcome your feedback. We can be reached via the comments below or via email (visualcpp@microsoft.com). If you encounter problems with Visual Studio or MSVC, or have a suggestion for us, please let us know through Help > Send Feedback > Report A Problem / Provide a Suggestion in the product, or via Developer Community. You can also find us on Twitter (@VisualC).
The post Announcing full support for a C/C++ conformant preprocessor in MSVC appeared first on C++ Team Blog.
Today we’re announcing the availabilty of TypeScript 3.9 Beta!
To get started using the beta, you can get it through NuGet, or use npm with the following command:
npm install typescript@beta
You can also get editor support by
For this release our team been has been focusing on performance, polish, and stability. We’ve been working on speeding up the compiler and editing experience, getting rid of friction and papercuts, and reducing bugs and crashes. We’ve also received a number of useful and much-appreciated features and fixes from the external community!
Promise.all// @ts-expect-error CommentsPromise.allRecent versions of TypeScript (around 3.7) have had updates to the declarations of functions like Promise.all and Promise.race. Unfortunately, that introduced a few regressions, especially when mixing in values with null or undefined.
interface Lion {
    roar(): void
}

interface Seal {
    singKissFromARose(): void
}

async function visitZoo(lionExhibit: Promise<Lion>, sealExhibit: Promise<Seal | undefined>) {
    let [lion, seal] = await Promise.all([lionExhibit, sealExhibit]);
    lion.roar(); // uh oh
//  ~~~~
// Object is possibly 'undefined'.
}
This is strange behavior! The fact that sealExhibit contained an undefined somehow poisoned type of lion to include undefined.
Thanks to a pull request from Jack Bates, this has been fixed with improvements in our inference process in TypeScript 3.9. The above no longer errors. If you’ve been stuck on older versions of TypeScript due to issues around Promises, we encourage you to give 3.9 a shot!
awaited Type?If you’ve been following our issue tracker and design meeting notes, you might be aware of some work around a new type operator called awaited. This goal of this type operator is to accurately model the way that Promise unwrapping works in JavaScript.
We initially anticipated shipping awaited in TypeScript 3.9, but as we’ve run early TypeScript builds with existing codebases, we’ve realized that the feature needs more design work before we can roll it out to everyone smoothly. As a result, we’ve decided to pull the feature out of our main branch until we feel more confident. We’ll be experimenting more with the feature, but we won’t be shipping it as part of this release.
TypeScript 3.9 ships with many new speed improvements. Our team has been focusing on performance after observing extremely poor editing/compilation speed with packages like material-ui and styled-components. We’ve dived deep here, with a series of different pull requests that optimize certain pathological cases involving large unions, intersections, conditional types, and mapped types.
Each of these pull requests gains about a 5-10% reduction in compile times on certain codebases. In total, we believe we’ve achieved around a 40% reduction in material-ui’s compile time!
We also have some changes to file renaming functionality in editor scenarios. We heard from the Visual Studio Code team that when renaming a file, just figuring out which import statements needed to be updated could take between 5 to 10 seconds. TypeScript 3.9 addresses this issue by changing the internals of how the compiler and language service caches file lookups.
While there’s still room for improvement, we hope this work translates to a snappier experience for everyone!
// @ts-expect-error CommentsImagine that we’re writing a library in TypeScript and we’re exporting some function called doStuff as part of our public API. The function’s types declare that it takes two strings so that other TypeScript users can get type-checking errors, but it also does a runtime check (maybe only in development builds) to give JavaScript users a helpful error.
function doStuff(abc: string, xyz: string) {
    assert(typeof abc === "string");
    assert(typeof xyz === "string");

    // do some stuff
}
So TypeScript users will get a helpful red squiggle and an error message when they misuse this function, and JavaScript users will get an assertion error. We’d like to test this behavior, so we’ll write a unit test.
expect(() => {
    doStuff(123, 456);
}).toThrow();
Unfortunately if our tests are written in TypeScript, TypeScript will give us an error!
    doStuff(123, 456);
//          ~~~
// error: Type 'number' is to assignable to type 'string'.
That’s why TypeScript 3.9 brings a new feature: // @ts-expect-error comments. When a line is prefixed with a // @ts-expect-error comment, TypeScript will suppress that error from being reported; but if there’s no error, TypeScript will report that // @ts-expect-error wasn’t necessary.
As a quick example, the following code is okay
// @ts-expect-error
console.log(47 * "octopus");
while the following code
// @ts-expect-error
console.log(1 + 1);
results in the error
Unused '@ts-expect-error' directive.
We’d like to extend a big thanks to Josh Goldberg, the contributor who implemented this feature. For more information, you can take a look at the ts-expect-error pull request.
ts-ignore or ts-expect-error?In some ways // @ts-expect-error can act as a new suppression comment, similar to // @ts-ignore. The difference is that // @ts-ignore comments will do nothing if the following line is error-free.
You might be tempted to switch existing // @ts-ignore comments over to // @ts-expect-error, and you might be wondering which is appropriate for future code. While it’s entirely up to you and your team, we have some ideas of which to pick in certain situations.
Pick ts-expect-error if:
Pick ts-ignore if:
In TypeScript 3.7 we introduced uncalled function checks to report an error when you’ve forgotten to call a function.
function hasImportantPermissions(): boolean {
    // ...
}

// Oops!
if (hasImportantPermissions) {
//  ~~~~~~~~~~~~~~~~~~~~~~~
// This condition will always return true since the function is always defined.
// Did you mean to call it instead?
    deleteAllTheImportantFiles();
}
However, this error only applied to conditions in if statements. Thanks to a pull request from Alexander Tarasyuk, this feature is also now supported in ternary conditionals (i.e. the cond ? trueExpr : falseExpr syntax).
declare function listFilesOfDirectory(dirPath: string): string[];
declare function isDirectory(): boolean;

function getAllFiles(startFileName: string) {
    const result: string[] = [];
    traverse(startFileName);
    return result;

    function traverse(currentPath: string) {
        return isDirectory ?
        //     ~~~~~~~~~~~
        // This condition will always return true
        // since the function is always defined.
        // Did you mean to call it instead?
            listFilesOfDirectory(currentPath).forEach(traverse) :
            result.push(currentPath);
    }
}
https://github.com/microsoft/TypeScript/issues/36048
The TypeScript compiler not only powers the TypeScript editing experience in most major editors, it also powers the JavaScript experience in the Visual Studio family of editors and more. Using new TypeScript/JavaScript functionality in your editor will differ depending on your editor, but
One great new improvement is in auto-imports in JavaScript files using CommonJS modules.
In older versions, TypeScript always assumed that regardless of your file, you wanted an ECMAScript-style import like
import * as fs from "fs";
However, not everyone is targeting ECMAScript-style modules when writing JavaScript files. Plenty of users still use CommonJS-style require(...) imports like so
const fs = require("fs");
TypeScript now automatically detects the types of imports you’re using to keep your file’s style clean and consistent.
For more details on the change, see the corresponding pull request.
TypeScript’s refactorings and quick fixes often didn’t do a great job of preserving newlines. As a really basic example, take the following code.
const maxValue = 100;

/*start*/
for (let i = 0; i <= maxValue; i++) {
    // First get the squared value.
    let square = i ** 2;

    // Now print the squared value.
    console.log(square);
}
/*end*/
If we highlighted the range from /*start*/ to /*end*/ in our editor to extract to a new function, we’d end up with code like the following.
const maxValue = 100;

printSquares();

function printSquares() {
    for (let i = 0; i <= maxValue; i++) {
        // First get the squared value.
        let square = i ** 2;
        // Now print the squared value.
        console.log(square);
    }
}
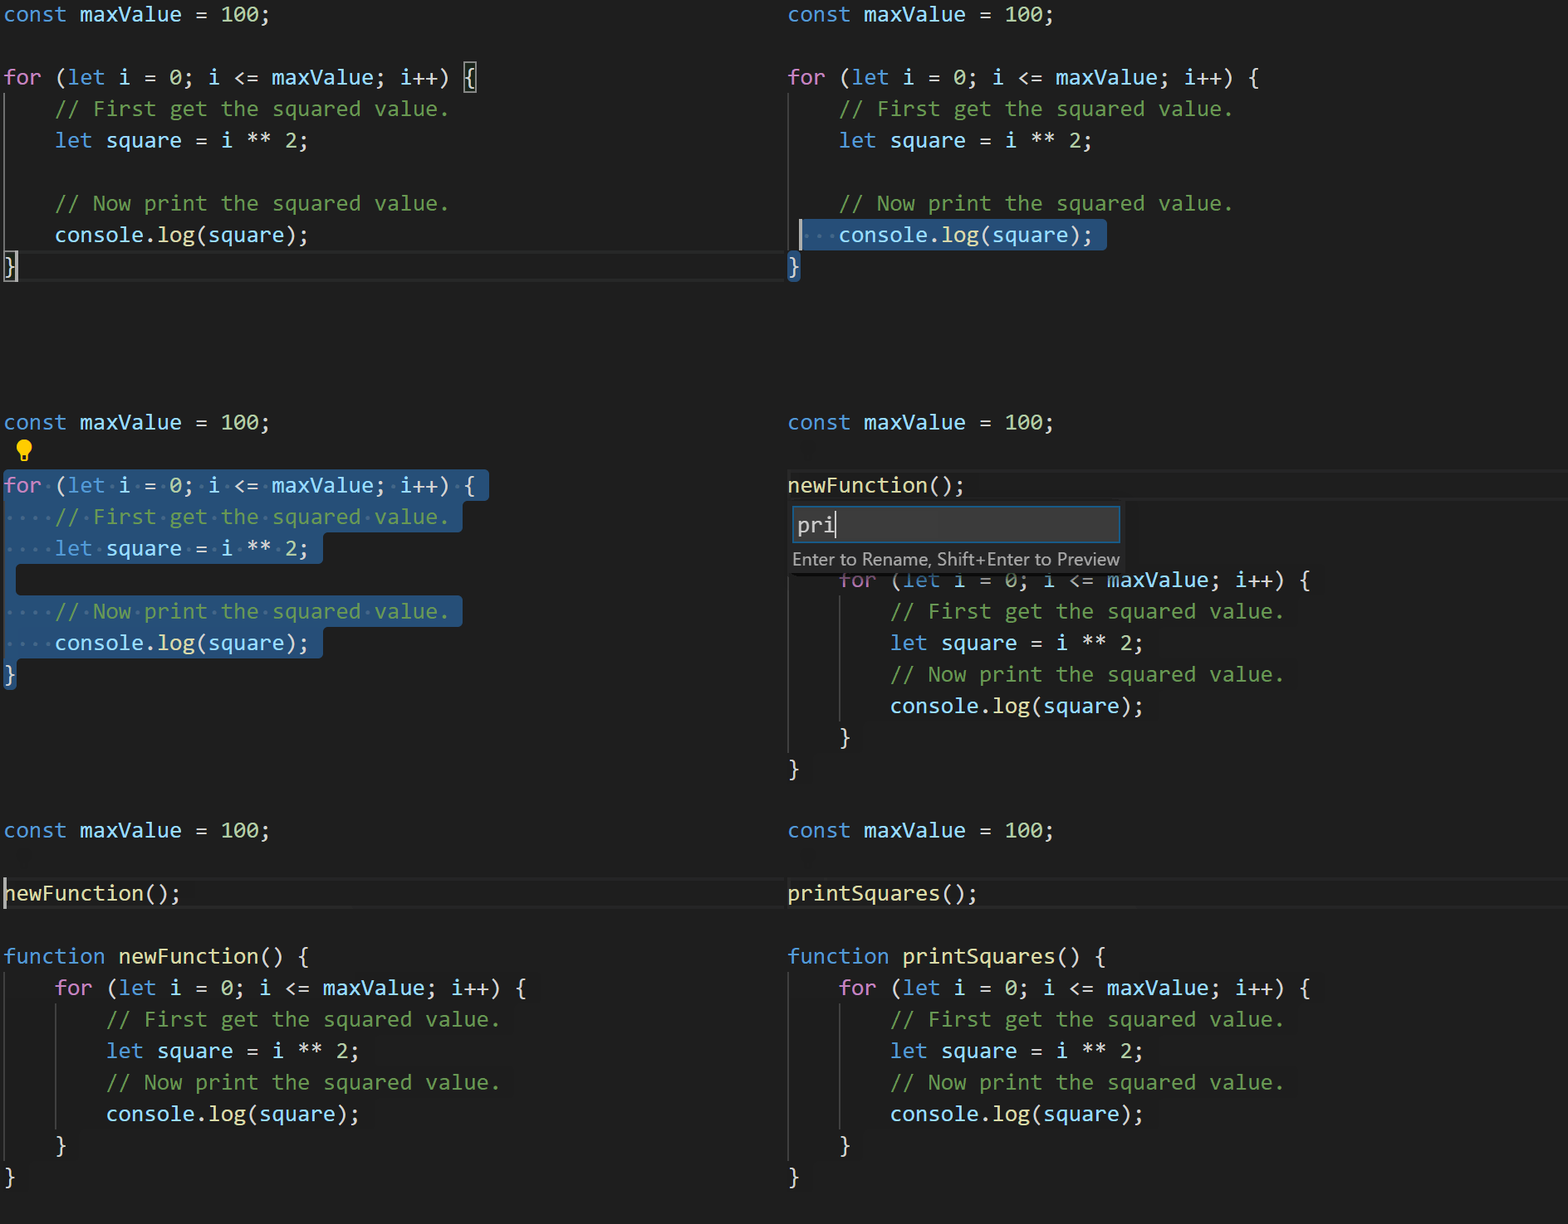
That’s not ideal – we had a blank line between each statement in our for loop, but the refactoring got rid of it! TypeScript 3.9 does a little more work to preserve what we write.
const maxValue = 100;

printSquares();

function printSquares() {
    for (let i = 0; i <= maxValue; i++) {
        // First get the squared value.
        let square = i ** 2;

        // Now print the squared value.
        console.log(square);
    }
}

You can see more about the implementation in this pull request
tsconfig.json FilesEditors need to figure out which configuration file a file belongs to so that it can apply the appropriate options and figure out which other files are included in the current “project”. By default, editors powered by TypeScript’s language server do this by walking up each parent directory to find a tsconfig.json.
One case where this slightly fell over is when a tsconfig.json simply existed to reference other tsconfig.json files.
// tsconfig.json
{
    "files": [],
    "references": [
        { "path": "./tsconfig.shared.json" },
        { "path": "./tsconfig.frontend.json" },
        { "path": "./tsconfig.backend.json" },
    ]
}
This file that really does nothing but manage other project files is often called a “solution” in some environments. Here, none of these tsconfig.*.json files get picked up by the server, but we’d really like the language server to understand that the current .ts file probably belonds to one of the mentioned projects in this root tsconfig.json.
TypeScript 3.9 adds support to editing scenarios for this configuration. For more details, take a look at the pull request that added this functionality.
TypeScript recently implemented the optional chaining operator, but we’ve received user feedback that the behavior of optional chaining (?.) with the non-null assertion operator (!) is extremely counter-intuitive.
Specifically, in previous versions, the code
foo?.bar!.baz
was interpreted to be equivalent to the following JavaScript.
(foo?.bar).baz
In the above code the parentheses stop the “short-circuiting” behavior of optional chaining, so if foo is undefined, accessing baz will cause a runtime error.
The Babel team who pointed this behavior out, and most users who provided feedback to us, believe that this behavior is wrong. We do too! The thing we heard the most was that the ! operator should just “disappear” since the intent was to remove null and undefined from the type of bar.
In other words, most people felt that the original snippet should be interpreted as
foo?.bar.baz
which just evaluates to undefined when foo is undefined.
This is a breaking change, but we believe most code was written with the new interpretation in mind. Users who want to revert to the old behavior can add explicit parentheses around the left side of the ! operator.
(foo?.bar)!.baz
} and > are Now Invalid JSX Text CharactersThe JSX Specification forbids the use of the } and > characters in text positions. TypeScript and Babel have both decided to enforce this rule to be more comformant. The new way to insert these characters is to use an HTML escape code (e.g. <div> 2 > 1 </div>) or insert an expression with a string literal (e.g. <div> 2 {">"} 1 </div>).
Luckily, thanks to the pull request enforcing this from Brad Zacher, you’ll get an error message along the lines of
Unexpected token. Did you mean `{'>'}` or `>`?
Unexpected token. Did you mean `{'}'}` or `}`?
For example:
let directions = <div>Navigate to: Menu Bar > Tools > Options</div> // ~ ~ // Unexpected token. Did you mean `{'>'}` or `>`?
That error message came with a handy quick fix, and thanks to Alexander Tarasyuk, you can apply these changes in bulk if you have a lot of errors.
Generally, an intersection type like A & B is assignable to C if either A or B is assignable to C; however, sometimes that has problems with optional properties. For example, take the following:
interface A {
    a: number; // notice this is 'number'
}

interface B {
    b: string;
}

interface C {
    a?: boolean; // notice this is 'boolean'
    b: string;
}

declare let x: A & B;
declare let y: C;

y = x;
In previous versions of TypeScript, this was allowed because while A was totally incompatible with C, B was compatible with C.
In TypeScript 3.9, so long as every type in an intersection is a concrete object type, the type system will consider all of the properties at once. As a result, TypeScript will see that the a property of A & B is incompatible with that of C:
Type 'A & B' is not assignable to type 'C'.
  Types of property 'a' are incompatible.
    Type 'number' is not assignable to type 'boolean | undefined'.
For more information on this change, see the corresponding pull request.
There are a few cases where you might end up with types that describe values that just don’t exist. For example
declare function smushObjects<T, U>(x: T, y: U): T & U;

interface Circle {
    kind: "circle";
    radius: number;
}

interface Square {
    kind: "square";
    sideLength: number;
}

declare let x: Circle;
declare let y: Square;

let z = smushObjects(x, y);
console.log(z.kind);
This code is slightly weird because there’s really no way to create an intersection of a Circle and a Square – they have two incompatible kind fields. In previous versions of TypeScript, this code was allowed and the type of kind itself was never because "circle" & "square" described a set of values that could never exist.
In TypeScript 3.9, the type system is more aggressive here – it notices that it’s impossible to intersect Circle and Square because of their kind properties. So instead of collapsing the type of z.kind to never, it collapses the type of z itself (Circle & Square) to never. That means the above code now errors with:
Property 'kind' does not exist on type 'never'.
Most of the breaks we observed seem to correspond with slightly incorrect type declarations. For more details, see the original pull request.
In older versions of TypeScript, get and set accessors in classes were emitted in a way that made them enumerable; however, this wasn’t compliant with the ECMAScript specification which states that they must be non-enumerable. As a result, TypeScript code that targeted ES5 and ES2015 could differ in behavior.
Thanks to a pull request from GitHub user pathurs, TypeScript 3.9 now conforms more closely with ECMAScript in this regard.
any No Longer Act as anyIn previous versions of TypeScript, a type parameter constrained to any could be treated as any.
function foo<T extends any>(arg: T) {
    arg.spfjgerijghoied; // no error!
}
This was an oversight, so TypeScript 3.9 takes a more conservative approach and issues an error on these questionable operations.
function foo<T extends any>(arg: T) {
    arg.spfjgerijghoied;
    //  ~~~~~~~~~~~~~~~
    // Property 'spfjgerijghoied' does not exist on type 'T'.
}
export * is Always RetainedIn previous TypeScript versions, declarations like export * from "foo" would be dropped in our JavaScript output if foo didn’t export any values. This sort of emit is problematic because it’s type-directed and can’t be emulated by Babel. TypeScript 3.9 will always emit these export * declarations. In practice, we don’t expect this to break much existing code.
You can keep posted on the progress of the TypeScript 3.9 release on our official Iteration Plan. We’d love to get your feedback to make sure that TypeScript 3.9 ships smoothly and makes you more productive, so give it a shot and if you run into anything please feel free to file an issue on our issue tracker.
Happy Hacking!
– Daniel Rosenwasser and the TypeScript Team
The post Announcing TypeScript 3.9 Beta appeared first on TypeScript.
We are pleased to announce a new release of OData Connected Service, version 0.7.1. This version adds the following important features and bug fixes:
You can get the extension from the Visual Studio Marketplace.
You can now use OData Connected Service extension to generate OData client code for Visual Basic projects. The features supported in C# are also supported in VB.NET projects.
Let’s create a simple VB.NET project to demonstrate how it works. Open Visual Studio and create a VB .NET Core Console App.
When the new project is ready, right-click the project node from the Solution Explorer and then choose Add > Connected Service in the context menu that appears

In the Connected Services tab, select OData Connected Service.
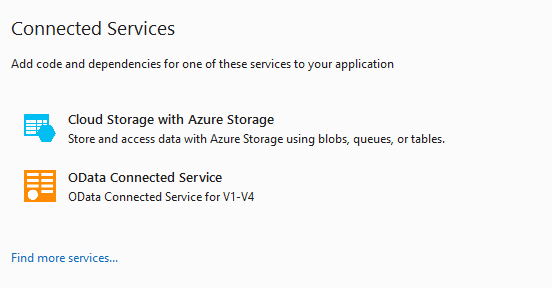
This loads the OData Connected Service configuration wizard. For this demo, we’ll keep things simple and stick to the default settings. For the service address, use the sample Trip Pin service endpoint: https://services.odata.org/v4/TripPinService
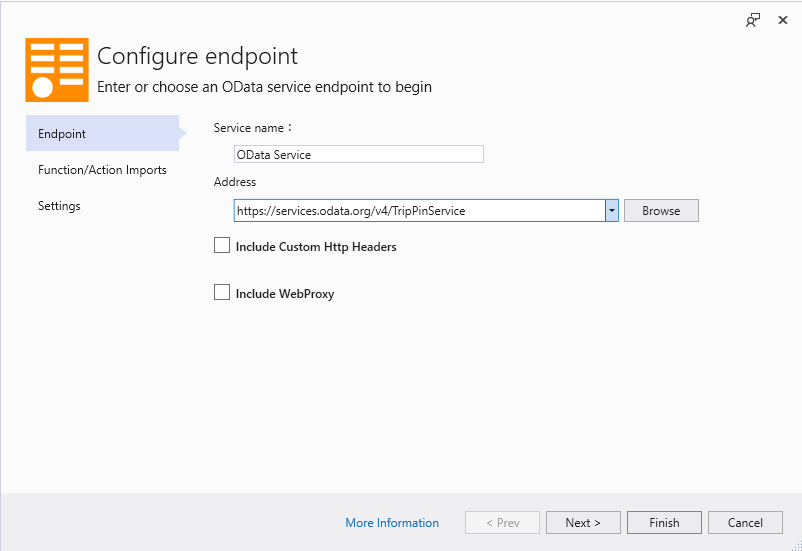
Click Finish to start the client code generation process. After the process is complete, a Connected Services node is added to your project together with a child node named “OData Service”. Inside the folder you should see the generated Reference.vb file.
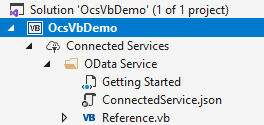
We’ll use the generated code to fetch a list of people from the service and display their names in the console.
Open the Program.vb file and replace its content with the following code:
Imports System
' this is the namespace that contains the generated code, based on the namespace defined in the service metadata
Imports OcsVbDemo.Microsoft.OData.SampleService.Models.TripPin

Module Program
Sub Main(args As String())
DisplayPeople().Wait()
End Sub

''' <summary>
''' Fetches and displayes a list of people from the OData service
''' </summary>
''' <returns></returns>
Async Function DisplayPeople() As Task
Dim container = New DefaultContainer(New Uri("https://services.odata.org/v4/TripPinService"))
Dim people = Await container.People.ExecuteAsync()

For Each person In people
Console.WriteLine(person.FirstName)
Next
End Function
End Module
The DefaultContainer is a generated class that inherits from DataServiceContext and gives us access to the resources exposed by the service. We create a Container instance using the URL of the service root. The container has a generated People property which we’ll use to execute a query against the People entity set on the OData service and then display the results.
Finally, let’s run the app. You should see a list of names displayed on the console:

This feature allows you to select the operations you want included in the generated code and exclude the ones you don’t want. This gives you more control and helps keep the generated code lean. There is more work being done in this area, and in an upcoming release, you will also have the option to exclude entity types that you don’t need.
This feature is available on the new Function/Action Imports page of the wizard.
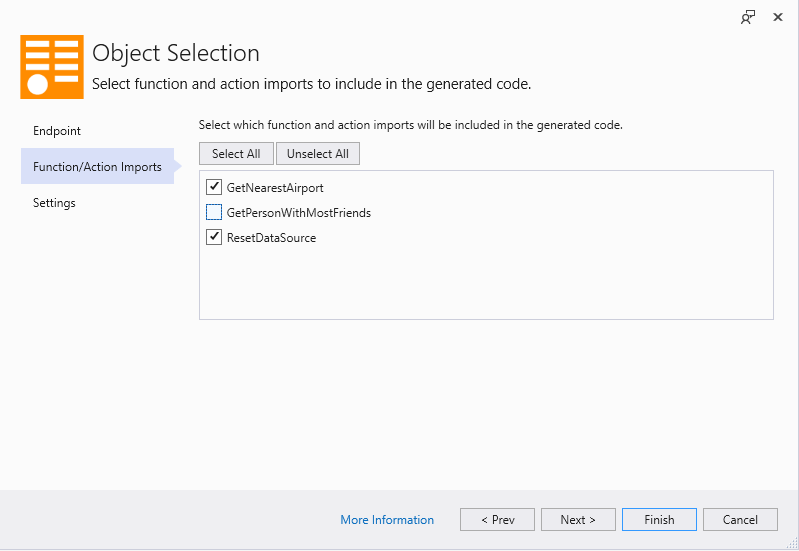
In the example above, GetNearestAirport and ResetDataSource will be generated, but GetPersonWithMostFriends will not.
Here are some important things to keep in mind regarding this feature:
Previously, when you used the connected service on a network that has a web proxy, the call to fetch service metadata would fail. To address this issue, we have provided a means for you to specify the web proxy configuration and credentials needed to access the network in such situations. These settings are not saved in the generated client, they are only used to fetch the metadata document during code generation. They are also not persisted or cached by default, meaning you would have to enter them each time you add or update a connected service.
You can specify the web proxy settings on the first page of the configuration wizard:
Stay tuned for the next release.
The post OData Connected Service 0.7.1 Release appeared first on OData.
Since last week’s update, the global health pandemic continues to impact every organization—large or small—their employees, and the customers they serve. Everyone is working tirelessly to support all our customers, especially critical health and safety organizations across the globe, with the cloud services needed to sustain their operations during this unprecedented time. Equally, we are hard at work providing services to support hundreds of millions of people who rely on Microsoft to stay connected and to work and play remotely.
As Satya Nadella shared, “It’s times like this that remind us that each of us has something to contribute and the importance of coming together as a community”. In these times of great societal disruption, we are steadfast in our commitment to help everyone get through this.
For this week’s update, we want to share common questions we’re hearing from customers and partners along with insights to address these important inquiries. If you have any immediate needs, please refer to the following resources.
Azure Service Health – for tracking any issues impacting customer workloads and understanding Azure Service Health
Microsoft 365 Service health and continuity – for tracking and understanding M365 Service health
Xbox Live – for tracking game and service status
What have you observed over the last week?
In response to health authorities emphasizing the importance of social distancing, we’ve seen usage increases in services that support these scenarios—including Microsoft Teams, Windows Virtual Desktop, and Power BI.
Have you made any changes to the prioritization criteria you outlined last week?
No. Our top priority remains support for critical health and safety organizations and ensuring remote workers stay up and running with the core functionality of Teams.
Specifically, we are providing the highest level of monitoring during this time for the following:
Given your prioritization criteria, how will this impact other Azure customers?
We’re implementing a few temporary restrictions designed to balance the best possible experience for all of our customers. We have placed limits on free offers to prioritize capacity for existing customers. We also have limits on certain resources for new subscriptions. These are ‘soft’ quota limits, and customers can raise support requests to increase these limits. If requests cannot be met immediately, we recommend customers use alternative regions (of our 54 live regions) that may have less demand surge. To manage surges in demand, we will expedite the creation of new capacity in the appropriate region.
Have there been any service disruptions?
Despite the significant increase in demand, we have not had any significant service disruptions. As a result of the surge in use over the last week, we have experienced significant demand in some regions (Europe North, Europe West, UK South, France Central, Asia East, India South, Brazil South) and are observing deployments for some compute resource types in these regions drop below our typical 99.99 percent success rates.
Although the majority of deployments still succeed, (so we encourage any customers experiencing allocation failures to retry deployments), we have a process in place to ensure that customers that encounter repeated issues receive relevant mitigation options. We treat these short-term allocation shortfalls as a service incident and we send targeted updates and mitigation guidance to impacted customers via Azure Service Health—as per our standard process for any known platform issues.
When these service incidents happen, how do you communicate to customers and partners?
We have standard operating procedures for how we manage both mitigation and communication. Impacted customers and partners are notified through the Service Health experience in the Azure portal and/or in the Microsoft 365 admin center.
What actions are you taking to prevent capacity constraints?
We are expediting the addition of significant new capacity that will be available in the weeks ahead. Concurrently, we monitor support requests and, if needed, encourage customers to consider alternative regions or alternative resource types, depending on their timeline and requirements. If the implementation of these efforts to alleviate demand is not sufficient, customers may experience intermittent deployment related issues. When this does happen, impacted customers will be informed via Azure Service Health.
Have you needed to make any changes to the Teams experience?
To best support our Teams customers worldwide and accommodate new growth and demand, we made a few temporary adjustments to select non-essential capabilities such as how often we check for user presence, the interval in which we show when the other party is typing, and video resolution. These adjustments do not have significant impact on our end users’ daily experiences.
Is Xbox Live putting a strain on overall Azure capacity?
We’re actively monitoring performance and usage trends to ensure we’re optimizing services for gamers worldwide. At the same time, we’re taking proactive steps to plan for high-usage periods, which includes taking prudent measures with our publishing partners to deliver higher-bandwidth activities like game updates during off-peak hours.
How does in-home broadband use impact service continuity and capacity? Any specific work being done with ISPs?
We’ve been in regular communication with ISPs across the globe and are actively working with them to augment capacity as needed. In particular, we’ve been in discussions with several ISPs that are taking measures to reduce bandwidth from video sources in order to enable their networks to be performant during the workday.
We’ll continue to provide regular updates on the Microsoft Azure blog.
In Server GC, each GC thread will work on its heap in parallel (that's a simplistic view and is not necessarily true for all phases but on the high level it's exact the idea of a parallel GC). So that alone means work is already split between GC threads. But because GC work for some stages can only proceed after all threads are done with their last stage (for example, we can’t have any GC thread start with the plan phase until all GC threads are done with the mark phase so we don’t miss objects that should be marked), we want the amount of GC work balanced on each thread as much as possible so the total pause can be shorter, otherwise if one thread is taking a long time to finish such a stage the other threads will waiting around not doing anything. There are various things we do in order to make the work more balanced. We will continue to do work like this to balance out more.
Balancing allocations
One way to balance the collection work is to balance the allocations. Of course even if you have the exact same amount of allocations per heap the amount of collection work can still be very different, depending on the survival. But it certainly helps. So we equalize the allocation budget at the end of a GC so each heap gets the same allocation budget. This doesn’t mean naturally each heap will get the same amount of allocations but it puts the same upper limit on the amount of allocations each heap can do before the next GC is triggered. The number of allocating threads and the amount of allocation each allocating thread does are of course up to user code. We try to make the allocations on the heap associated with the core that the allocating thread runs on but since we have no control, we need to check if we should balance to other heaps that are the least full and balance to them when appropriate. The “when appreciate” requires some careful tuning heuristics. Currently we take into consideration the core the thread is running on, the NUMA node it runs on, how much allocation budget it has left compared to other heaps and how many allocating threads have been running on the same core. I do think this is a bit unnecessarily complicated so we are doing more work to see if we could simply this.
If we use the GCHeapCount config to specify fewer heaps than cores, it means there will only be that many GC threads and by default they would only run on that many cores. Of course the user threads are free to run on the rest of the cores and the allocations they do will be balanced onto the GC heaps.
Balancing GC work
Most of the current balancing done in GC is focused on marking, simply because marking is usually the phase that takes the longest. If you are going to pick tasks to balance, it makes more sense to balance the longest part that is most prone to being unbalanced – balancing work does not come without a cost.
Marking uses a mark stack which makes it a natural target for working stealing. When a GC thread is done with its own marking, it looks around to see if other threads’ mark stacks are still busy and if so, steal an object to mark. This is complicated by the fact that we implement “partial mark”, which means if an object contains many references we only push a chunk of them onto the mark stack at a time to not overflow the stack. This means the entries on the stack may not be straightforward object addresses. Stealing needs to recognize specific sequences to determine whether it should search for other entries or read the right entry in that sequence to steal. Note that this is only turned on during full blocking GCs as the stealing does have noticeable cost in certain situations.
Performance work is largely driven by user scenarios. And as our framework is used more and more by high performance scenarios we are always doing work to shorten the pause time. Folks have asked about concurrent compacting GCs and yes, we do have that on our roadmap. But it does not mean we will stop improving our current GC. One of the things we noticed from looking at customer data is when we are doing an ephemeral GC, marking young gen objects pointed to by objects in older generations usually takes the longest time. Recently we implemented working stealing for this in 5.0 by having each GC thread takes a chunk of the older generation to process each time. It atomically increases the chunk index so if another thread is also looking at the same generation it will take the next chunk that hasn’t been taken. The complication here is we might have multiple segments so we need to keep track of the current segment being processed (and its starting index). In the situation when one thread just gets to a segment which has already been processed by other threads, it knows to advance past this segment. Each chunk is guaranteed to only been processed by one thread. Because of this guarantee and the fact relocating pointers to young gen objects shares the same code path, it means this relocation work is also balanced in the same fashion.
We also do balancing work at the end of the phase so it can balance the imbalance in earlier work happening in the same phase.
There are other kinds of balancing but those are the main ones. More kinds of work can be balanced for STW GCs. We chose to focus more on the mark phase because it's most needed. We have not balanced the concurrent work just because it’s more forgiving when you run concurrently. Clearly there’s merit in balancing that too so it’s a matter of getting to it.
Future work
As I mentioned, we are continuing the journey to make things more balanced. Aside from balancing the current tasks more, we are also changing how heaps are organized to make balancing more natural (so the threads aren’t so tightly coupled with heaps). That’s for another blog post.
The post Balancing work on GC threads appeared first on .NET Blog.
I’m following up with a post answering some of the top related questions we’ve heard from customers around the globe.
The post Update #2 on Microsoft cloud services continuity appeared first on Microsoft 365 Blog.