Quantcast
Channel: Category Name
Viewing all 5971 articles
Browse latest View live

Updates to synchronous autoload of extensions in Visual Studio 2019

$
0
0

Since announcing that Visual Studio 2019 v16.1 will block any extension from synchronously autoloading, we’ve seen a tremendous effort of both 1st and 3rd-party extensions to implement async background load. It’s been truly amazing to see the community of extension authors stepping up to the task. Many even did it long before we announced Visual Studio 2019.

The result is faster startup and solution load times for Visual Studio, as well as fewer UI delays cause by blocking operations on the main thread. So, a big THANK YOU to all extension authors for all the hard work to make this happen.

Control the behavior

By default, Visual Studio 2019 v16.1 blocks any synchronously autoloaded package from any extension and shows a notification to alert the user about it.

Yellow bar notification

What’s new is that the individual user can now control how they would like the extension to load. The reason for this change is two-fold.

First, most extensions now support async background loading, which improves startup and solution load performance across the board. Second, there exist a class of extensions developed and used internally in companies around the world that for various reasons cannot support async background load. It’s usually because they no longer have the source code or the person who originally built the extension is no longer working at the company.

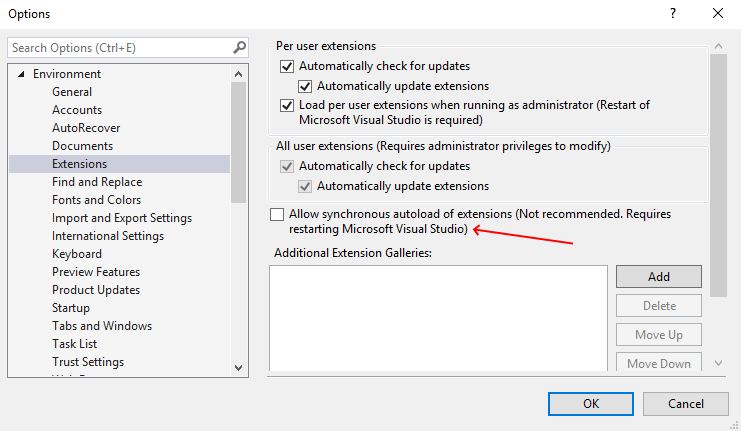
To stop blocking synchronously autoloaded extensions, you can either click the Allow synchronous autoload on the yellow notification bar or check a new checkbox in the options dialog.

Extensions options

It’s important to stress that we really don’t recommend to anyone that they allow synchronous autoload, but we recognize the need to be able to unblock users and teams to do their job. Even when we know it leads to degraded performance of Visual Studio.

Group policy

To set this option for all team members, the IT admin can now set a registry key through Group Policy. When the Group Policy is set, it takes precedence over the individual user’s ability to change the option themselves, and the checkbox is greyed out and disabled.

Marketplace updates

Extension authors must still use AsyncPackage and enable background load. An update to the Marketplace shows errors when uploading any extension supporting Visual Studio 2019 that uses synchronous autoload. This update is in place since no extension can make assumptions about the users allowing synchronously autoloaded extensions.

Simply put

Here’s a bullet list to sum it up:

  • Marketplace requires autoload to be async and in the background
  • Users and IT admins can opt out of the blocking behavior (not recommended)
  • Autoloading extension should always happen asynchronously in the background

Again, thank you so much for your efforts to make Visual Studio perform better to the benefit of all users. We appreciate the hard work and understand that on many cases it took a considerable amount of work to make this happen. You have our sincerest respect and admiration.

The post Updates to synchronous autoload of extensions in Visual Studio 2019 appeared first on The Visual Studio Blog.


Introducing the first Microsoft Edge preview builds for macOS

$
0
0

Last month, we announced the first preview builds of the next version of Microsoft Edge for Windows 10. Today, we are pleased to announce the availability of the Microsoft Edge Canary channel for macOS. You can now install preview builds from the Microsoft Edge Insider site for your macOS or Windows 10 PC, with more Windows version support coming soon.

Building a “Mac-like” user experience for Microsoft Edge

Microsoft Edge for macOS will offer the same new browsing experience that we’re previewing on Windows, with user experience optimizations to make it feel at home on a Mac. We are tailoring the overall look and feel to match what macOS users expect from apps on this platform.

Screen capture showing Microsoft Edge running on macOS.

We are committed to building a world class browser with Microsoft Edge through differentiated user experience features and connected services. With this initial release, we have made several changes to the user interface to align with the Microsoft design language whilst making it feel natural on macOS.

Examples of this include a number of tweaks to match macOS conventions for fonts, menus, keyboard shortcuts, title casing, and other areas. You will continue to see the look and feel of the browser evolve in future releases as we continue to experiment, iterate and listen to customer feedback.  We encourage you to share your feedback with us using the “Send feedback” smiley.

Screen capture showing the "Send feedback" dialog in Microsoft Edge

Additionally, we are designing user experiences that are exclusive to macOS, by leveraging specific hardware features available on Mac. For example, providing useful and contextual actions through the Touch Bar like website shortcuts, tab switching and video controls, as well as enabling familiar navigation with trackpad gestures.

Animation showing Touch Bar integrations in Microsoft Edge 

Introducing the Microsoft Edge Insider Channels for macOS

The new Microsoft Edge preview builds for macOS are available through preview channels that we call “Microsoft Edge Insider Channels.” We are starting by launching the Microsoft Edge Insider Canary Channel, which you can download and try at the Microsoft Edge Insider site. This channel is available starting today on macOS 10.12 and above. The Dev Channel will be released very soon, and once available, you’ll be able to download and install it side-by-side with the Canary Channel. You can learn more about our approach and what to expect from the different channels in our blog post from last month.

Screen capture of microsoftedgeinsider.com showing the three Insider Channels

A consistent platform and tools for web developers

With our new Chromium foundation, you can expect a consistent rendering experience across the Windows and macOS versions of Microsoft Edge, as well as the same powerful developer tools you’ll find on Windows.

For the first time, web developers can now test sites and web apps in Microsoft Edge on macOS and be confident that those experiences will work the same in the next version of Microsoft Edge across all platforms. (Note that platform-specific capabilities, like PlayReady content decryption on Windows 10, should continue to be feature detected for the best experience on those platforms.)

As with our Windows preview builds, our new macOS version also includes support for installable, standards-based Progressive Web Apps which you can inspect and debug using the browser developer tools. We’re working to make PWAs feel at home alongside your native apps, so when installed they will appear in your Dock, app switcher, and Spotlight just like a native app.

Sharing your feedback

We’re delighted to share our first Microsoft Edge Canary build for macOS with you!  Getting your feedback is an important step in helping us make a better browser – we consider it essential to create the best possible browsing experience on macOS. We hope you’ll try the preview today, and we look forward to your feedback and participation in the Microsoft Edge Insider community.

If you encounter any issues, and to give feedback or share suggestions with the team, head over to the Microsoft Edge Insider community forums, get in touch with us on Twitter, or just use the “Send feedback” option in the Microsoft Edge menu to let us know what you think.

For web developers, if you encounter an issue that reproduces in Chromium, it’s best to file a Chromium bug. For problems in the existing version of Microsoft Edge, please continue to use the EdgeHTML Issue Tracker.

We look forward to hearing from you!

– The Microsoft Edge Team

The post Introducing the first Microsoft Edge preview builds for macOS appeared first on Microsoft Edge Blog.

The F# development home on GitHub is now dotnet/fsharp

$
0
0

TL;DR We’ve moved the F# GitHub repository from microsoft/visualfsharp to dotnet/fsharp, as specified in the corresponding RFC.

F# has a somewhat strange history in its name and brand. If we roll back the clocks to the year 2015, F# sort of had two identities. One side of this was Visual F#, or “VisualFSharp”; a product within Visual Studio comprised of a compiler and tooling that you could use on Windows. The other side was F#, or “FSharp”; an independent language with a roaring community that built F# tools, a library ecosystem, and multiple packagings of F# independently of Microsoft.

Although this duality about F#’s identity was quite stark, it was also confusing. If you used the term “F#”, what exactly did you mean? Stuff that Microsoft built? Or something else? So, Don Syme (creator of F#) penned a framing in his blog post, An open letter about the terms “F#” and “Visual F#”. This distinction was simple: if you’re using F# from Microsoft (i.e., on Windows via Visual Studio), it’s called Visual F#; otherwise, it’s called F#! Simple, right? As you might have guessed, things got more complicated over the years…

While this split in terminology was arguably needed in 2015, it became more confusing over time. For one, there’s not really anything “Visual” about F# in the tradition of the “Visual” moniker for Visual Studio tools. It never had support for visual designers, and there are no current plans to build designer support for building Windows apps. F# is also not a visual programming language, nor is there any dialect of F# that is a visual programming language (to my knowledge). And with the advent of .NET Core, F# is now officially built and packaged by Microsoft in a way that is orthogonal to Visual Studio and Windows. It has long been a request from the F# community that Microsoft take non-Windows and non-Visual Studio packagings of F# seriously. Many F# users use .NET Core on macOS or Linux, using Ionide with Visual Studio Code, Vim, or Emacs as their primary editor!

Over time, .NET Core has become central to the future of F# and the entire .NET platform. For example, F# 4.5 released with a sizeable feature area (Span<'T> and friends), which is a .NET Core technology. F# is also installed by default in Visual Studio due to being installed as a part of the .NET Core SDK. Much of the F# community has embraced .NET Core, porting existing libraries and creating new ones for consumption on .NET Core. It’s become clear to us that much of the F# community’s center of gravity involves .NET Core (and .NET Standard), including F# targeting JavaScript (via Fable ) and F# targeting Web Assembly (via Bolero) that have emerged independently of Microsoft. This is quite a different world than 2015!

Additionally, .NET has grown beyond the umbrella of Visual Studio and Windows. The .NET Foundation is an independent, 501(c)(6) nonprofit organization that houses many projects; including the C# and VB compilers and tools, the .NET Core runtime and libraries, and many independent open source projects that have no affiliation with Microsoft. I’ve personally noticed an uptick in OSS .NET activity, and the general .NET community’s acceptance of OSS components solving problems differently from Microsoft solutions seems to have also increased. F# has always had an independent nature to it, and a similar characteristic has developed in .NET itself.

As all of this has transpired, a distinction about F# based on the “Visual” moniker and Windows/Visual Studio has made less sense over time. To that end, we’ve taken some steps to help clear things up:

  • Branding F# as “an open-source, cross-platform functional programming language for .NET”
  • Referring to assets we produce as “F# language”, “F# compiler and core library”, and “F# tools” in Visual Studio release notes, with all community attributions in line
  • Tracking the supported F# version in .NET Core downloads independently of Visual Studio

The next step has been to rename the GitHub repository where F# is developed from microsoft/visualfsharp to dotnet/fsharp as-specified in the corresponding RFC. We feel that this aligns well with the current state of affairs.

Cheers, and happy hacking!

The post The F# development home on GitHub is now dotnet/fsharp appeared first on .NET Blog.

Code Reviews Using the Visual Studio Pull Requests Extension

$
0
0

The Pull Requests for Visual Studio is a new experimental extension that adds several code review tools to Visual Studio. This extension aims to make it easy for you to launch and view pull requests inside the integrated development environment (IDE) without needing to switch windows or use the web. We learned from customers that having a high-quality code review process is very important to increase productivity. To achieve that, this extension is enabling you to use existing and new Visual Studio code navigation, debugging and sharing capabilities in your code review process.

As of today, Pull Requests for Visual Studio only supports Azure DevOps and is available for you to download on the Marketplace. For those looking for GitHub pull request support, consider using the GitHub extension for Visual Studio.

This blog will focus on the basics of creating and reviewing a pull request, including:

  • Creating new pull requests
  • Reviewing pull requests
  • Providing expressive comments using markdown, emojis, and likes
  • Comparing code differences for over-the-shoulder and self-code review

With this extension you can also:

  • Review and checkout Pull Requests from Azure Repos
  • Get an inline peek to see more details about methods used in the code
  • View previous updates and understand how collaboration and discussion evolved over the course of the pull request

To learn more about this extension, please feel free to watch the following online demo, which talks about building the award winning app, Seeing AI, with Visual Studio 2019.


Creating a New Pull Request

After installing the pull requests extension and connecting to your Git repository on Azure DevOps, you can create a new pull request when pushing your branch to remote by clicking on create a pull request and filling the new pull request form.

Creating a pull request right after pushing your branch


You can also create pull requests using the pull requests page by navigating to Team Explorer > Home > Pull Requests and selecting New Pull Request.

Creating a pull request using the pull requests page


When you have local commits that have not been pushed to remote, the pull request extension reminds you to share your changes with remote before creating a new pull request. The Build & Code Analysis Results section will automatically expand and let you know about any failing unit tests, errors, and warnings. (Compatible only with C++, C#, and VB)

Un pushed changes warning + Build & Code Analysis Results


Reviewing Pull Requests

The pull requests page provides a summary of pull requests created by you and pull requests that have been assigned to you. You can do a brief review by opening the pull request, reviewing the changes that were made, and leaving comments or approving the pull request as shown below. To do a detailed review and be able to run and debug the pull request locally, you can use the Check out option.

Pull requests page


The pull requests details page is a focused screen that provides the pull request description and the discussion that the team is having. It also provides access to the code changes introduced by the pull request where you can add and view previous comments added by the team.

Reviewing the changes introduced by the pull request


You can add your comments by right clicking on the line of code that you would like to comment on and selecting Add Comment. Markdown and emojis are supported and you can use the preview option to view your comment before creating it. You can also reference bugs, team members, and other context that you might want to bring into your comment. Comments can also be marked as resolved which sends notification to their authors.

Comments and social coding


Reviewing Your Own Work

The Pull Requests extension for Visual Studio comes with a unique code diff tool that allows you to review your own work any time you want before creating a pull request. This allows you to see a history of changes as you code, which can be helpful when you are conducting over-the-shoulder code review and want to focus on the introduced code changes. To turn on code diff click on the Comparisons button on the tool bar.

Code diff (comparison)


With the Pull Requests extension, we now have integrated pull requests and code reviews inside of Visual Studio.


We Need Your Feedback!

We continue to value your feedback. As always, let us know of any issues you run into by using the Report a Problem tool in Visual Studio. You can also head over to Visual Studio Developer Community to track your issues, suggest a feature, ask questions, and find answers from others. We use your feedback to continue to improve Visual Studio 2019, so thank you again on behalf of our entire team.


Install the Pull Requests extension & give us feedback!

The post Code Reviews Using the Visual Studio Pull Requests Extension appeared first on The Visual Studio Blog.

Drive higher utilization of Azure HDInsight clusters with Autoscale

$
0
0

We are excited to share the preview release of the Autoscale feature for Azure HDInsight. This feature enables enterprises to become more productive and cost-efficient by automatically scaling clusters up or down based on the load or a customized schedule. 

Let’s consider the scenario of a U.S. based health provider who is using Azure HDInsight to build a unified big data platform at corporate level to process various data for trend prediction or usage pattern analysis. To achieve their business goals, they operate multiple HDInsight clusters in production for real-time data ingestion, batch and interactive analysis.

Some clusters are customized to exact requirements, such as ISV/line of business applications and access control policies, which are subject to rigorous SLA requirements. Sizing such clusters is a hard problem by itself and operating them 24/7 at peak capacity is expensive. So once the clusters are created, IT admins either need to manually monitor the dynamic capacity requirements, scale the clusters up and down, or develop custom tools to do the same. These challenges prevent IT admins from being as productive as possible when building and operating cost-efficient big data analytics workloads.

With the new cluster Autoscaling feature, IT admins can have the Azure HDInsight service automatically monitor and scale the cluster up or down between a admin specified minimum and maximum number of nodes based on either actual load on the cluster or a customized schedule. IT admins can flexibly adjust the cluster size range or the schedule as the unique requirements of their workloads change. The Autoscale feature releases IT admins from having to build complex monitoring tools or worrying about wasted resources and high costs.

Benefits

Automatically make scaling decisions

Once Autoscale is enabled, you can rest assured that the service will take care of your cluster size.

  • In the load based mode: The cluster size will be scaled up exactly to how much more resources is needed by your applications, but never goes beyond the maximum number you set. Similarly, the cluster size will be scaled down to the minimum to meet your current resource requirements, but never goes below the minimum number of worker nodes you set.
  • In the schedule based mode: Cluster size will be scaled up and down based on the predefined schedule.  

All the above benefits release IT admins from worrying about wasted resources and allow enterprise to be cost effective and productive.

Pay for only what you need

Autoscale helps you achieve the balance between performance and cost efficiency. Scaling up the cluster lets you derive the business insight you need on time while scaling down the cluster removes the excess resources. Ultimately, Autoscale leads to higher utilization enabling you to pay for only what you need.

Customize to your own scenario

HDInsight Autoscale allows you to customize the scaling strategy based on your own scenario. In the load based mode, you can define the maximum and minimum based on your cost requirements. In the schedule based mode, you can define a schedule for each weekday to meet your own business objectives.

Monitor scaling history easily

The Autoscale feature gives you full visibility in to how the cluster has been scaled up or down. This enables you to further optimize the Autoscale configuration for higher utilization and workload performance.

Using the Azure portal, you can zoom in and out to check the cluster size over the past 90 days.

All the scaling events are also available in Azure Log Analytics. You can run queries to get all the details including when the scaling operation took place, how much resources were needed and how many worker nodes it scaled to. 

Get started

New SharePoint home sites headline Microsoft 365 innovations for the intelligent workplace

Announcing Azure DevOps Server 2019.0.1 RTW

$
0
0

Today, we are releasing Azure DevOps Server 2019.0.1 RTW. Azure DevOps Server (formerly Team Foundation Server) brings the Azure DevOps experience to self-hosted environments. Customers with strict requirements for compliance can run Azure DevOps Server on-premises and have full control over the underlying infrastructure.

This release includes bug fixes for Azure DevOps Server 2019 and rolls up the security patches that have been released for Azure DevOps Server 2019. You can find the details of the fixes in our release notes. You can upgrade to Azure DevOps Server 2019.0.1 from Azure DevOps Server 2019 or Team Foundation Server 2012 or later. You can also install Azure DevOps Server 2019.0.1 without first installing Azure DevOps Server 2019.

Here are some key links:

Please provide any feedback at Developer Community.

The post Announcing Azure DevOps Server 2019.0.1 RTW appeared first on Azure DevOps Blog.

Who put Python in the Windows 10 May 2019 Update?

$
0
0

Today the Windows team announced the May 2019 Update for Windows 10. In this post we’re going to look at what we, the Python team, have done to make Python easier to install on Windows by helping the community publish to the Microsoft Store and, in collaboration with Windows, adding a default “python.exe” command to help find it. You may have already heard about these on the Python Bytes podcast, at PyCon US, or through Twitter.

As software moves from the PC to the cloud, the browser, and the Internet of Things, development workflows are changing. While Visual Studio remains a great starting point for any workload on Windows, many developers now prefer to acquire tools individually and on-demand.

For other operating systems, the platform-endorsed package manager is the traditional place to find individual tools that have been customized, reviewed, and tested for your system. On Windows we are exploring ways to provide a similar experience for developers without impacting non-developer users or infringing publishers’ ability to manage their own releases. The Windows Subsystem for Linux is one approach, offering developers consistency between their build and deployment environments. But there are other developer tools that also matter.

One such tool is Python. Microsoft has been involved with the Python community for over twelve years, and currently employ four of the key contributors to the language and primary runtime. The growth of Python has been incredible, as it finds homes among data scientists, web developers, system administrators, and students, and roughly half of this work is already happening on Windows. And yet, Python developers on Windows find themselves facing more friction than on other platforms.

Installing Python on Windows

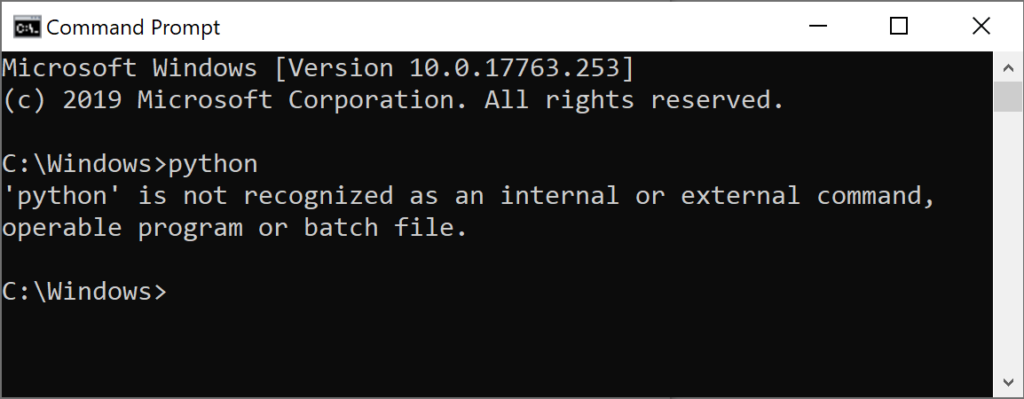
The Windows command prompt showing an error when Python cannot be foundIt’s been widely known for many years that Windows is the only mainstream operating system that does not include a Python interpreter out of the box. For many users who are never going to need it, this helps reduce the size and improve the security of the operating system. But for those of us who do need it, Python’s absence has been keenly felt.

Once you discover that you need to get Python, you are quickly faced with many choices. Will you download an installer from python.org? Or perhaps a distribution such as Anaconda? The Visual Studio installer is also an option. And which version? How will you access it after it’s been installed? You quickly find more answers than you need, and depending on your situation, any of them might be correct.

We spent time figuring out why someone would hit the error above and what help they need. If you’re already a Python expert with complex needs, you probably know how to install and use it. It’s much more likely that someone will hit this problem the first time they are trying to use Python. Many of the teachers we spoke to confirmed this hypothesis – students encounter this far more often than experienced developers.

So we made things easier.

The header of the Python 3.7 page in the Microsoft Store

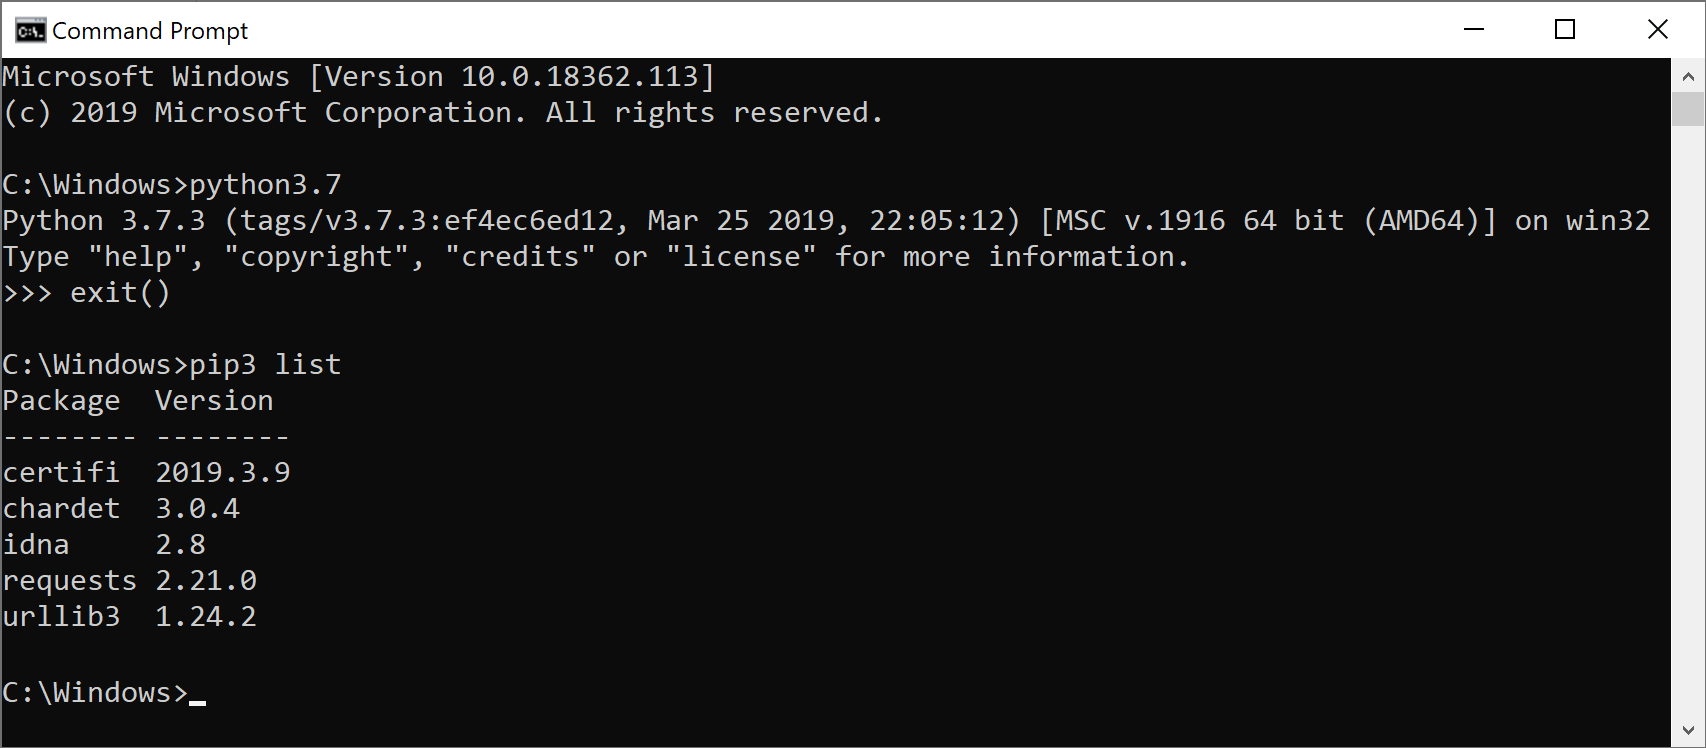
First, we helped the community release their distribution of Python to the Microsoft Store. This version of Python is fully maintained by the community, installs easily on Windows 10, and automatically makes common commands such as python, pip and idle available (as well as equivalents with version numbers python3 and python3.7, for all the commands, just like on Linux).

The Windows command prompt showing that "python3.7" now launches Python and "pip3" launches pip

Finally, with the May 2019 Windows Update, we are completing the picture. While Python continues to remain completely independent from the operating system, every install of Windows will include python and python3 commands that take you directly to the Python store page. We believe that the Microsoft Store package is perfect for users starting out with Python, and given our experience with and participation in the Python community we are pleased to endorse it as the default choice.

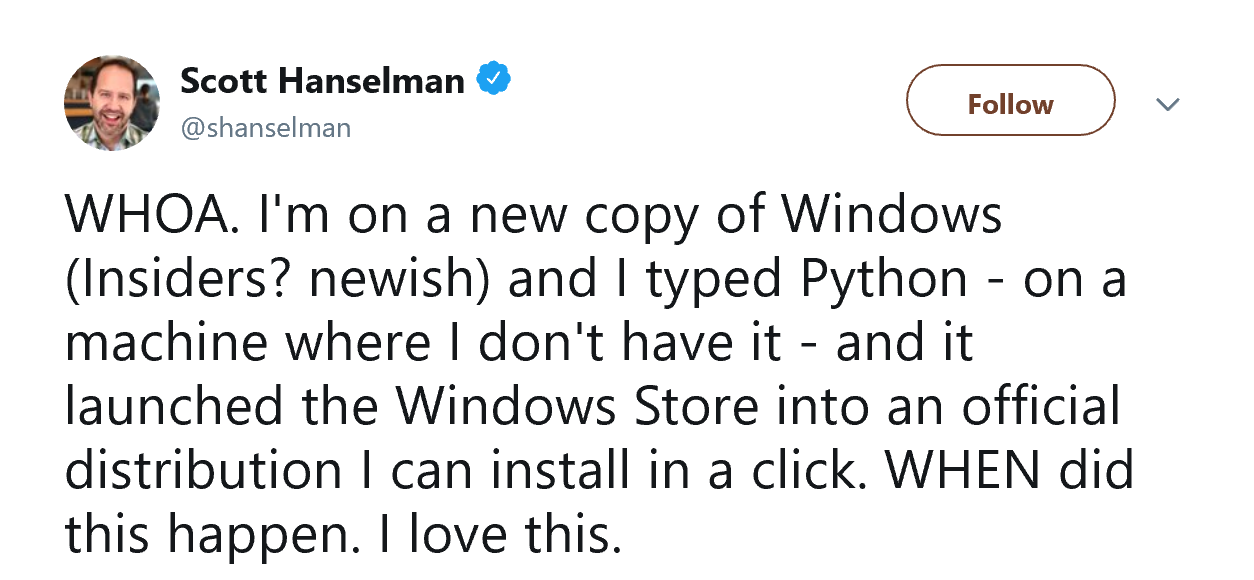
Scott Hanselman on Twitter: "WHOA. I'm on a new copy of Windows and I typed Python - on a machine where I don't have it - and it launched the Windows Store into an official distribution I can install in a click. WHEN did this happen. I love this."We hope everyone will be as excited as Scott Hanselman was when he discovered it. Over time, we plan to extend similar integration to other developer tools and reduce the getting started friction. We’d love to hear your thoughts, and suggestions, so feel free to post comments here or use the Windows Feedback app.


The post Who put Python in the Windows 10 May 2019 Update? appeared first on Python.


bingbot Series: Easy set-up guide for Bing’s Adaptive URL submission API

$
0
0

In February, we announced launch of adaptive URL submission capability. As called out during the launch, as SEO manager or website owner, you do not need to wait for the crawler to discover new links, you should just submit those links automatically to Bing to get your content immediately indexed as soon as your content is published!  Who in SEO didn’t dream of that. 

In the last few months we have seen rapid adoption of this capability with thousands of websites submitting millions of URLs and getting them indexed on Bing instantly.  

At the same time, we have few webmasters who have asked for guidance on integrating the adaptive URL submission API. This blog provides information on how easy it is to set-up the adaptive URL submission API.  

Step 1: Generate an API Key  


Webmasters need an API key to be able to access and use Bing Webmaster APIs. This API key can be generated from Bing Webmaster Tools by following these steps:  

  1. Sign in to your account on Bing Webmaster Tools. In case you do not already have a Bing Webmaster account, sign up today using any Microsoft, Google or Facebook ID. 

  1. Add & verify the site that you want to submit URL for through the API, if not already done. 

  1. Select and open any verified site through the My Sites page on Bing Webmaster Tools and click on Webmaster API on the left-hand side navigation menu. 


  1. If you are generating the API key for the first time, please click Generate to create an API Key.  


Else you will see the key previously generated. 
Note: Only one API key can be generated per user. You can change your API key anytime; change is taken by the system within 30 minutes.

Step 2: Integrate with your website 


You can any of the below protocols to easily integrate the Submit URL API into your system.  

  • JSON request sample 

    POST /webmaster/api.svc/json/SubmitUrl?
    apikey=sampleapikeyEDECC1EA4AE341CC8B6 HTTP/1.1
    Content-Type: application/json; charset=utf-8
    Host: ssl.bing.com
    
    {
    "siteUrl":"http://example.com",
    "url":"http://example.com/url1.html"
    } 
  • XML Request sample 

    POST /webmaster/api.svc/pox/SubmitUrl?apikey=sampleapikey341CC57365E075EBC8B6 HTTP/1.1 
    Content-Type: application/xml; charset=utf-8 
    Host: ssl.bing.com  
    
    <SubmitUrl xmlns="http://schemas.datacontract.org/2004/07/Microsoft.Bing.Webmaster.Api">
    <siteUrl>http://example.com</siteUrl> 
    <url>http://example.com/url1.html</url> 
    </SubmitUrl> 

If the URL submission is successful you will receive an http 200 response. This ensures that your pages will be discovered for indexing and if Bing webmaster guidelines are met then the pages will be crawled and indexed in real time.

Using any of the above methods you should be able to directly and automatically let Bing know whenever new links are created in your website. We encourage you to integrate such solution in your Web Content Management System to let Bing auto discover your new content at publication time. 

In case you face any challenges during the integration, you can reach out bwtsupport@microsoft.com to raise a service ticket. Feel free to contact us if your web site requires more than 10,000 URLs submitted per day. We will adjust as needed. 

Thanks! 
Bing Webmaster Tools team

Visual Studio Code Remote Development may change everything

$
0
0

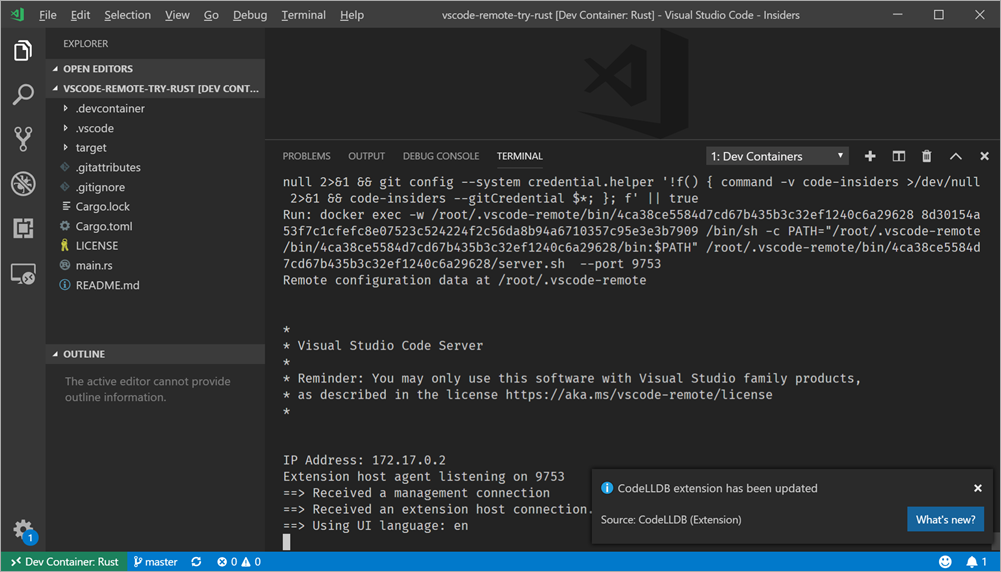
DevContainer using RustOK, that's a little clickbaity but it's surely impressed the heck out of me. You can read more about VS Code Remote Development (at the time of this writing, available in the VS Code Insiders builds) but here's a little on my first experience with it.

The Remote Development extensions require Visual Studio Code Insiders.

Visual Studio Code Remote Development allows you to use a container, remote machine, or the Windows Subsystem for Linux (WSL) as a full-featured development environment. It effectively splits VS Code in half and runs the client part on your machine and the "VS Code Server" basically anywhere else. The Remote Development extension pack includes three extensions. See the following articles to get started with each of them:

  • Remote - SSH - Connect to any location by opening folders on a remote machine/VM using SSH.
  • Remote - Containers - Work with a sandboxed toolchain or container-based application inside (or mounted into) a container.
  • Remote - WSL - Get a Linux-powered development experience in the Windows Subsystem for Linux.

Lemme give a concrete example. Let's say I want to do some work in any of these languages, except I don't have ANY of these languages/SDKS/tools on my machine.

Aside: You might, at this point, have already decided that I'm overreacting and this post is nonsense. Here's the thing though when it comes to remote development. Hang in there.

On the Windows side, lots of folks creating Windows VMs in someone's cloud and then they RDP (Remote Desktop) into that machine and push pixels around, letting the VM do all the work while you remote the screen. On the Linux side, lots of folks create Linux VMs or containers and then SSH into them with their favorite terminal, run vim and tmux or whatever, and then they push text around, letting the VM do all the work while you remote the screen. In both these scenarios you're not really client/server, you're terminal/server or thin client/server. VS Code is a thick client with clean, clear interfaces to language services that have location transparency.

I type some code, maybe an object instance, then intellisense is invoked with a press of "." - who does that work? Where does that list come from? If you're running code locally AND in the container, then you need to make sure both sides are in sync, same SDKs, etc. It's challenging.

OK, I don't have the Rust language or toolkit on my machine.

I'll clone this repository:

git clone https://github.com/Microsoft/vscode-remote-try-rust

Then I'll run Code, the Insiders version:

C:github> git clone https://github.com/Microsoft/vscode-remote-try-rust   

Cloning into 'vscode-remote-try-rust'...
Unpacking objects: 100% (38/38), done.
C:github> cd .vscode-remote-try-rust
C:githubvscode-remote-try-rust [main =]> code-insiders .

Then VS Code says, hey, this is a Dev Container, want me to open it?

There's a devcontainer.json file that has a list of extensions that the project needs. And it will install those VS Extensions inside a Development Docker Container and then access them remotely. This isn't a list of extensions that your LOCAL system needs - you don't want to sully your system with 100 extensions. You want to have just those extensions that you need for the project you're working on it. Compartmentalization. You could do development and never install anything on your local machine, but you're finding a sweet spot that doesn't involved pushing text or pixels around.

Reopen in Container

Now look at this screenshot and absorb. It's setting up a dockerfile, sure, with the development tools you want to use and then it runs docker exec and brings in the VS Code Server!

image

Check out the Extensions section of VS Code, and check out the lower left corner. That green status bar shows that we're in a client/server situation. The extensions specific to Rust are installed in the Dev Container and we are using them from VS Code.

Extensions

When I'm typing and working on my code in this way (by the way it took just minutes to get started) I've got a full experience with Intellisense, Debugging, etc.

Intellisense from a container running Rust and VS Code Remote Containers

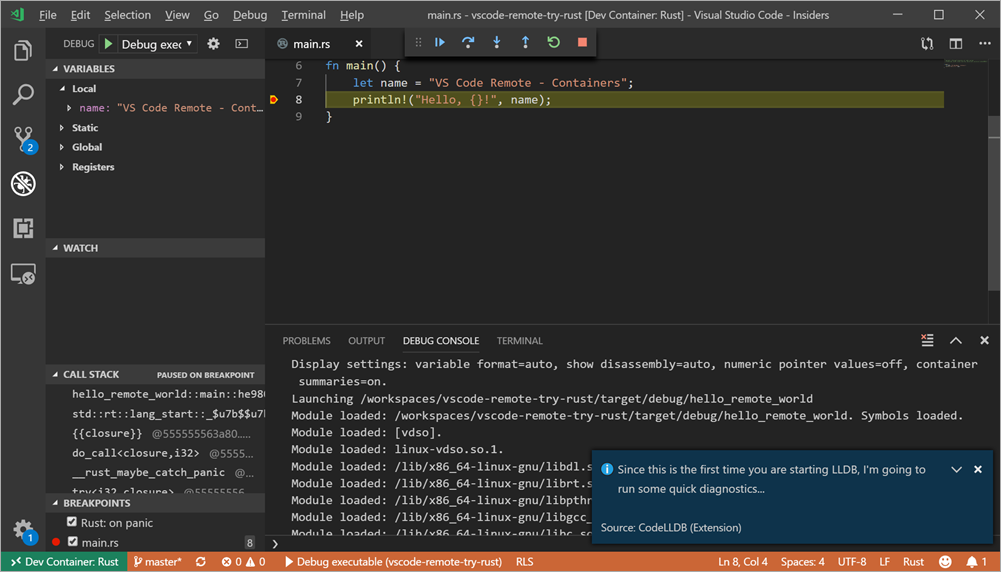
Here I am doing a live debug session of a Rust app with zero setup other than VS Code Insiders, the Remote Extensions, and Docker (which I already had).

Debugging in VS Code a Rust app within a DevContainer

As I mentioned, you can run within WSL, Containers, or over SSH. It's early days but it's extraordinarily clean. I'm really looking forward to seeing how far and effortless this style of development can go. There's so much less yak shaving! It effectively removes the whole setup part of your coding experience and you get right to it.


Sponsor: Manage GitHub Pull Requests right from the IDE with the latest JetBrains Rider. An integrated performance profiler on Windows comes to the rescue as well.


© 2018 Scott Hanselman. All rights reserved.
     

Securing the pharmaceutical supply chain with Azure IoT

$
0
0

You’re responsible for overseeing the transportation of a pallet of medicine halfway around the world. Drugs will travel from your pharmaceutical company’s manufacturing outbound warehouse in central New Jersey to third-party logistics firms, distributors, pharmacies, and ultimately, patients. Each box in that pallet – no bigger than the box that holds the business cards on your desk – contains very costly medicine, the product of 10 years of research and R&D spending.

Oh, and there’s a catch – actually several. You will need to ensure compliance with a long list of requirements from temperature and vibration to whether the box has been opened. The box must be kept at a stable temperature of between 2-8 degrees Celsius the whole journey. Additionally, the box is as vulnerable to shock as a Faberge egg. And the contents of each box can easily be faked. And another catch: your company isn’t in the global logistics business, and you lose oversight of those boxes of precious medicine as soon as they leave your freight bay in New Jersey.

IoT opens a new era for secure, smart cold chain asset management

It used to be that the only solution available for you to monitor and manage your cold chain was for your freight technicians to toss a data logger in the center of each outbound pallet and hope for the best. The shipment was passed from the third-party logistics firm to distributors, to warehouses, past freight forwarders, onto last-mile distribution, and finally on to the pharmacy and patients. Your visibility was minimal while your exposure to drug waste or potential counterfeiting was high.

Microsoft and Wipro envisioned a better solution. One that that would help ensure the cold chain was maintained from production to delivery to customers. And one that would limit issues like counterfeiting.

We worked with a top 20 global pharmaceutical company to develop Titan Secure, a digital supply chain and anti-counterfeiting platform. The platform was built with Microsoft Azure Internet of Things (IoT) technologies. See the Titan Secure reference architecture below to learn more.

Wipro Titan Secure Reference Architecture using Azure IoT.

“Azure IoT technology enabled us to develop a real-time IoT solution that provided the alerts and analytics needed to maintain the cold chain and decrease counterfeiting costs for pharmaceutical customers,” explained Sujan Thanjavuru, Head of Life Sciences Strategy & Transformation, Wipro, Ltd. “We worked with our customer to customize the sensors and develop a user interface that made it easy for managers to understand the state of their pharma shipments in real time. The result was an easy-to-use dashboard that provided valuable insights.”

“Azure IoT brings greater efficiency and reliability to customer value chains with world-class IoT and location intelligence services,” added Tony Shakib, IoT Business Acceleration Leader, Microsoft Azure.

Imagine a future with reduced counterfeit drugs and cold chain product wastage

Fast forward: imagine you’ve implemented Titan Secure from Wipro. Now, your outbound freight technician slaps a small, flexible bluetooth low energy (BLE) beacon sensor onto each box of medication, which is paired with the FDA and EMA-compliant serial number and barcode. The sensors measure temperature, humidity, shock, vibration, and tamper data. They generate geospatial alerts in real time in the event of a temperature excursion or potential counterfeiting attempts. The information is stored in and displayed from Azure. Data is transferred on the backend using Microsoft blockchain, but shipping operators don’t need to know what that means to use it. On an easy-to-use, interactive map and dashboard, technicians can easily track each individual box of your company’s product as it’s shipped from your outbound warehouse all the way to the pharmacy. Your managers receive an alert when a shipment is predicted to get too hot, so that you can call the third party and fix the problem before the shipment has to be destroyed. Once you notice tampering within one of your shipments, you’ll find out quickly what’s happened and how many boxes have been affected.

Manage your cold chain in real-time

What does this mean for your company? Wipro’s Thanjavuru explained, “Pharmaceutical companies can now digitally transform their cold chain management. They can monitor temperature and telemetry data through the entire product journey, view analytics and alerts within the Titan Secure dashboard for visibility including anti-counterfeiting support, and – with cloud connectivity – information about the shipment is available in near real-time.”

Visual interface for Azure Machine Learning service

$
0
0

Title image, text reading Visual interface for Azure Machine Learning service.

During Microsoft Build we announced the preview of the visual interface for Azure Machine Learning service. This new drag-and-drop workflow capability in Azure Machine Learning service simplifies the process of building, testing, and deploying machine learning models for customers who prefer a visual experience to a coding experience. This capability brings the familiarity of what we already provide in our popular Azure Machine Learning Studio with significant improvements to ease the user experience.

Visual interface

The Azure Machine Learning visual interface is designed for simplicity and productivity. The drag-and-drop experience is tailored for:

  • Data scientists who are more familiar with visual tools than coding.
  • Users who are new to machine learning and want to learn it in an intuitive way.
  • Machine learning experts who are interested in rapid prototyping.

It offers a rich set of modules covering data preparation, feature engineering, training algorithms, and model evaluation. Another great aspect of this new capability is that it is completely web-based with no software installation required. All of this to say, users of all experience levels can now view and work on their data in a more consumable and easy-to-use manner.

An image showing the new visual interface for Azure Machine Learning service.

Scalable Training

One of the biggest challenges data scientists previously faced when training data sets was the cumbersome limitations to scaling.  If you were to start by training on a smaller model and then had a need to expand it due to an influx of data, or complex algorithms you would be required to migrate your entire data set to continue your training.  With the new visual interface for Azure Machine Learning we’ve replaced the back end to reduce these limitations.

An experiment authored in the drag-and-drop experience can run on any Azure Machine Learning Compute cluster. As your training scales up on larger data sets or complex models, the Azure Machine Learning compute can autoscale from single node to multi node each time an experiment is submitted to run. With autoscaling you can now start with small models and not worry about expanding your production work with bigger data. By removing scaling limitations, data scientists now can focus on their training work.

Easy deployment

Deploying a trained model to a production environment previously required knowledge of coding, model management, container service, and web service testing. We wanted to provide an easier solution to this challenge so that these skills are no longer necessary. With the new visual interface, customers of all experience levels can deploy a trained model with just a few clicks. We will discuss how to launch this interface later in this blog.

Once a model is deployed, you can test the web service immediately from this new user visual interface. Now you can test to make sure your models are correctly deployed. All web service inputs are now pre-populated for convenience. The web service API and sample code are also automatically generated. These procedures normally used to take hours to perform, but now with the new visual interface it can all happen within just a few clicks.
  An image of the new web services visual interface.

Full integration of Azure Machine Learning service

As the newest capability of Azure Machine Learning service, the visual interface brings the best of Azure Machine Learning service and Machine Learning Studio together. The assets created in this new visual interface experience can be used and managed in the Azure Machine Learning service workspace. These include experiments, compute, models, images, and deployments. It also natively inherits the capabilities like run history, versioning, and security of Azure Machine Learning service.

How to use

See for yourself just how easy it is to use this interface with just a few clicks. To access this new capability, open your Azure Machine Learning workspace in the Azure portal. In your workspace, select visual interface (preview) to launch the visual interface.
  An image of the visual interface docs page.

Get started today

Visual Studio 2019 version 16.1 now generally available (and 16.2 Preview 1 as well)

$
0
0

Today, we are making Visual Studio 2019 version 16.1 generally available, as well as the first preview release of Visual Studio 2019 version 16.2. You can download both versions from VisualStudio.com. If you already have Preview installed, you can alternatively click the notification bell from inside Visual Studio to update. We’ve highlighted some notable features below and you can also see a list of all the changes in the current release notes or the Preview release notes. 

What to expect in 16.1 today 

Let’s start with Visual Studio IntelliCode which we made generally available at //Build 2019. IntelliCode now comes installed with any workload that supports C#, C++, TypeScipt/JavaScript, or XAML. IntelliCode provides AI-enhanced IntelliSense, so as you type, the context of the code will be used to recommend the next API you might use, rather than a simple alphabetical list. If you work with multiple monitors, and multiple resolutions, with Per-Monitor-Awareness, you will find that in most cases, your IDE and tool windows will scale appropriately for crisp visuals too. Finally, Visual Studio Search will now display Most Recently Used results to help you get to projects faster. 

For .NET developers, we’ve added new .NET productivity features such as one-click code cleanup on projects and solutions, a new toggle block comment keyboard shortcut and new refactoring capability to move types to other namespaces. But that’s not all! You now have improved IntelliSense that provides completion for unimported types and improvements to the .editorconfig integration. Finally, we have a preview XAML Designer for .NET Core 3.0 WPF development. 

Visual Studio 2019 version 16.1 also has several new features specific to the Linux Development with C++ workload: native support for the Windows Subsystem for Linux (WSL)AddressSanitizer integration, the ability to separate build and debug targets, and logging for remote connections. We also introduced a bunch of improvements to our CMake support including Clang/LLVM support for CMake projects, better vcpkg integration, and enhanced customizability for importing existing caches.  

 C++ Improvements

We continuously strive to make Visual Studio faster and more efficient. When we started 1.5 years ago, the average load time was 68 seconds for 161-sized solution and the Test Explorer took over 5 minutes to load time. With the latest release this has now been cut to 5 and 24 seconds respectively as shown below:

Performance

Test Explorer UI Updates (16.2) 

One of the focus areas for version 16.2 have been enhancements to the Visual Studio Test Explorer where we have incorporated a lot of community feedbacto help you become more productive by keeping the developer inner loop as tight as possible. The update Test Explorer provides better handling of large test sets, easier filtering, more discoverable commands, tabbed playlist views, and the addition of customizable columns that let you fine tune what test information is displayed. 

 Test Explorer in Visual Studio 2019

You can now easily view the total number of failing tests at a glance and filter by outcome with the summary buttons at the top of the Test Explorer. 

Filter buttons

You can also customize what information is shown for your tests by selecting what columns are displayed! You can display the Duration column when youre interested in identifying slow performing tests or you can use the Message column for comparing resultsThis table layout mimics the Error List table in its customizability. The columns can also be filtered using the filter icon that appears when hovering over the column header. 

Adjustable and filterable columns

Additionally, you now can specify what is displayed in each tier of the test hierarchy. The default tiers are Project, Namespace, and then Class, but you can also select Outcome or Duration groupings. 

Customizable hierarchy 

Playlists can be displayed in multiple tabs and are much easier to create and discard as needed. Live Unit Testing also gets its own tab that displays all tests currently included in Live Unit Testing so you can easily keep track of Live Unit Testing results, separate from the manually run test results. Live Unit Testing, is a Visual Studio feature that automatically runs any impacted unit tests in the background and presents the results and code coverage live in the Visual Studio IDE in real time. 

Playlists and Live Unit Testing tab 

Read about all the new updates in the release notes. 

Visual Studio integration with the Azure SignalR Service (16.2) 

If you are building Web Apps or services that are deployed and hosted in Azure App Service, then you may be using the Azure SignalR Service too, to enable real-time communication to enable you to route WebSocket traffic in a more efficient and scalable way. When developing these apps in Visual Studio 2019 16.2 Preview 1, you will now have a smoother experience to create and configure Azure SignalR Service  automatically during the publish phase to Azure App Service 

Give it a try today and let us know what you think 

We encourage everyone to update to Visual Studio 2019 version 16.1 by downloading directly from VisualStudio.com and we would also invite you to try out the 16.2 Preview 1 release by downloading it online, or updating via the notification bell inside Visual Studio. You can also use the Visual Studio Installer to install the update.

We are continuously driven by your feedback, so we look forward to hearing what you have to say about our latest release. If you come across any issues, make sure to let us know by using the Report a Problem tool in Visual Studio. Additionally, you can head over to Visual Studio Developer Community to track your issues, suggest a feature, ask questions, and find answers from others. We use your feedback to continue to improve Visual Studio 2019, so thank you again on behalf of our entire team. 


The post Visual Studio 2019 version 16.1 now generally available (and 16.2 Preview 1 as well) appeared first on The Visual Studio Blog.

MRAN snapshots, and you

$
0
0

For almost five years, the entire CRAN repository of R packages has been archived on a daily basis at MRAN. If you use CRAN snapshots from MRAN, we'd love to hear how you use them in this survey. If you're not familiar with the concept, or just want to learn more, read on.

Every day since September 17, 2014, we (Microsoft and, before the acquisition, Revolution Analytics) have archived a snapshot of the entire CRAN repository as a service to the R community. These daily snapshots have several uses:

  • As a longer-term archive of binary R packages. (CRAN keeps an archive of package source versions, but binary versions of packages are kept for a limited time. CRAN keeps package binaries only for the current R version and the prior major version, and only for the latest version of the package). 
  • As a static CRAN repository you can use like the standard CRAN repository, but frozen in time. This means changes to CRAN packages won't affect the behavior of R scripts in the future (for better or worse). options(repos="https://cran.microsoft.com/snapshot/2017-03-15/") provides a CRAN repository that works with R 3.3.3, for example — and you can choose any date since September 17, 2014.
  • The checkpoint package on CRAN provides a simple interface to these CRAN snapshots, allowing you use a specific CRAN snapshot by specifying a date, and making it easy to manage multiple R project each using different snapshots.
  • Microsoft R Open, Microsoft R Client, Microsoft ML Server and SQL Server ML Services all use fixed CRAN repository snapshots from MRAN by default.
  • The rocker project provides container instances for historical versions of R, tied to an appropriate CRAN snapshot from MRAN suitable for the corresponding R version.
MRAN time machine
Browse the MRAN time machine to find specific CRAN snapshots by date. (Tip: click the R logo to open the snapshot URL in its own new window.)

MRAN and the CRAN snapshot system was created at a time when reproducibility was an emerging concept in the R ecosystem. Now, there are several methods available to ensure that your R code works consistently, even as R and CRAN changes. Beyond virtualization and containers, you have packages like packrat and miniCRAN, RStudio's package manager, and the full suite of tools for reproducible research.

As CRAN has grown and changes to packages have become more frequent, maintaining MRAN is an increasingly resource-intensive process. We're contemplating changes, like changing the frequency of snapshots, or thinning the archive of snapshots that haven't been used. But before we do that we'd  like to hear from the community first. Have you used MRAN snapshots? If so, how are you using them? How many different snapshots have you used, and how often do you change that up? Please leave your feedback at the survey link below by June 14, and we'll use the feedback we gather in our decision-making process. Responses are anonymous, and we'll summarize the responses in a future blog post. Thanks in advance!

Take the MRAN survey here.

Strict null checking the Visual Studio Code codebase


How you can use IoT to power Industry 4.0 innovation

$
0
0

Man working at a desktop computer in a bright office.

IoT is ushering in an exciting—and sometimes exasperating—time of innovation. Adoption isn’t easy, so it’s important to hold a vision of the promise of Industry 4.0 in mind as you get ready for this next wave of business.

IoT can serve as an onramp to continual transformation, providing companies with the ability to capitalize more fully on automation, AI, and machine learning. As companies harness the power of IoT, cloud services, robotics, and other emerging technologies, they’ll discover new ways of working, creating, and living. They’ll test and learn more swiftly, and scale results in the most promising areas. And this innovation will find form in smart buildings, more efficient factories, connected cities, fully autonomous vehicles, a healthier environment, and better lives.

Between now and that digital world, there are years of trial and error and dozens of applications ahead. But companies across the spectrum are embedding IoT to attain data and analytics mastery, optimize processes, create new services, and rethink products right now. Their leaders are positioning themselves and their companies to take advantage of the promise of digitization across industries.

This post is the fourth in a four-part series designed to help companies maximize their ROI on IoT. In the first post, we discussed how IoT can transform businesses. In the second, we shared insights on how to create a successful strategy that yields desired ROI. In the third post, we discussed how companies can fill capability gaps. Now let’s offer some fresh thinking on what innovation could look like for your company.

IoT innovation is not one size fits all. What it means for a process manufacturing firm is necessarily different than what it will mean for a healthcare company. To help you understand how you might apply IoT to your business—and learn from companies that have gone before you—here are four different innovation plays.

Push service optimization to new levels

With almost all companies competing on the customer experience, it makes sense to optimize service levels to trim cost, error, and delay from customer-facing processes. Better service can be a key differentiator in the marketplace. And when it’s paired with continual optimization enabled by IoT, your customers start seeing the benefit in their businesses.

Jabil is one of the world’s largest and most innovative providers of manufacturing, design engineering, and supply-chain-management technologies. Jabil was quick to recognize that keeping and increasing its competitive edge required the company to accelerate production cycles and personalize products. Its customers might order a product only once, meaning that they couldn’t afford the time delays and waste of traditional inspection processes. “We have many products that customers expect to [have] in their shops within a week,” says Matt Behringer, chief information officer for enterprise operations and quality systems at Jabil. “And that is including transit.”

Jabil used an IoT approach based on the Microsoft Azure Cortana Intelligence Suite to connect systems, gain predictive intelligence, and increase its flexibility and scalability. In a pilot project that connected an electronics manufacturing production line to the cloud, Jabil was able to anticipate and avoid more than half of circuit board failures at the second step in the process, and the remaining 45 percent at the sixth step. By using AI and machine learning, Jabil can correct board errors even earlier in the process, reducing scrapped materials, product failures, and warranty issues. Now, the IoT platform monitors all individual production lines and collects data from every Jabil factory and product worldwide. Jabil is pushing optimization further by using deep neural networks to refine its automated optical inspection process, increasing speed and accuracy to new levels.

“One of the things we’re able to do with predictive analytics in Azure is reduce waste, whether it’s from a process or design issue, or as a result of maintaining enough excess inventory to ensure we have enough for shipment. We’re confident we can produce a good-quality product all the way through the line,” says Behringer.

Leverage data from a digital ecosystem

As companies build IoT-enabled systems of intelligence, they’re creating ecosystems where partners work together seamlessly in a fluid and ever-changing digital supply chain. Participants gain access to a centralized view of real-time data they can use to fine-tune processes, and analytics to enable predictive decision-making. In addition, automation can help customers reduce sources of waste such as unnecessary resource use.

PCL Construction comprises a group of independent construction companies that perform work in the United States, the Caribbean, and Australia. Recognizing that smart buildings are the future of construction, PCL is partnering with Microsoft to drive smart building innovation and focus implementation efforts.

The company is using the full range of Azure solutions—Power BI, Azure IoT, advanced analytics, and AI—to develop smart building solutions for multiple use cases, including increasing construction efficiency and workplace safety, improving building efficiency by turning off power and heat in unused rooms, analyzing room utilization to create a more comfortable and productive work environment, and collecting usage information from multiple systems to optimize services at an enterprise level. PCL’s customers benefit with greater control, more efficient buildings, and lower energy consumption and costs.

However, the path forward wasn’t easy. “Cultural transformation was a necessary and a driving factor in PCL’s IoT journey. To drive product, P&L, and a change in approach to partnering, we had to first embrace this change as a leadership team,” says PCL manager of advanced technology services Chris Palmer.

Develop a managed-services business

Essen, Germany-based thyssenkrupp Elevator is one of the world’s leading providers of elevators, escalators, and other passenger transportation solutions. The company uses a wide range of Azure services to improve usage of its solutions and streamline maintenance at customers’ sites around the globe.

With business partner Willow, thyssenkrupp has used the Azure Digital Twin platform to create a virtual replica of its Innovation Test Tower, an 800-foot-tall test laboratory in Rottweill, Germany. The lab is also an active commercial building, with nearly 200,000 square feet of occupied space and IoT sensors that transmit data 24 hours a day. Willow and thyssenkrupp are using IoT to gain new insights into building operations and how space is used to refine products and services.

In addition, thyssenkrupp has developed MAX, a solution built on the Azure platform that uses IoT, AI, and machine learning to help service more than 120,000 elevators worldwide. Using MAX, building operators can reduce elevator downtime by half and cut the average length of service calls by up to four times, while improving user satisfaction.

The company’s MULTI system uses IoT and AI to make better decisions about where elevators go, providing faster travel times or even scheduling elevator arrival to align with routine passenger arrivals.

“We constantly reconfigure the space to test different usage scenarios and see what works best for the people in the [Innovation Test Tower] building. We don’t have to install massive new physical assets for testing because we do it all through the digital replica—with keystrokes rather than sledgehammers. We have this flexibility thanks to Willow Twin and its Azure infrastructure,” says professor Michael Cesarz, chief executive officer for MULTI at thyssenkrupp.

Rethink products and services for the digital era

Kohler, a leading manufacturer, is embedding IoT in its products to create smart kitchens and bathrooms, meeting consumer demand for personalization, convenience, and control. Built with the Microsoft Azure IoT platform, the platform responds to voice commands, hand motions, weather, and consumer preset options.

And Kohler innovated fast, using Azure to demo, develop, test, and scale the new solutions. “From zero to demo in two months is incredible. We easily cut our development cycle in half by using Azure platform services while also significantly lowering our startup investment,” says Fei Shen, associate director of IoT engineering at Kohler.

The smart bathroom and kitchen products can start a user’s shower, adjust the water temperature to a predetermined level, turn on mirror lights to preferred brightness and color, and share the day’s weather and traffic. They also warn users if water floods their kitchen and bathroom. The smart fixtures provide Kohler with critical insights into how consumers are using their products, which they can use to develop new products and fine-tune existing features.

Kohler is betting that consumer adoption of smart home technology will grow and is pivoting its business to meet new demand. “We’ve been making intelligent products for about 10 years, things like digital faucets and showers, but none have had IoT capability. We want to help people live more graciously, and digitally enabling our products is the next step in doing that,” said Jane Yun, Associate Marketing Manager in Smart Kitchens and Baths at Kohler.

As these examples show, the possibilities for IoT are boundless and success is different for every company. Some firms will leverage IoT only for internal processes, while others will use analytics and automation to empower all the partners in their digital ecosystems. Some companies will wrap data services around physical product offerings to optimize the customer experience and deepen relationships, while still others will rethink their products and services to tap emerging market demand and out-position competitors.

How will you apply IoT insights to transform your businesses and processes? Get help crafting your IoT strategy and maximizing your opportunities for ROI.

Download the Unlocking ROI white paper to learn how to get more value from the Internet of Things.

All US Azure regions now approved for FedRAMP High impact level

Transforming Azure Monitor Logs for DevOps, granular access control, and improved Azure integration

$
0
0

Logs are critical for many scenarios in the modern digital world. They are used in tandem with metrics for observability, monitoring, troubleshooting, usage and service level analytics, auditing, security, and much more. Any plan to build an application or IT environment should include a plan for logs.

Logs architecture

There are two main paradigms for logs:

  • Centralized: All logs are kept in a central repository. In this scenario, it is easy to search across resources and cross-correlate logs but, since these repositories get big and include logs from all kind of sources, it's hard to maintain access control on them. Some organizations completely avoid centralized logging for that reason, while other organizations that use centralized logging restrict access to very few admins, which prevents most of their users from getting value out of the logs.
  • Siloed: Logs are either stored within a resource or stored centrally but segregated per resource. In these instances, the repository can be kept secure, and access control is coherent with the resource access, but it's hard or impossible to cross-correlate logs. Users who need a broad view of many resources cannot generate insights. In modern applications, problems and insights span across resources, making the siloed paradigm highly limited in its value.

    To accommodate the conflicting needs of security and log correlations many organizations have implemented both paradigms in parallel, resulting in a complex, expensive, and hard-to-maintain environment with gaps in logs coverage. This leads to lower usage of log data in the organization and results in decision-making that is not based on data.

    New access control options for Azure Monitor Logs

    We have recently announced a new set of Azure Monitor Logs capabilities that allow customers to benefit from the advantages of both paradigms. Customers can now have their logs centralized while seamlessly integrated into Azure and its role based access control (RBAC) mechanisms. We call this resource-centric logging. It will be added to the existing Azure Monitor Logs experience automatically while maintaining the existing experiences and APIs. Delivering a new logs model is a journey, but you can start using this new experience today. We plan to enhance and complete alignment of all Azure Monitor's components over the next few months.

    The basic idea behind resource-centric logs is that every log record emitted by an Azure resource is automatically associated with this resource. Logs are sent to a central workspace container that respects scoping and RBAC based on the resources. Users will have two options for accessing the data:

    1. Workspace-centric: Query all data in a specific workspace–Azure Monitor Logs container. Workspace access permissions apply. This mode will be used by centralized teams that need access to logs regardless of the resource permissions. It can also be used for components that don't support resource-centric or off-Azure resources, though a new option for them will be available soon.
    2.  Resource-centric: Query all logs related to a resource. Resource access permissions apply. Logs will be served from all workspaces that contain data for that resource without the need to specify them. If workspace access control allows it, there is no need to grant the users access to the workspace. This mode works for a specific resource, all resources in a specific resource group, or all resources in a specific subscription. Most application teams and DevOps will be using this mode to consume their logs.

      Azure Monitor experience automatically decides on the right mode depending on the scope the user chooses. If the user selects a workspace, queries will be sent in workspace-centric mode. If the user selects a resource, resource group, or subscription, resource-centric is used. The scope is always presented in the top left section of the Log Analytics screen:

      Logs scope selector

      You can also query all logs of resources in a specific resource group using the resource group screen:

      Soon, Azure Monitor will also be able to scope queries for an entire subscription.

      To make logs more prevalent and easier to use, they are now integrated into many Azure resource experiences. When log search is opened from a resource menu, the search is automatically scoped to that resource and resource-centric queries are used. This means that if users have access to a resource, they'll be able to access their logs. Workspace owners can block or enable such access using the workspace access control mode.

      Another capability we're adding is the ability to set permissions per table that store the logs. By default, if users are granted access to workspaces or resources, they can read all their log types. The new table RBAC allows admins to use Azure custom roles to define limited access for users, so they're only able to access some of the tables, or admins can block users from accessing specific tables. You can use this, for example, if you want the networking team to be able to access only the networking related table in a workspace or a subscription.

      As result of these changes, organizations will have simpler models with fewer workspaces and more secure access control. Workspaces now assume the role of a manageable container, allowing administrators to better govern their environments. Users are now empowered to view logs in their natural Azure context, helping them to leverage the power of logs in their day-to-day work.

      The improved Azure Monitor Logs access control lets you now enjoy both worlds at once without compromise on usability and security. Central teams can have full access to all logs while DevOps teams can access logs only for their resources. This comes on top of the powerful log analytics, integration and scalability capabilities that are used by tens of thousands of customers.

      Next steps

      To use it today, you need to:

      1. Decide which workspaces should be used to store all data. Take into account billing, regulation, and data ownership.
      2. Change your workspace access control mode to “Use resource or workspace permissions” to enable them for resource-centric access. Workspaces created after March 2019 are configured to this mode by default.
      3. Remove workspace access permissions from your application teams and DevOps.
      4. Let your users become master of their logs.

      Top Stories from the Microsoft DevOps Community – 2019.05.24

      $
      0
      0

      This week I’m lucky to be in Berlin at GitHub Satellite, where I got to see some of the amazing announcements from our friends over at GitHub and talk to GitHub users about Azure Pipelines. And now that it’s Friday, I’m getting caught up on the Azure DevOps news as well.

      From one release per quarter to 30 times a day
      This great session that Marcel de Vries gave earlier this year at NDC Minnesota is now online: he takes you on a journey to take a legacy waterfall application and apply modern release techniques so that you can release multiple times per day while keeping the quality high.

      Azure DevOps Terraform Trouble
      Simon Timms was staying bleeding edge and running the latest version of Terraform in his Azure DevOps builds. And unfortunately, he noticed an incompatibility between Terraform 12 and his Azure DevOps tasks. It’s a good reminder to stay on a known-good version, and shows you how to stay on that particular release.

      Another gem of Azure DevOps, multi-stage pipelines
      I’m super excitetd about the new multi-stage pipeline functionality in Azure Pipelines, because it lets me script my release pipeline in YAML. Gian Maria Ricci is excited as well, and explains how the new multi-stage pipeline functionality works.

      Build and Deploy a Node.js Application into Azure Web Apps Using Azure DevOps
      It’s easy to get started with Azure Pipelines for any app – including node.js. But Michio JP levels up by adding security scanning with WhiteSource Bolt, publishing test results and code coverage into the Azure Pipelines test analytics, and a deployment into a web application.

      As always, if you’ve written an article about Azure DevOps or find some great content about DevOps on Azure then let me know! I’m @ethomson on Twitter.

      The post Top Stories from the Microsoft DevOps Community – 2019.05.24 appeared first on Azure DevOps Blog.

      Windows 10 SDK Preview Build 18898 available now!

      $
      0
      0

      Today, we released a new Windows 10 Preview Build of the SDK to be used in conjunction with Windows 10 Insider Preview (Build 18898 or greater). The Preview SDK Build 18898 contains bug fixes and under development changes to the API surface area.

      The Preview SDK can be downloaded from developer section on Windows Insider.

      For feedback and updates to the known issues, please see the developer forum. For new developer feature requests, head over to our Windows Platform UserVoice.

      Things to note:

      • This build works in conjunction with previously released SDKs and Visual Studio 2017 and 2019. You can install this SDK and still also continue to submit your apps that target Windows 10 build 1903 or earlier to the Microsoft Store.
      • The Windows SDK will now formally only be supported by Visual Studio 2017 and greater. You can download the Visual Studio 2019 here.
      • This build of the Windows SDK will install ONLY on Windows 10 Insider Preview builds.
      • In order to assist with script access to the SDK, the ISO will also be able to be accessed through the following static URL: https://software-download.microsoft.com/download/sg/Windows_InsiderPreview_SDK_en-us_18898_1.iso.

      Tools Updates

      Message Compiler (mc.exe)

      • Now detects the Unicode byte order mark (BOM) in .mc files. If the If the .mc file starts with a UTF-8 BOM, it will be read as a UTF-8 file. Otherwise, if it starts with a UTF-16LE BOM, it will be read as a UTF-16LE file. If the -u parameter was specified, it will be read as a UTF-16LE file. Otherwise, it will be read using the current code page (CP_ACP).
      • Now avoids one-definition-rule (ODR) problems in MC-generated C/C++ ETW helpers caused by conflicting configuration macros (e.g. when two .cpp files with conflicting definitions of MCGEN_EVENTWRITETRANSFER are linked into the same binary, the MC-generated ETW helpers will now respect the definition of MCGEN_EVENTWRITETRANSFER in each .cpp file instead of arbitrarily picking one or the other).

      Windows Trace Preprocessor (tracewpp.exe)

      • Now supports Unicode input (.ini, .tpl, and source code) files. Input files starting with a UTF-8 or UTF-16 byte order mark (BOM) will be read as Unicode. Input files that do not start with a BOM will be read using the current code page (CP_ACP). For backwards-compatibility, if the -UnicodeIgnore command-line parameter is specified, files starting with a UTF-16 BOM will be treated as empty.
      • Now supports Unicode output (.tmh) files. By default, output files will be encoded using the current code page (CP_ACP). Use command-line parameters -cp:UTF-8 or -cp:UTF-16 to generate Unicode output files.
      • Behavior change: tracewpp now converts all input text to Unicode, performs processing in Unicode, and converts output text to the specified output encoding. Earlier versions of tracewpp avoided Unicode conversions and performed text processing assuming a single-byte character set. This may lead to behavior changes in cases where the input files do not conform to the current code page. In cases where this is a problem, consider converting the input files to UTF-8 (with BOM) and/or using the -cp:UTF-8 command-line parameter to avoid encoding ambiguity.

      TraceLoggingProvider.h

      • Now avoids one-definition-rule (ODR) problems caused by conflicting configuration macros (e.g. when two .cpp files with conflicting definitions of TLG_EVENT_WRITE_TRANSFER are linked into the same binary, the TraceLoggingProvider.h helpers will now respect the definition of TLG_EVENT_WRITE_TRANSFER in each .cpp file instead of arbitrarily picking one or the other).
      • In C++ code, the TraceLoggingWrite macro has been updated to enable better code sharing between similar events using variadic templates.

      Breaking Changes

      Removal of IRPROPS.LIB

      In this release irprops.lib has been removed from the Windows SDK. Apps that were linking against irprops.lib can switch to bthprops.lib as a drop-in replacement.

      API Updates, Additions and Removals

      The following APIs have been added to the platform since the release of Windows 10 SDK, version 1903, build 18362.

      Additions:

      
      namespace Windows.Foundation.Metadata {
        public sealed class AttributeNameAttribute : Attribute
        public sealed class FastAbiAttribute : Attribute
        public sealed class NoExceptionAttribute : Attribute
      }
      namespace Windows.Graphics.Capture {
        public sealed class GraphicsCaptureSession : IClosable {
          bool IsCursorCaptureEnabled { get; set; }
        }
      }
      namespace Windows.Management.Deployment {
        public enum DeploymentOptions : uint {
          AttachPackage = (uint)4194304,
        }
      }
      namespace Windows.Networking.BackgroundTransfer {
        public sealed class DownloadOperation : IBackgroundTransferOperation, IBackgroundTransferOperationPriority {
          void RemoveRequestHeader(string headerName);
          void SetRequestHeader(string headerName, string headerValue);
        }
        public sealed class UploadOperation : IBackgroundTransferOperation, IBackgroundTransferOperationPriority {
          void RemoveRequestHeader(string headerName);
          void SetRequestHeader(string headerName, string headerValue);
        }
      }
      namespace Windows.UI.Composition.Particles {
        public sealed class ParticleAttractor : CompositionObject
        public sealed class ParticleAttractorCollection : CompositionObject, IIterable<ParticleAttractor>, IVector<ParticleAttractor>
        public class ParticleBaseBehavior : CompositionObject
        public sealed class ParticleBehaviors : CompositionObject
        public sealed class ParticleColorBehavior : ParticleBaseBehavior
        public struct ParticleColorBinding
        public sealed class ParticleColorBindingCollection : CompositionObject, IIterable<IKeyValuePair<float, ParticleColorBinding>>, IMap<float, ParticleColorBinding>
        public enum ParticleEmitFrom
        public sealed class ParticleEmitterVisual : ContainerVisual
        public sealed class ParticleGenerator : CompositionObject
        public enum ParticleInputSource
        public enum ParticleReferenceFrame
        public sealed class ParticleScalarBehavior : ParticleBaseBehavior
        public struct ParticleScalarBinding
        public sealed class ParticleScalarBindingCollection : CompositionObject, IIterable<IKeyValuePair<float, ParticleScalarBinding>>, IMap<float, ParticleScalarBinding>
        public enum ParticleSortMode
        public sealed class ParticleVector2Behavior : ParticleBaseBehavior
        public struct ParticleVector2Binding
        public sealed class ParticleVector2BindingCollection : CompositionObject, IIterable<IKeyValuePair<float, ParticleVector2Binding>>, IMap<float, ParticleVector2Binding>
        public sealed class ParticleVector3Behavior : ParticleBaseBehavior
        public struct ParticleVector3Binding
        public sealed class ParticleVector3BindingCollection : CompositionObject, IIterable<IKeyValuePair<float, ParticleVector3Binding>>, IMap<float, ParticleVector3Binding>
        public sealed class ParticleVector4Behavior : ParticleBaseBehavior
        public struct ParticleVector4Binding
        public sealed class ParticleVector4BindingCollection : CompositionObject, IIterable<IKeyValuePair<float, ParticleVector4Binding>>, IMap<float, ParticleVector4Binding>
      }
      namespace Windows.UI.ViewManagement {
        public enum ApplicationViewMode {
          Spanning = 2,
        }
      }
      namespace Windows.UI.WindowManagement {
        public enum AppWindowPresentationKind {
          Spanning = 4,
        }
        public sealed class SpanningPresentationConfiguration : AppWindowPresentationConfiguration
      }


      The post Windows 10 SDK Preview Build 18898 available now! appeared first on Windows Developer Blog.

      Viewing all 5971 articles
      Browse latest View live


      <script src="https://jsc.adskeeper.com/r/s/rssing.com.1596347.js" async> </script>