Quantcast
Channel: Category Name
Viewing all 5971 articles
Browse latest View live

Improving Azure Virtual Machines resiliency with Project Tardigrade

$
0
0

"Our goal is to empower organizations to run their workloads reliably on Azure. With this as our guiding principle, we are continuously investing in evolving the Azure platform to become fault resilient, not only to boost business productivity but also to provide a seamless customer experience. Last month I published a blog post highlighting several initiatives underway to keep improving in this space, as part of our commitment to provide a trusted set of cloud services. Today I wanted to expand on the mention of Project Tardigrade – a platform resiliency initiative that improves high availability of our services even during the rare cases of spontaneous platform failures. The post that follows was written by Pujitha Desiraju and Anupama Vedapuri from our compute platform fundamentals team, who are leading these efforts.” Mark Russinovich, CTO, Azure


This post was co-authored by Jim Cavalaris, Principal Software Engineer, Azure Compute. 


Codenamed Project Tardigrade, this effort draws its inspiration from the eight-legged microscopic creature, the tardigrade also known as the water bear. Virtually impossible to kill, tardigrades can be exposed to extreme conditions, but somehow still manage to wiggle their way to survival. This is exactly what we envision our servers to emulate when we consider resiliency, hence the name Project Tardigrade. Similar to a tardigrade’s survival across a wide range of extreme conditions, this project involves building resiliency and self-healing mechanisms across multiple layers of the platform ranging from hardware to software, all with a view towards safeguarding your virtual machines (VMs) as much as possible.

An image of a tardigrade.

How does it work?

Project Tardigrade is a broad platform resiliency initiative which employs numerous mitigation strategies with the purpose of ensuring your VMs are not impacted due to any unanticipated host behavior. This includes enabling components to self-heal and quickly recover from potential failures to prevent impact to your workloads. Even in the rare cases of critical host faults, our priority is to preserve and protect your VMs from these spontaneous events to allow your workloads to run seamlessly.

One example recovery workflow is highlighted below, for the uncommon event in which a customer initiated VM operation fails due to an underlying fault on the host server. To carry out the failed VM operation successfully, as well proactively prevent the issue from potentially affecting other VMs on the server, the Tardigrade recovery service will be notified and will begin executing failover operations.

The following phases briefly describe the Tardigrade recovery workflow:

Phase 1:

This step has no impact to running customer VMs. It simply recycles all services running on the host. In the rare case that the faulted service does not successfully restart, we proceed to Phase 2.

Phase 2:

Our diagnostics service runs on the host to collect all relevant logs/dumps systematically, to ensure that we can thoroughly diagnose the reason for failure in Phase 1. This comprehensive analysis allows us to ‘root cause’ the issue and thereby prevent reoccurrences in the future.

Phase 3:

At a high level, we reset the OS into a healthy state with minimal customer impact to mitigate the host issue. During this phase we preserve the states of each VM to RAM, after which we begin to reset the OS into a healthy state. While the OS swiftly resets underneath, running applications on all VMs hosted on the server briefly ‘freeze’ as the CPU is temporarily suspended. This experience is similar to a network connection temporarily lost but quickly resumed due to retry logic. After the OS is successfully reset, VMs consume their stored state and resume normal activity, thereby circumventing any potential VM reboots.

With the above principles we ensure that the failure of any single component in the host does not impact the entire system, making customer VMs more immune to unanticipated host faults. This also allows us to recover quickly from some of the most extreme forms of critical failures (like kernel level failures and firmware issues) while still retaining the virtual machine state that you care about.

Going forward

Currently we use the aforementioned Tardigrade recovery workflow to catch and quickly recover from potential software host failures in the Azure fleet. In parallel we are continuously innovating our technical capabilities and expanding to different host failure scenarios we can combat with this resiliency initiative.

We are also looking to explore the latest innovations in machine learning to harness the proactive capabilities of Project Tardigrade. For example, we plan to leverage machine learning to predict more types of host failures as early as possible. For example, to detect abnormal resource utilization patterns of the host that may potentially impact its workloads. We will also leverage machine learning to help recommend appropriate repair actions (like Tardigrade recovery steps, potentially live migration, etc.) thereby optimizing our fleetwide recovery options.

As customers continue to shift business-critical workloads onto the Microsoft Azure cloud platform, we are constantly learning and improving so that we can continue to meet customer expectations around interruptions from unplanned failures. Reliability is and continues to be a core tenet of our trusted cloud commitments, alongside compliance, security, privacy, and transparency. Across all of these areas, we know that customer trust is earned and must be maintained, not just by saying the right thing but by doing the right thing. Platform resiliency as practiced by Project Tardigrade is already strengthening VM availability by ensuring that underlying host issues do not affect your VMs.

We will continue to share further improvements on this project and others like it, to be as transparent as possible about how we’re constantly improving platform reliability to empower your organization.


Geo Zone Redundant Storage in Azure now in preview

$
0
0

Announcing the preview of Geo Zone Redundant Storage in Azure. Geo Zone Redundant Storage provides a great balance of high performance, high availability, and disaster recovery and is beneficial when building highly available applications or services in Azure. Geo Zone Redundant Storage helps achieve higher data resiliency by doing the following:

  • Synchronously writing three replicas of your data across multiple Azure Availability Zones, such as zone-redundant storage today, protecting from cluster, datacenter, or entire zone failure.

  • Asynchronously replicating the data to another region within the same geo into a single zone, such as locally redundant storage, protecting from a regional outage.

When using Geo Zone Redundant Storage, you can continue to read and write the data even if one of the availability zones in the primary region is unavailable. In the event of a regional failure, you can also use Read Access Geo Zone Redundant Storage to continue having read access.

Please note that Read Access Geo Zone Redundant Storage requires a general purpose v2 account and is available for block blobs, non-disk page blobs, files, tables, queues, and Azure Data Lake Storage Gen2.

With the release of the Geo Zone Redundant Storage preview, Azure offers a compelling set of durability options for your storage needs:

Scenario

Locally redundant storage

Geo-redundant storage

Read Access geo-redundant storage

Zone-redundent storage

Geo Zone Redundant Storage

Read Access Geo Zone Redundant Storage

Node unavailability within a data center

Yes

An entire data center (zonal or non-zonal) becomes unavailable

No

Yes (failover is required)

Yes

Yes

A region-wide outage

No

Yes (failover is required)

No

Yes (failover is required)

Read access to your data (in a remote, geo-replicated region) in the event of region-wide unavailability

No

No

Yes

No

No

Yes

Designed to provide X% durability of objects over a given year

at least 11 9's

at least 16 9's

at least 12 9's

at least 16 9's

Supported storage account types

GPv2, GPv1, Blob

GPv2

Availability SLA for read requests

At least 99.9% (99% for Cool Access Tier)

At least 99.99% (99.9% for Cool Access Tier)

At least 99.9% (99% for cool access tier)

At least 99.99% (99.9% for Cool Access Tier)

Availability SLA for write requests

At least 99.9% (99% for Cool Access Tier)


Current Geo Zone Redundant Storage prices are discounted preview prices and will change at the time of general availability. For details on various redundancy options please refer to Azure Storage redundancy documentation. In regions where Read Access Geo Zone Redundant Storage is not available you can still use it to build highly available applications.

The preview of Geo Zone Redundant Storage and Read Access Geo Zone Redundant Storage is initially available in US East with more regions to follow in 2019. Please check our documentation for the latest list of regions where the preview is enabled.

You can create a Geo Zone Redundant Storage account using various methods including the Azure portal, Azure CLI, Azure PowerShell, Azure Resource Manager, and the Azure Storage Management SDK. Refer to Read Access Geo Zone Redundant Storage documentation for more details.

Converting from locally redundant storage, geo-redundant storage, read-access geo-redundant storage, or zone-redundant storage to Read Access Geo Zone Redundant Storage is supported. To convert from zone-redundant storage to Read Access Geo Zone Redundant Storage you can use Azure CLI, Azure PowerShell, Azure portal, Azure Resource Manager, and the Azure Storage Management SDK.

There are two options for migrating to Read Access Geo Zone Redundant Storage from non-zone-redundant storageaccounts:

  • Manually copy or move data to a new Read Access Geo Zone Redundant Storage account from an existing account.
  • Request a live migration.

Please let us know if you have any questions or need our assistance. We are looking forward to your participation in the preview and hearing your feedback.

Resources

Better together, synergistic results from digital transformation

$
0
0

Intelligent manufacturing transformation can bring great changes, such as connecting the sales organization with field services. Moving to the cloud also provides benefits such as an intelligent supply chain and innovations enabled by connected products. As such, digital transformation is the goal of many, as it can mean finding a competitive advantage.

The Azure platform offers a wealth of services for partners to enhance, extend, and build industry solutions. Here we describe how one Microsoft partner uses Azure to solve a unique problem.

Leverage through Azure services

One company, PTC, is well-known for ThingWorx, a market-leading, end-to-end Industrial Internet of Things (IIoT) solution platform, built for industrial environments. PTC has moved its platform to Azure, and in doing so, leverages the resources and technical advantages of Microsoft. Together, the two create a synergy that can help any manufacturer make a successful move to the digital world.

An image showing how PTC leverages Microsoft technology to enhance digital factories, monetize connected products, and create intelligent value chains.

Why things matter

The ThingWorx by PTC platform includes a number of components that can kickstart any effort to digitally transform a manufacturing floor. The platform consists of two notable components:

  • ThingWorx analytics
  • ThingWorx industrial connectivity

By implementing the platform, developers can create comprehensive, feature-rich IoT solutions and deliver faster time-to-insights, critical to the success of industrial implementations. Because the platform is customized for industrial environments and all aspects of manufacturing, as outlined below, it streamlines the digital transformation with capabilities unique to manufacturing. Add to that, PTC’s partnership with Microsoft and you get capabilities such as integrating HoloLens devices into mixed reality experiences.

Azure IoT Hub integration

Azure IoT Hub has a central role on the platform. The service is accessed through the ThingWorx Azure IoT Connector. Features include:

  • Ingress processing: Devices that are running Azure IoT Hub SDK applications send messages to the Azure IoT Hub. These messages arrive through an Azure Event Hub endpoint that is provided by the IoT Hub. Communication with the ThingWorx platform is asynchronous to allow for optimal message throughput.
  • Egress processing: Egress messages arrive from the ThingWorx platform and are pushed to the Azure IoT Hub through its service client.
  • Device methods as remote services: The Azure IoT Hub enables you to invoke device (direct) methods on edge devices from the cloud.
  • Azure IoT Blob Storage: allows integration with Azure Blob Storage accounts.
  • File transfers: The Azure IoT Hub Connector supports transferring files between edge devices and an Azure Storage container.

Next steps

Microsoft is a leader in the Gartner Magic Quadrant for Unified Endpoint Management, 2019

Bringing cloud powered voices to Microsoft Edge Insiders

$
0
0

Beginning with the most recent Dev and Canary channel releases, preview builds of Microsoft Edge now include support for 24 cloud powered text to speech voices across 21 different locales. One place where these will start to show up is in Read Aloudfeature from the current (EdgeHTML-based) version of Microsoft Edge that gives people the option to have websites read to them by the browser.  

A common theme that we heard from Read Aloud feedback in the current version of Microsoft Edge was that the default speaking voices sounded robotic and unnatural. People also told us how time consuming it was to install different language packs so that they could read text in other languages. We have made this experience better with the arrival of cloud powered speaking voices in the preview builds of Microsoft Edge. 

What are cloud powered voices? 

Powered by Microsoft Cognitive Services, these new voices come in two different styles and can be distinguished from other voices you may have installed on your computer by the fact that they have “Microsoft <voiceName> Online” in their names: 

  • Neural voices  Powered by deep neural networks, these voices are the most natural sounding voices available today. 
  • Standard voices – These voices are the standard online voices offered by Microsoft Cognitive ServicesVoices with “24kbps” in their title will sound clearer compared to other standard voices due to their improved audio bitrate.  

Using cloud powered voices 

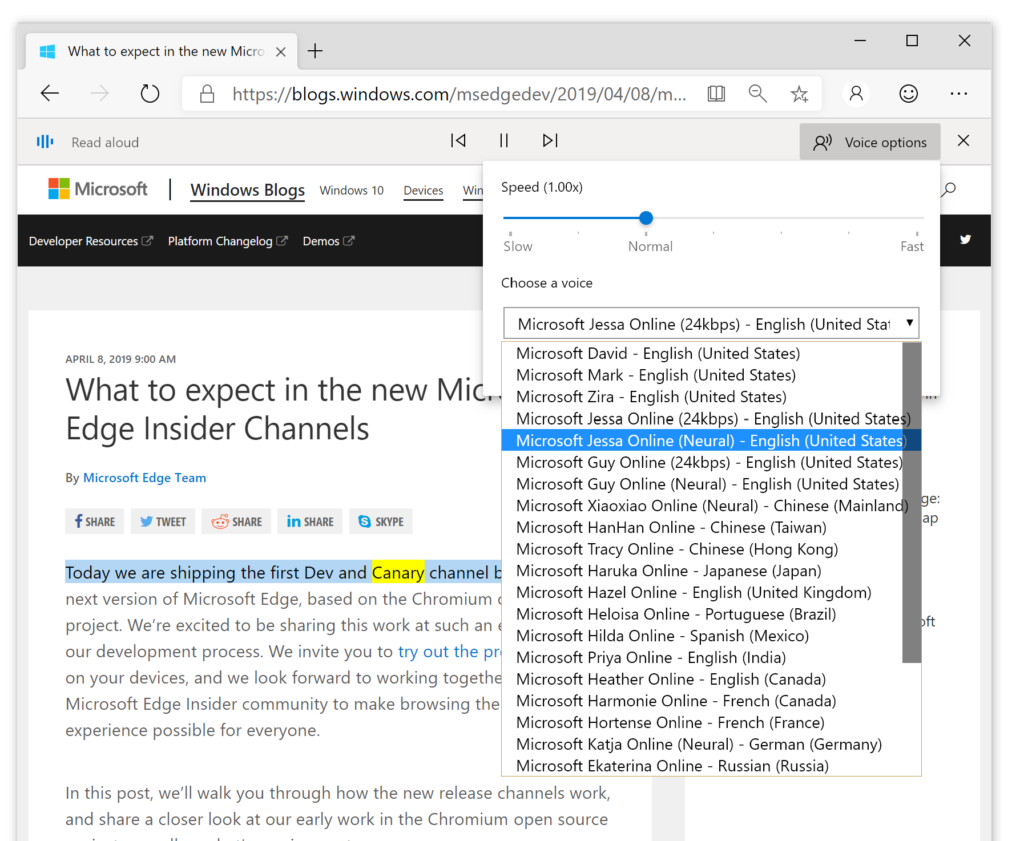
The easiest way to try out the new array of cloud-powered voices is to use the Read Aloud feature. To do this, navigate to a website, select some text, right click it, and select “Read aloud selection. This will start Read Aloud and will also open the Read Aloud menu bar which lets you pick different voices and adjust reading speed by clicking on the “Voice options” button: 

Screen capture showing the "Voice options" menu in Microsoft Edge

It’s also worth noting that these voices have been exposed to developers through the JavaScript SpeechSynthesis APIThis means that any web-based text to speech application can leverage them to create more configurable and human sounding experiences in the new version of Microsoft Edge! 

Let us know what you think 

Which voice is your favorite? Do you have any other suggestions for how we could make this experience even better? If you have any feedback for us, please send it our way using the “smiley face” in the top right corner of the browser. 

Screen capture showing the "smiley face" button to send feedback in Microsoft Edge

We’re excited to hear what you think! 

Scott Low, Program Manager, Microsoft Edge HTML Platform 

The post Bringing cloud powered voices to Microsoft Edge Insiders appeared first on Microsoft Edge Blog.

Productivity Improvements for C++: New Default Colorization, Template Argument Filtering in Call Stack Window, and IntelliCode On-By-Default

$
0
0

New Default Semantic Colorization

In Visual Studio 2019 version 16.3 Preview 2 we’ve introduced a new default semantic colorization scheme for C++. For a long time, many of the default colors were simply black. However, colorization can help you quickly understand the structure of code at a glance. To take advantage of this, we’ve created two new color schemes, and of course you can still customize your colors further by typing “Change font” in the Ctrl + Q search bar.

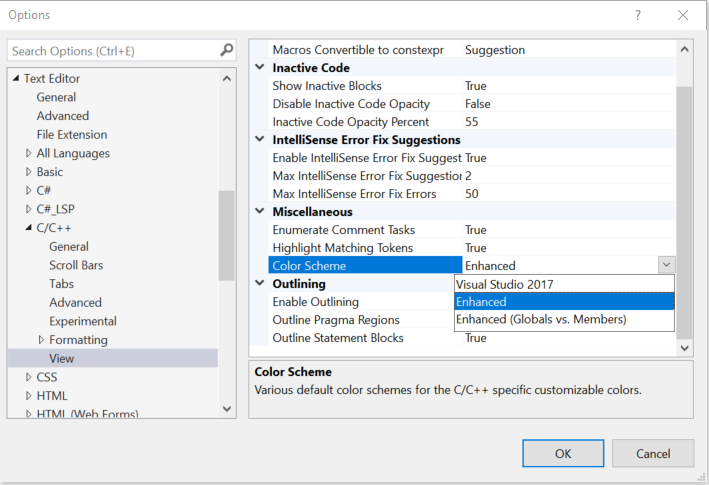
Under Tools > Options > Text Editor > C++ > View > Color Scheme you can now pick between three presets: Enhanced, Enhanced (Globals vs. Members), and Visual Studio 2017. By default, Enhanced will already be selected. Note that these color schemes change the Default color values, so if you have previously customized a color, you’ll need to reset it to Default if you want the new scheme to take effect (see the “Customizing Individual Colors” section at the bottom of this post).

Enhanced scheme

This is the new default color scheme. The following colors of this colorization differ from Visual Studio 2017:

  • Functions
  • Local variables
  • Escape characters
  • Keyword – control
    • This is a new classification for keywords related to control flow (if, else, for, return)
  • String escape characters
  • Macros

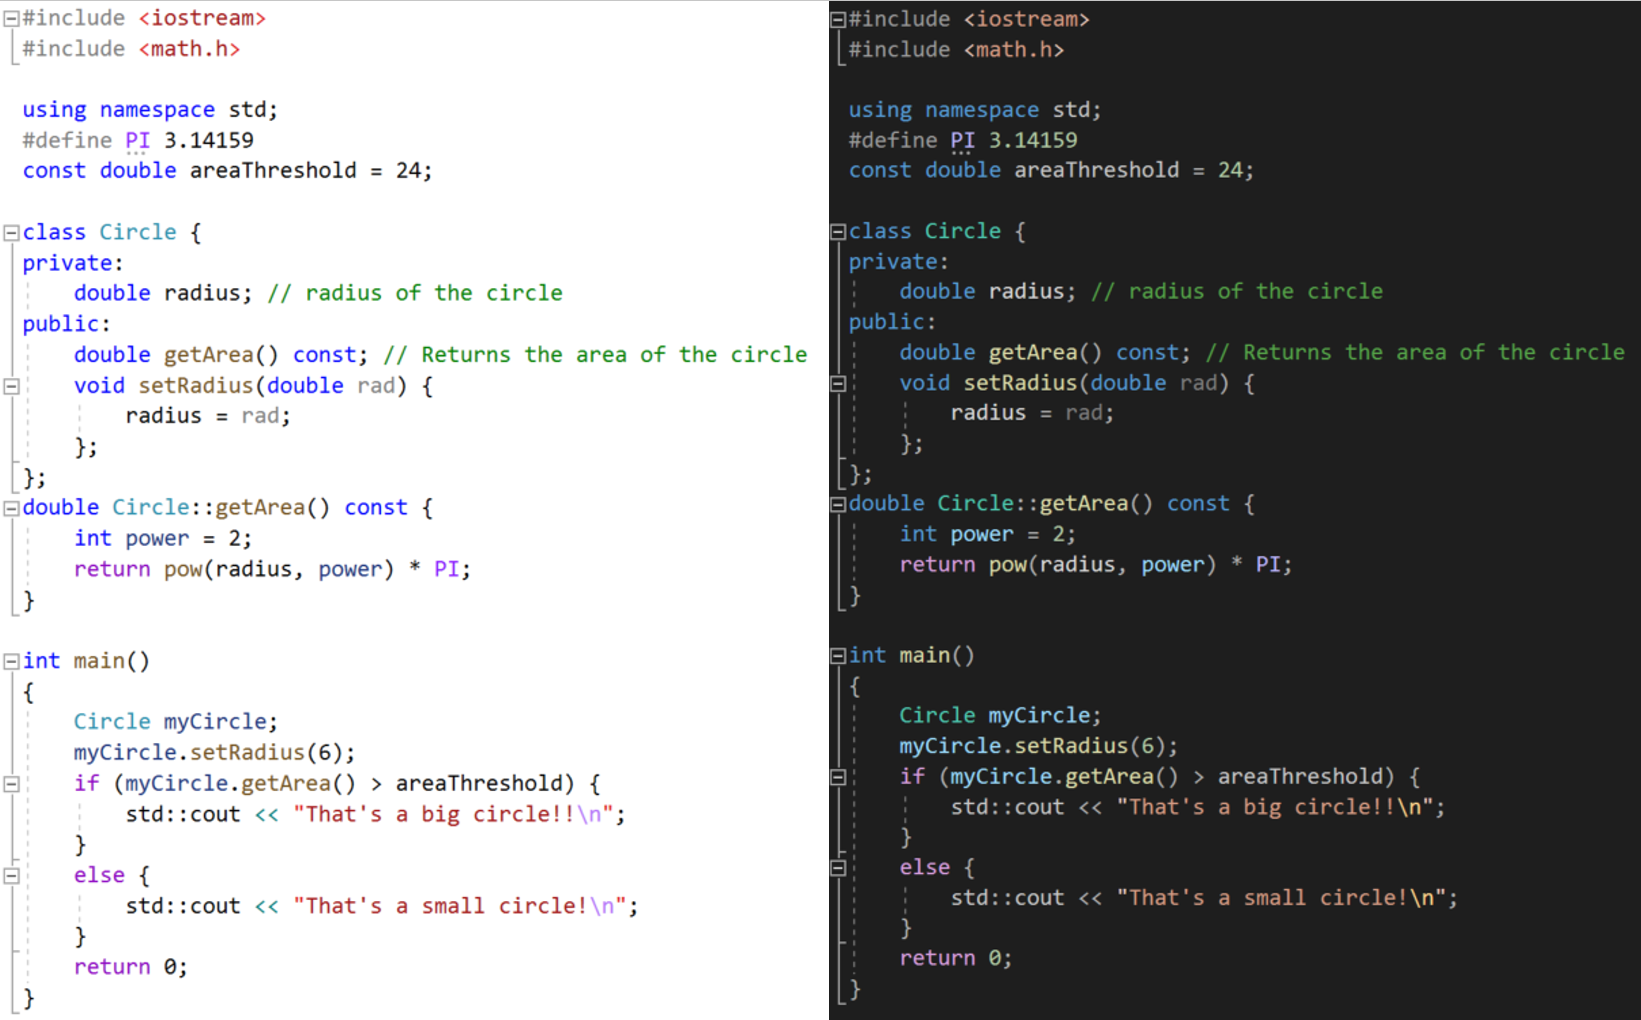
Below are of the Enhanced color scheme for the Light and Dark themes.

Enhanced (Globals vs. Members) Scheme

We also added a preset called “Enhanced (Globals vs. Members)” which is designed to emphasize the scope of your code. In this scheme, global functions and global variables share the same color, while member functions and fields share another color.

For example, notice how “pow” now stands out as a global function.

Visual Studio 2017 Scheme

If you’d like to revert to the Visual Studio 2017 scheme, select the “Visual Studio 2017” preset.

Customizing Individual Colors

We understand that colorization preferences are personal, so if you wish to customize any particular color, you can do so under Tools > Options > Environment > Fonts and Colors.

To use all the default colors, make sure to click “Use Defaults” in the top right.

Template Argument Filtering in Call Stack Window

Previously, when using heavily to moderately templated types (including the STL), the Call Stack window quickly would become overwhelmed with template expansions to the point that became difficult to debug due to poor readability.

Now, you can right-click in the Call Stack Window and toggle “Show Template Arguments” to make room for other important information, and making it much more readable!


IntelliCode On-By-Default

In Visual Studio 2019 version 16.2 we added C++ IntelliCode in-box. In version 16.3 Preview 2, we are taking that a step further and have turned the feature on-by-default. This means that, by default, you’ll start to benefit from autocompletion results recommended by a machine-learned prediction model. The recommended results are surfaced at the top of the completion list and are prepended with stars:

For more details on IntelliCode, check out our other C++ IntelliCode blog posts.

Talk to Us!

If you have feedback on any of these productivity features in Visual Studio, we would love to hear from you. We can be reached via the comments below or via email (visualcpp@microsoft.com). If you encounter other problems with Visual Studio or MSVC or have a suggestion, you can use the Report a Problem tool in Visual Studio or head over to Visual Studio Developer Community. You can also find us on Twitter @VisualC and follow me @nickuhlenhuth.

The post Productivity Improvements for C++: New Default Colorization, Template Argument Filtering in Call Stack Window, and IntelliCode On-By-Default appeared first on C++ Team Blog.

Announcing the general availability of Azure Ultra Disk Storage

$
0
0

Today, we are announcing the general availability (GA) of Microsoft Azure Ultra Disk Storage—a new Managed Disks offering that delivers unprecedented and extremely scalable performance with sub-millisecond latency for the most demanding Azure Virtual Machines and container workloads. With Ultra Disk Storage, customers are now able to lift-and-shift mission critical enterprise applications to the cloud including applications like SAP HANA, top tier SQL databases such as SQL Server, Oracle DB, MySQL, and PostgreSQL, as well as NoSQL databases such as MongoDB and Cassandra.With the introduction of Ultra Disk Storage, Azure now offers four types of persistent disks—Ultra Disk Storage, Premium SSD, Standard SSD, and Standard HDD. This portfolio gives our customers a comprehensive set of disk offerings for every workload.

Ultra Disk Storage is designed to provide customers with extreme flexibility when choosing the right performance characteristics for their workloads. Customers can now have granular control on the size, IOPS, and bandwidth of Ultra Disk Storage to meet their specific performance requirements. Organizations can achieve the maximum I/O limit of a virtual machine (VM) with Ultra Disk Storage without having to stripe multiple disks. Check out the blog post “Azure Ultra Disk Storage: Microsoft's service for your most I/O demanding workloads” from Azure’s Chief Technology Officer, Mark Russinovich, for a deep under-the-hood view.

Since we launched the preview for Ultra Disk Storage last September, our customers have used this capability on Azure on a wide range of workloads and have achieved new levels of performance and scale on the public cloud to maximize their virtual machine performance.

Below are some quotes from customers in our preview program:

“Ultra Disk Storage enabled SEGA to seamlessly migrate from our on-premise datacenter to Azure and take advantage of flexible performance controls.”

– Takaya Segawa, General Manager/Creative Officer, SEGA

“Ultra Disk Storage allows us to achieve incredible write performance for our most demanding PostgreSQL database workloads - giving us the ability to scale our applications in Azure.” 

– Andrew Tindula, Senior IT Manager, Online Trading Academy

Ultra Disk Storage performance characteristics

Ultra Disk Storage offers sizes ranging from 4 GiB up to 64 TiB with granular increments. In addition, it is possible to dynamically configure and scale the IOPS and bandwidth on the disk independent of capacity.

Customers can now maximize disk performance by leveraging:

  • Up to 300 IOPS per GiB, to a maximum of 160K IOPS per disk
  • Up to a maximum of 2000 MBps per disk

Pricing and availability

Ultra Disk is now available in East US 2, North Europe, and Southeast Asia. Please refer to the FAQ for latest supported regions. For pricing details for Ultra Disk, please refer to the pricing page. The general availability price takes effect from October 1, 2019 unless otherwise noted. Customers in preview will automatically transition to GA pricing on this date. No additional action is required by customers in preview.

Get started with Azure Ultra Disk Storage

You can request onboarding to Azure Ultra Disk Storage by submitting an online request or by reaching out to your Microsoft representative.

Azure Ultra Disk Storage: Microsoft’s service for your most I/O demanding workloads

$
0
0

Today, Tad Brockway, Corporate Vice President, Microsoft Azure, announced the general availability of Azure Ultra Disk Storage, an Azure Managed Disks offering that provides massive throughput with sub-millisecond latency for your most I/O demanding workloads. With the introduction of Ultra Disk Storage, Azure includes four types of persistent disk—Ultra Disk Storage, Premium SSD, Standard SSD, and Standard HDD. This portfolio gives you price and performance options tailored to meet the requirements of every workload. Ultra Disk Storage delivers consistent performance and low latency for I/O intensive workloads like SAP Hana, OLTP databases, NoSQL, and other transaction-heavy workloads. Further, you can reach maximum virtual machine (VM) I/O limits with a single Ultra disk, without having to stripe multiple disks.

Durability of data is essential to business-critical enterprise workloads. To ensure we keep our durability promise, we built Ultra Disk Storage on our existing locally redundant storage (LRS) technology, which stores three copies of data within the same availability zone. Any application that writes to storage will receive an acknowledgement only after it has been durably replicated to our LRS system.

Below is a clip from a presentation I delivered at Microsoft Ignite demonstrating the leading performance of Ultra Disk Storage:

for mark's blog[6]

Microsoft Ignite 2018: Azure Ultra Disk Storage demo

Below are some quotes from customers in our preview program:

“With Ultra Disk Storage, we achieved consistent sub-millisecond latency at high IOPS and throughput levels on a wide range of disk sizes. Ultra Disk Storage also allows us to fine tune performance characteristics based on the workload.”

- Amit Patolia, Storage Engineer, DEVON ENERGY

“Ultra Disk Storage provides powerful configuration options that can leverage the full throughput of a VM SKU. The ability to control IOPS and MBps is remarkable.”

- Edward Pantaleone, IT Administrator, Tricore HCM

Inside Ultra Disk Storage

Ultra Disk Storage is our next generation distributed block storage service that provides disk semantics for Azure IaaS VMs and containers. We designed Ultra Disk Storage with the goal of providing consistent performance at high IOPS without compromising our durability promise. Hence, every write operation replicates to the storage in three different racks (fault domains) before being acknowledged to the client. Compared to Azure Premium Storage, Ultra Disk Storage provides its extreme performance without relying on Azure Blob storage cache, our on-server SSD-based cache, and hence it only supports un-cached reads and writes. We also introduced a new simplified client on the compute host that we call virtual disk client (VDC). VDC has full knowledge of virtual disk metadata mappings to disks in the Ultra Disk Storage cluster backing them. That enables the client to talk directly to storage servers, bypassing load balancers and front-end servers used for initial disk connections. This simplified approach minimizes the layers that a read or write operation traverses, reducing latency and delivering performance comparable to enterprise flash disk arrays.

Below is a figure comparing the different layers an operation traverses when issued on an Ultra disk compared to a Premium SSD disk. The operation flows from the client to Hyper-V to the corresponding driver. For an operation done on a Premium SSD disk, the operation will flow from the Azure Blob storage cache driver to the load balancers, front end servers, partition servers then down to the stream layer servers as documented in this paper. For an operation done on an Ultra disk, the operation will flow directly from the virtual disk client to the corresponding storage servers.

Client virual machine diagram

Comparison between the IO flow for Ultra Disk Storage versus Premium SSD Storage

One key benefit of Ultra Disk Storage is that you can dynamically tune disk performance without detaching your disk or restarting your virtual machines. Thus, you can scale performance along with your workload. When you adjust either IOPS or throughput, the new performance settings take effect in less than an hour.

Azure implements two levels of throttles that can cap disk performance, a “leaky bucket” VM level throttle that is specific to each VM size, described in documentation. A key benefit of Ultra Disk Storage is a new time-based disk level throttle that is applied at the disk level. This new throttle system provides more realistic behavior of a disk for a given IOPS and throughput. Hitting a leaky bucket throttle can cause erratic performance, while the new time-based throttle provides consistent performance even at the throttle limit. To take advantage of this smoother performance, set your disk throttles slightly less than your VM throttle. We will publish another blog post in the future describing more details about our new throttle system.

Available regions

Currently, Ultra Disk Storage is available in the following regions:

  • East US 2
  • North Europe
  • Southeast Asia

We will expand the service to more regions soon. Please refer to the FAQ for the latest on supported regions.

Virtual machine sizes

Ultra Disk Storage is supported on DSv3 and ESv3 virtual machine types. Additional virtual machine types will be supported soon. Refer to the FAQ for the latest on supported VM sizes.

Get started today

You can request onboarding to Azure Ultra Disk Storage by submitting an online request or by reaching out to your Microsoft representative. For general availability limitations refer to the documentation.


Code, Recent Items, and Template Search In Visual Studio

$
0
0

Code, Recent Items, and Template Search In Visual Studio

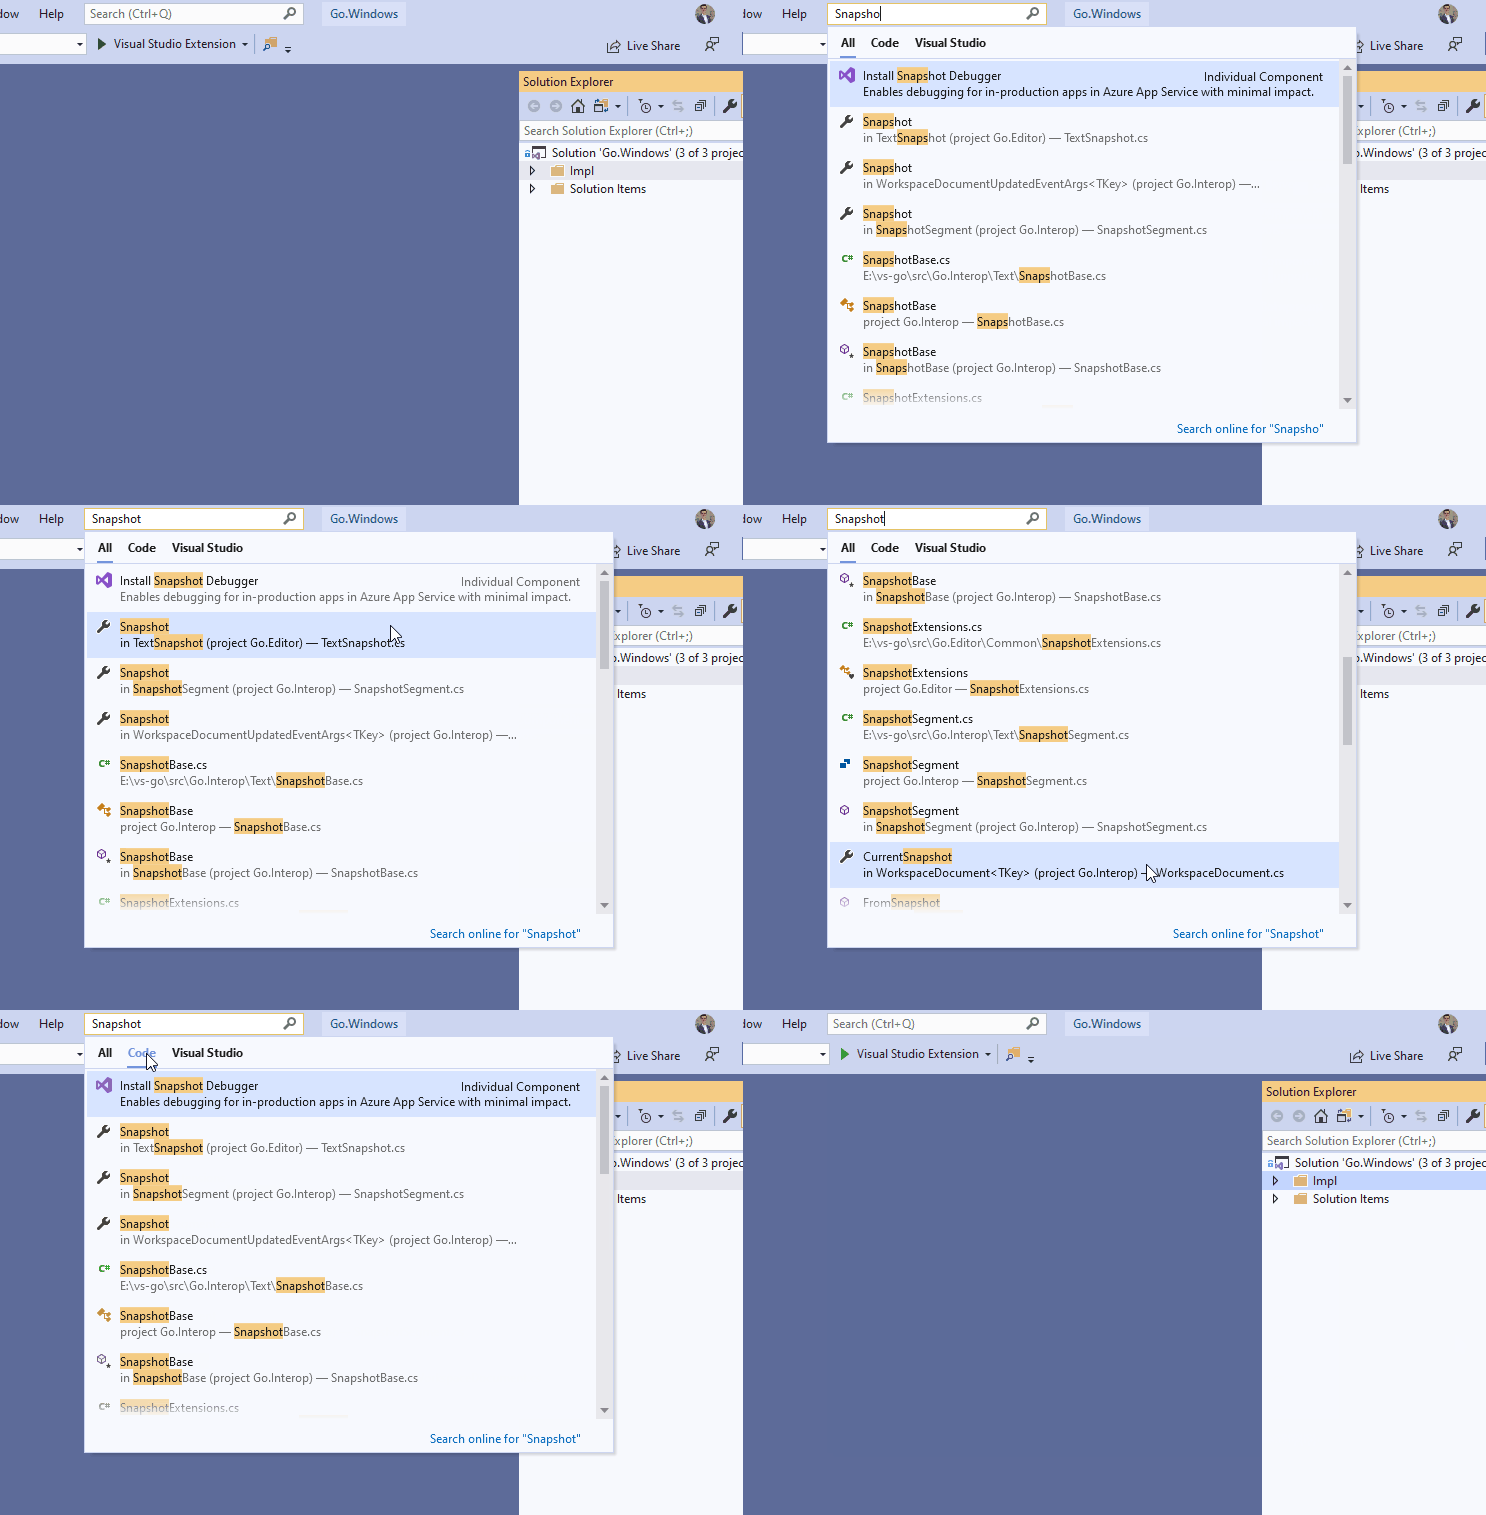
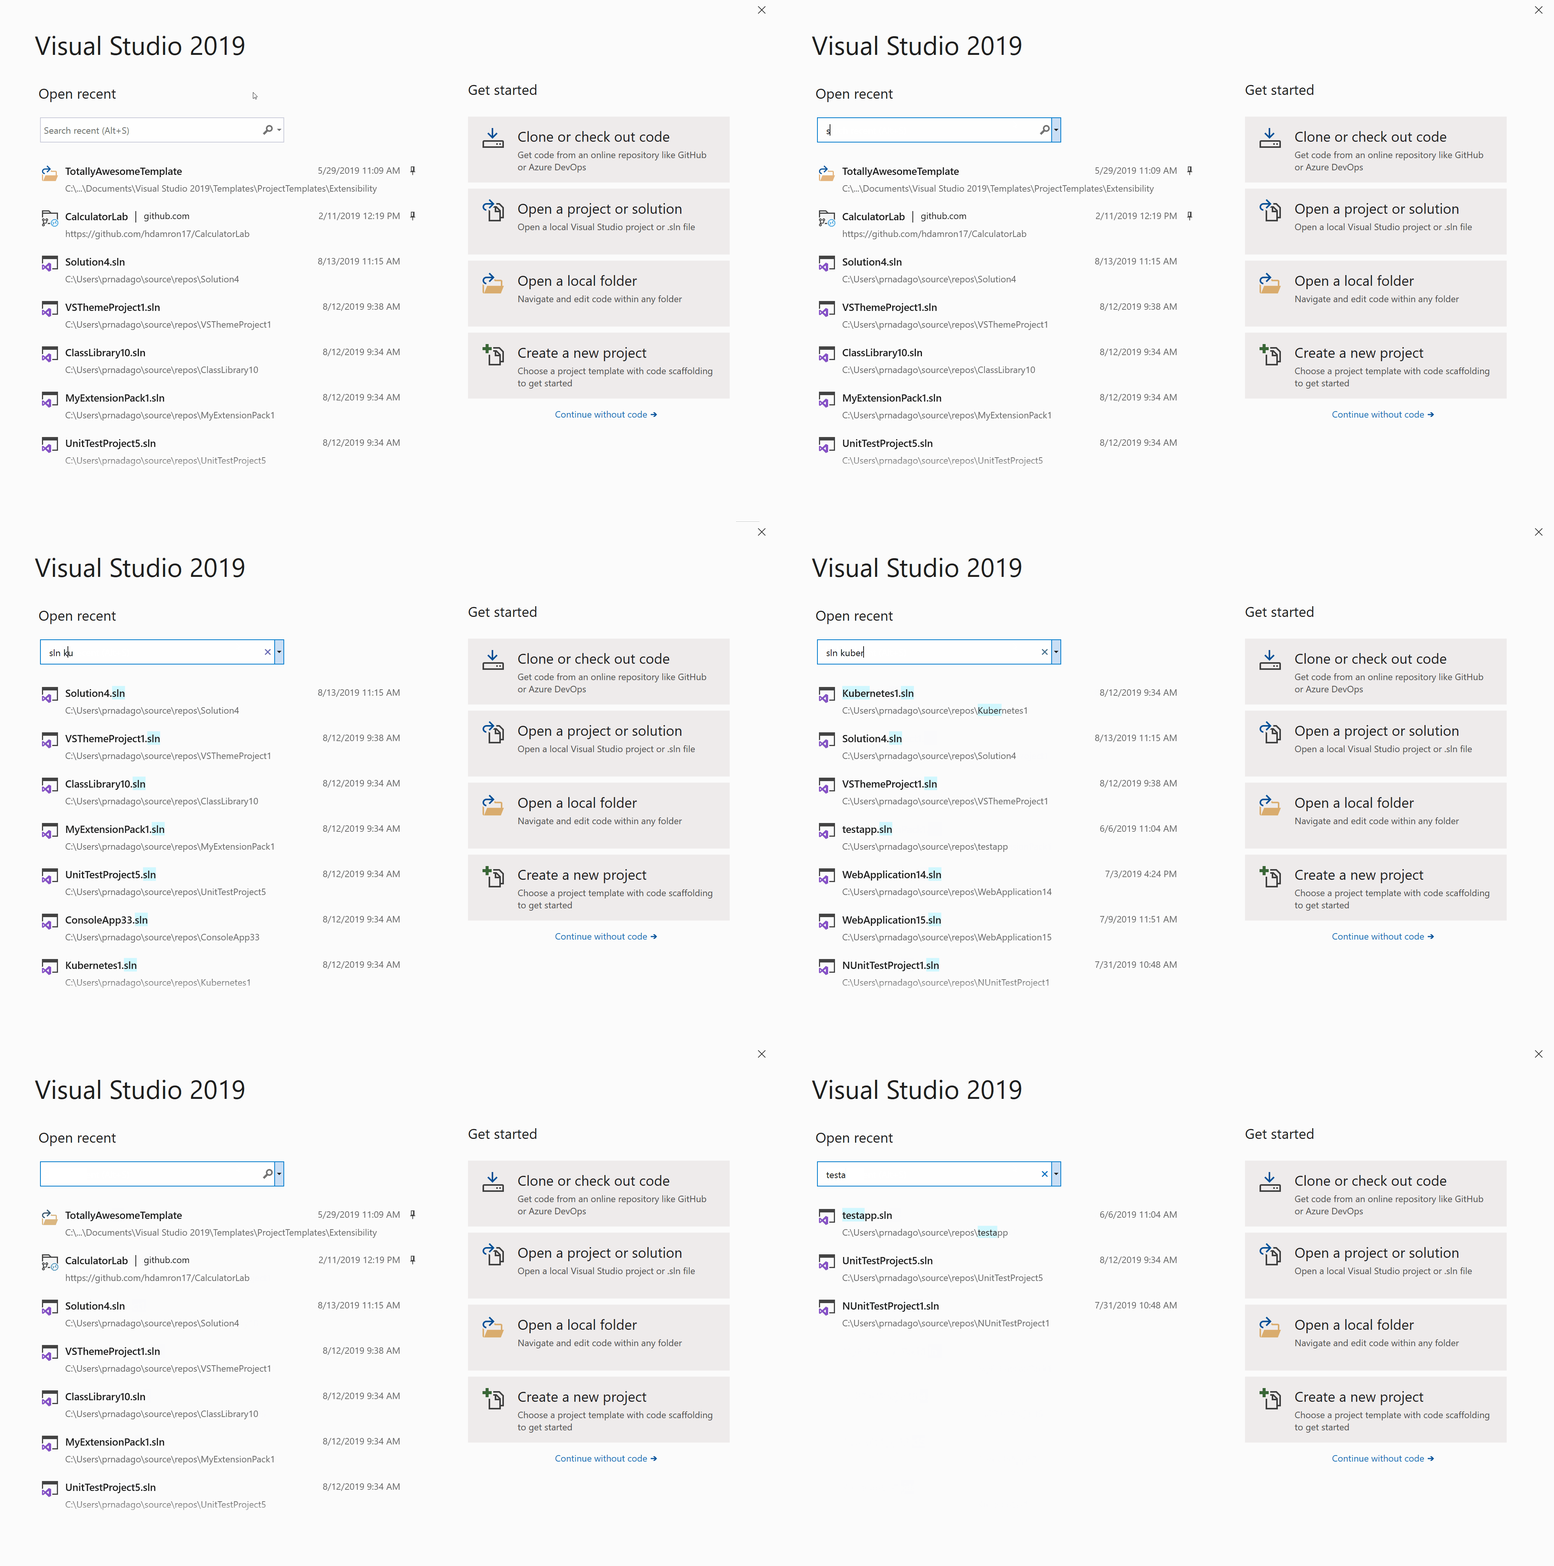
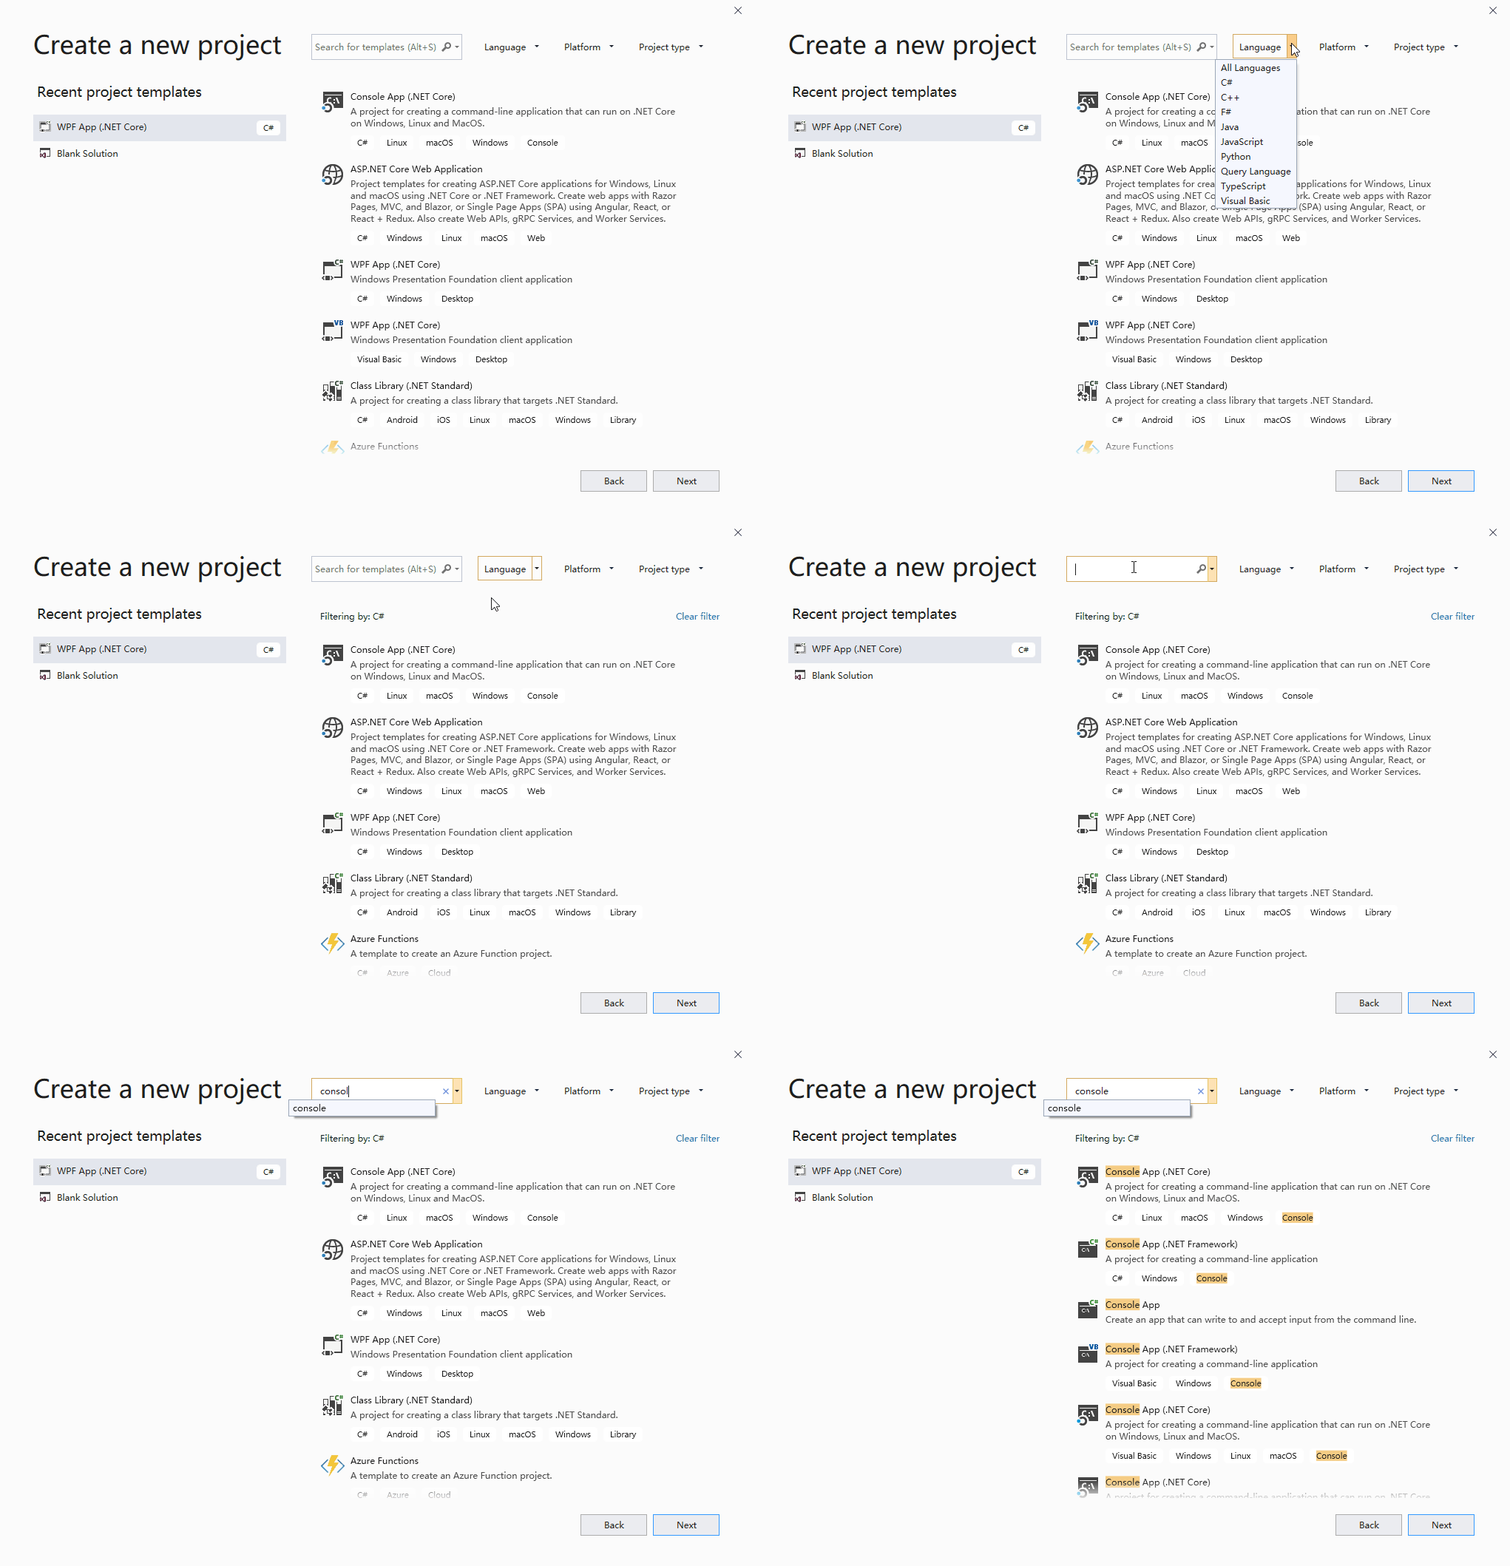
We are introducing the ability to search for code, recent items, and templates through the new search experience in Visual Studio. These features can all be accessed by one single shortcut (Ctrl+Q) and are currently available in our Preview build (https://visualstudio.microsoft.com/vs/preview/). They will be available in Visual Studio 2019, version 16.3, targeted for the end of September.

Background

One of the focus areas in Visual Studio 2019 is to improve search efficiency and effectiveness. Our journey started with the introduction of the new search experience in Visual Studio component (Ctrl+Q), along with improved search accuracy for menus, commands, options, and installable components.

Code Search

Code search has arrived in the search (Ctrl+Q) control. It is now possible to search for types and members with C# and VB, as well as file search for all languages.  Results will show up as you type your search query, as well as in a dedicated ‘Code’ group accessible via keyboard shortcut or mouse click. Keep an eye out for support of additional languages in the near future!

It is also possible to search by camel-case. This allows you to type in an abbreviation of the code search term with just capitalized letters instead of the full name.

Recent Items Search

Recently opened items can be searched through search (Ctrl+Q) and in the start window (Alt+F, W). Both entry points will be enabled with fuzzy search (to help automatically rectify typos) and the ability to see highlighted matches to your search query in the results.

Template Search

Your favorite templates can now be accessed faster when you are starting up Visual Studio, or already in the IDE!  Templates can be accessed through search (Ctrl+Q) and in the “New Project Dialog” (Ctrl+Shift+N). Both entry points will also be enabled with fuzzy search (to help automatically rectify typos), highlighted matches to your search query in the results, and improved ranking to ensure increased accuracy.

What’s Next?

We are continuing to integrate new and easier access to features, commands, and more through our search (Ctrl+Q) component.  These updates will be shared regularly through future blog posts and release notes. Please share any suggestions below, on developer community: https://developercommunity.visualstudio.com/, or use the hashtag #vssearch on Twitter.

The post Code, Recent Items, and Template Search In Visual Studio appeared first on The Visual Studio Blog.

Vcpkg: 2019.07 Update

$
0
0

The 2019.07 update of vcpkg, a tool that helps you manage C and C++ libraries on Windows, Linux, and macOS, is now available. This update is a summary of the new functionality and improvements made to vcpkg over the past month. Last month was the first time we created a vcpkg release (Vcpkg: 2019.06 Update).

In this post, we will cover caching in Azure Pipelines with vcpkg in addition to many new port and triplet updates, improvements for port contributors, and new documentation. For a full list of this release’s improvements, check out our changelog on GitHub.

Caching in Azure Pipelines with vcpkg

The public preview of caching in Azure Pipelines is now available, and you can use it with vcpkg!

You can use pipeline caching to improve build time by allowing previously built and cached vcpkg artifacts (including libraries) to be reused in subsequent runs. This allows you to reduce and avoid the cost to rebuild the same libraries for each build run the same libraries. Caching may be especially useful with vcpkg when you are installing and building the same dependencies (libraries) over and over during your build. That process can often be time-consuming if it involves building large libraries.

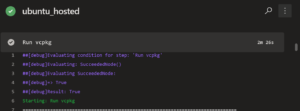
For example, if you have a C++ application that uses SQLite databases, you’ll likely want to use SQLite3 among other libraries. Each time you run a build on your server, you install vcpkg and the sqlite3 library. Without using pipeline caching, this may take some time:

Now, with Azure Pipelines Caching, we can have a much faster and better experience. One of our community contributors and Microsoft employee, Luca Cappa, created a pipeline task to help you use the CacheBeta pipeline task. We’ll show you how leveraging his scripts reduced the ‘run vcpkg’ build step from 2m 26s to just 14s!

CppBuildTasks Azure DevOps Extension with vcpkg

The CppBuildTasks project pipeline task does the following:

So, in the case of SQLite3, vcpkg will be updated and the sqlite3 library will be installed. It is cached in the pipeline such that in subsequent runs you do not need to install and build the sqlite3 library again.

To get started with CppBuildTasks with Azure Pipelines in your project you can follow the simple CppBuildTasks developer documentation.

Looking at the example, there are a few things to note:

variables:
    # Exact vcpkg's version to fetch.    
    vcpkgGitRef: 5a3b46e9e2d1aa753917246c2801e50aaabbbccc

    # Cache the vcpkg's build artifacts.  
  - task: CacheBeta@0    
    displayName: Cache vcpkg    
    inputs:      
      # As 'key' use the content of the response file, vcpkg's commit id and build agent name.      
      # The key must be one liner, each segment separated by pipe, non-path segments enclosed by      
      # double quotes.      
      key: $(Build.SourcesDirectory)/vcpkg_x64-linux.txt | "$(vcpkgGitRef)" | "$(Agent.Name)"      
      path: '$(Build.BinariesDirectory)/vcpkg'

  • vcpkgGitRef is a specific commit ID for the version of vcpkg you would like to install.
  • task: CacheBeta@0 enables pipeline caching in Azure Pipelines.
  • key: $(Build.SourcesDirectory)/vcpkg_x64-linux.txt | "$(vcpkgGitRef)" | "$(Agent.Name)" uses the source directory for the libraries and response file (which contains a list of packages), the commit ID, and the build agent name to generate a hash to use in the build pipeline.

Pipeline Caching with CppBuildTasks Results

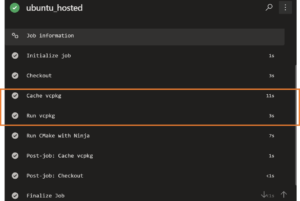
Now, taking a look at installing vcpkg and sqlite3 using the CppBuildTasks script, we can see a remarkable difference in the build time on our Ubuntu server:

Enabling caching reduced the “Run vcpkg” build step from 2m 26s to just 14s (Caching + Run vcpkg).

You can view more examples in the Samples section of the CppBuildTasks GitHub repo.

Ports

We added 37 new ports in the month of July. Some notable additions include: 7zip, basisu, librdkafka, mimalloc, mongoose, and zookeeper. You can view a full list of new ports in our 2019.07 changelog. For a full list of libraries, search for a library name in the GitHub repo ports folder or use the vcpkg search command.

In addition to new ports, we updated 160 existing ports.

Triplets

Vcpkg provides many triplets (target environments) by default. This past month, we continued increasing the number of ports available on Linux – from 823 to 866.

Here is a current list of ports per triplet:

Triplet Ports Available
x64-osx 788
x64-linux 866
x64-windows 1039
x86-windows 1009
x64-windows-static 928
arm64-windows 678
x64-uwp 546
arm-uwp 522

Don’t see a triplet you’d like? You can easily add your own triplets. Details on adding triplets can be found in our documentation.

Improvements for Port Contributors

We also made improvements to the vcpkg infrastructure including a new vcpkg variable and a mechanism to modify and set vcpkg triplet variables on a per port basis. These features are the first steps towards enabling better tool dependencies in vcpkg. Stay tuned!

Passthrough Triplet Variable

Before we added the VCPKG_ENV_PASSTHROUGH triplet variable, the only environment variables on Windows available to the portfile were those found on an allow list hard-coded into vcpkg. This new triplet variable allows us to augment that list with variables defined in the triplet or the environment overrides file.

Environment Overrides

Port authors can add an environment-overrides.cmake file to a port, override, or set, vcpkg triplet variables on a per port basis. For example, this allows ports to specify environment variables that are not allow listed in the vcpkg source to be available to the portfile.

Documentation

We also updated our documentation to reflect these new changes. Check out the following docs for more information on some of the updates outlined in this post in addition to a couple other areas:

Thank you

Thank you to everyone who contributed to vcpkg! We now have 659 total contributors. This release, we’d like to thank the following 11 contributors who made code changes in June:

BillyONeal myd7349
cenit Neumann-A
coryan SuperWig
eao197 tarcila
JackBoosY TartanLlama
jwillemsen


Tell Us What You Think

Install vcpkg, give it a try, and let us know what you think. If you run into any issues, or have any suggestions, please report them on the Issues section of our GitHub repository.

We can be reached via the comments below or via email (vcpkg@microsoft.com). You can also find our team – and me – on Twitter @VisualC and @tara_msft.

The post Vcpkg: 2019.07 Update appeared first on C++ Team Blog.

WebView2Browser: A rich sample for WebView2

$
0
0

At this year’s Build conference in May, we announced the Win32 preview of the WebView2 control powered by the Chromium-based Microsoft Edge. Since then, we have been engaging with the community and partners to collect a great deal of feedback, and delivering SDK updates every six-weeks.

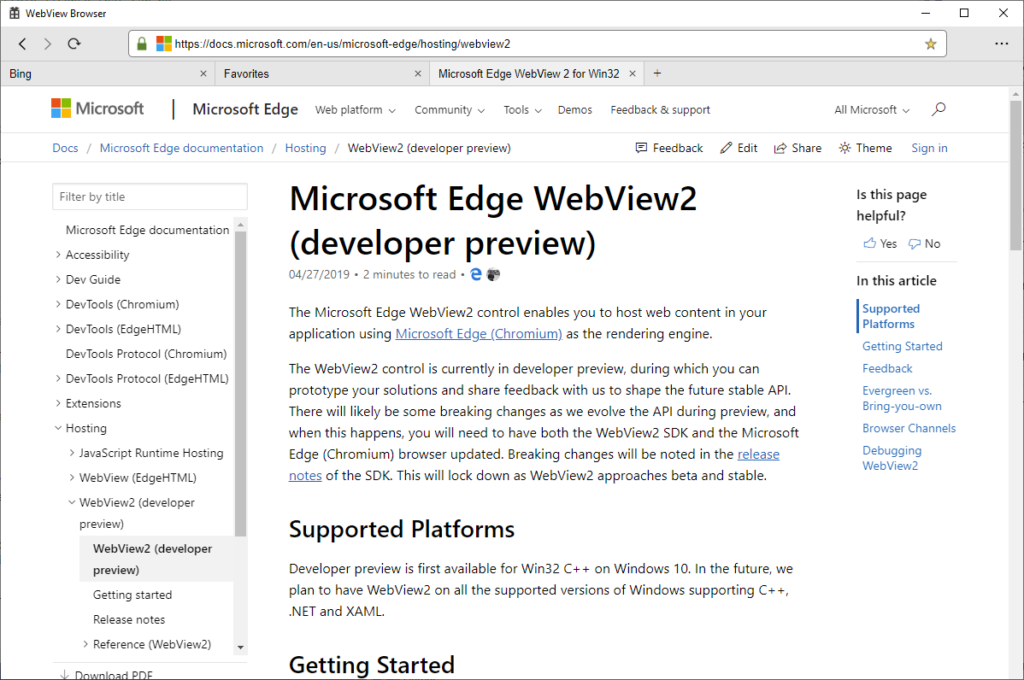
To demonstrate the new WebView’s capabilities, we built a sample browser app (we call it WebView2Browser) using the WebView2 APIs. The intent was to develop a rich sample that benefits other developers building on top of WebView2, and to provide direct feedback to the rest of the WebView2 team from first-hand app-building experience. The sample features an array of functionalities, such as navigation, searching from the address bar, tabs, favorites, history, and verifying a secure connection.

Screen capture showing the WebView2Browser sample app

Get the sample on GitHub

You can read more about WebView2Browser and play with the source code on our GitHub repo. The sample code demonstrates a variety of WebView workflows – from the basics of using navigation APIs and calling JavaScript to retrieve the document title, to more advanced cases such as communicating between multiple WebViews through postMessage and using Chrome DevTools Protocol. The app-building experience also gave us some great ideas for future WebView functionalities – accelerator key event, user data/cache management – just to name a few.

Build your own WebView2 app

Apart from the WebView2Browser sample, you can also learn more about WebView2 through our documentation and getting-started guide. Tell us what you plan to build with WebView2 and we’re excited to hear your thoughts on our feedback repo.

Limin Zhu, Program Manager, Microsoft Edge WebView

The post WebView2Browser: A rich sample for WebView2 appeared first on Microsoft Edge Blog.

C++ Cross-Platform Development with Visual Studio 2019 version 16.3: vcpkg, CMake configuration, remote headers, and WSL

$
0
0

In Visual Studio 2019 you can target both Windows and Linux from the comfort of a single IDEVisual Studio’s native support for CMake lets you open any folder containing C++ code and a CMakeLists.txt file directly in Visual Studio to edit, build, and debug your CMake project on Windows, Linux, and the Windows Subsystem for Linux (WSL). Visual Studio’s MSBuild-based Linux support allows you to create and debug console applications that execute on a remote Linux system or WSL. For either of these scenarios, the Linux development with C++ workload is required.  

Visual Studio 2019 version 16.3 Preview introduces several improvements specific to Visual Studio’s native CMake support and MSBuild-based Linux support. If you are just getting started with Linux development in Visual Studio, I recommend trying our native support for WSL 

Install missing vcpkg packages with a quick action in CMake projects  

Vcpkg helps you manage C and C++ libraries on Windows, Linux, and macOSIn Visual Studio 2019 version 16.3 we have improved vcpkg integration in Visual Studio for CMake projects that are using the vcpkg toolchain file and have run vcpkg integrate install. You will now be prompted to install missing vcpkg packages via a quick action:

Add a missing vcpkg package with a quick fix in Visual Studio 2019

Selecting “Install package…” will automatically install the missing package (and all required dependencies) using vcpkg and route all output to the Output Window.   

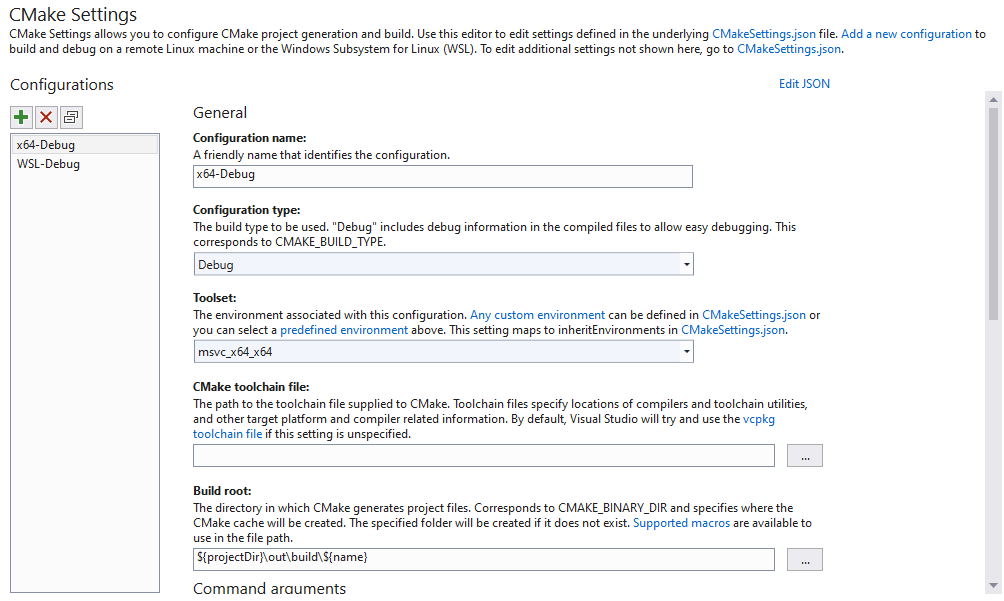
CMake Settings Editor usability improvements  

We’ve made it easier to configure CMake projects in Visual Studio by improving property descriptions in the CMake Settings Editor and providing in-editor links to relevant documentation.  

The CMake Settings Editor has been updated to include improved property descriptions and in-editor links to relevant documentation

The CMake Settings Editor now maps Visual Studio properties to the corresponding CMake variable (e.g. configuration type to CMAKE_BUILD_TYPE) and describes other tools (vcpkg, rsync) that can be configured in Visual Studio.   

Remote header performance improvements for Linux projects 

When you connect to a remote Linux system, Visual Studio automatically copies the include directories for the compiler from the remote system to Windows to provide IntelliSense as if you were working on your remote machine. In Visual Studio 2019 version 16.3 Preview 2 the remote header copy has been optimized and now runs in parallel. This leads to performance improvements for large codebases. For example, the initial remote header sync for MySQL Server now runs ~30% faster. Performance improvements for your own codebase may vary.

These performance improvements apply to both CMake Linux projects and MSBuild-based Linux projects. More IntelliSense improvements for Linux projects are coming soon and will be available in a future release, so stay tuned.  

Improvements to Visual Studio’s native support for WSL  

In Visual Studio 2019 version 16.1 we announced native support for C++ with WSL. This allows you to build and debug on your local WSL installation without adding a remote connection or configuring SSH.  In Visual Studio 2019 version 16.3 Preview we have added support for parallel builds for MSBuild-based Linux projects targeting WSL. You can configure the maximum number of compilation processes to be created in parallel via Properties > C/C++ > General > Max Parallel Compilation Jobs:  

Configure max parallel compilation jobs for Linux applications targeting WSL in Visual Studio

Support for parallel compilation jobs has been added for WSL applications that use gcc or Clang. 

We also added support for WSL build events for MSBuild-based Linux projects targeting WSL. These events allow you to specify a command for the pre-build, pre-link, and post-build event tools to run in the WSL shell and can be configured via Properties > Build Events.   

Configure WSL pre-build, pre-link, and post-build events for Linux applications in Visual Studio

Resolved issues

The best way to report a problem or suggest a feature to the C++ team is via Developer Community. The following feedback tickets related to C++ cross-platform development are resolved in Visual Studio 2019 version 16.3 (some fixes will be available soon in 16.3 Preview 3):  

VS2019 wipes CMake build directory each time I touch CMakeLists.txt 

CTest’s add_test passes incorrect number of arguments to command  

CMake cache generation always deletes build directory if toolchain path has backslashes  

CMake Targets View – Targets have no CMakeLists.txt if add_executable(/library) is called from a function defined in an included file 

CMake MSVC_TOOLSET_VERSION is incorrect in Visual Studio 2019 

VS API issue on CMake solutions in VS 16.2 Preview  

Talk to us!

Do you have feedback on our Linux tooling or CMake support in Visual Studio? We’d love to hear your feedback to help us prioritize and build the right features for you. We can be reached via the comments below, email (visualcpp@microsoft.com), and Twitter (@VisualC). 

The post C++ Cross-Platform Development with Visual Studio 2019 version 16.3: vcpkg, CMake configuration, remote headers, and WSL appeared first on C++ Team Blog.

Announcing TypeScript 3.6 RC

$
0
0

Today we’re happy to announce the availability of the release candidate of TypeScript 3.6. This release candidate is intended to be fairly close to the full release, and will stabilize for the next few weeks leading up to our official release.

To get started using the RC, you can get it through NuGet, or use npm with the following command:

npm install -g typescript@rc

You can also get editor support by

Let’s explore what’s coming in 3.6!

Stricter Generators

TypeScript 3.6 introduces stricter checking for iterators and generator functions. In earlier versions, users of generators had no way to differentiate whether a value was yielded or returned from a generator.

function* foo() {
    if (Math.random() < 0.5) yield 100;
    return "Finished!"
}

let iter = foo();
let curr = iter.next();
if (curr.done) {
    // TypeScript 3.5 and prior thought this was a 'string | number'.
    // It should know it's 'string' since 'done' was 'true'!
    curr.value
}

Additionally, generators just assumed the type of yield was always any.

function* bar() {
    let x: { hello(): void } = yield;
    x.hello();
}

let iter = bar();
iter.next();
iter.next(123); // oops! runtime error!

In TypeScript 3.6, the checker now knows that the correct type for curr.value should be string in our first example, and will correctly error on our call to next() in our last example. This is thanks to some changes in the Iterator and IteratorResult type declarations to include a few new type parameters, and to a new type that TypeScript uses to represent generators called the Generator type.

The Iterator type now allows users to specify the yielded type, the returned type, and the type that next can accept.

interface Iterator<T, TReturn = any, TNext = undefined> {
    // Takes either 0 or 1 arguments - doesn't accept 'undefined'
    next(...args: [] | [TNext]): IteratorResult<T, TReturn>;
    return?(value?: TReturn): IteratorResult<T, TReturn>;
    throw?(e?: any): IteratorResult<T, TReturn>;
}

Building on that work, the new Generator type is an Iterator that always has both the return and throw methods present, and is also iterable.

interface Generator<T = unknown, TReturn = any, TNext = unknown>
        extends Iterator<T, TReturn, TNext> {
    next(...args: [] | [TNext]): IteratorResult<T, TReturn>;
    return(value: TReturn): IteratorResult<T, TReturn>;
    throw(e: any): IteratorResult<T, TReturn>;
    [Symbol.iterator](): Generator<T, TReturn, TNext>;
}

To allow differentiation between returned values and yielded values, TypeScript 3.6 converts the IteratorResult type to a discriminated union type:

type IteratorResult<T, TReturn = any> = IteratorYieldResult<T> | IteratorReturnResult<TReturn>;

interface IteratorYieldResult<TYield> {
    done?: false;
    value: TYield;
}

interface IteratorReturnResult<TReturn> {
    done: true;
    value: TReturn;
}

In short, what this means is that you’ll be able to appropriately narrow down values from iterators when dealing with them directly.

To correctly represent the types that can be passed in to a generator from calls to next(), TypeScript 3.6 also infers certain uses of yield within the body of a generator function.

function* foo() {
    let x: string = yield;
    console.log(x.toUpperCase());
}

let x = foo();
x.next(); // first call to 'next' is always ignored
x.next(42); // error! 'number' is not assignable to 'string'

If you’d prefer to be explicit, you can also enforce the type of values that can be returned, yielded, and evaluated from yield expressions using an explicit return type. Below, next() can only be called with booleans, and depending on the value of done, value is either a string or a number.

/**
 * - yields numbers
 * - returns strings
 * - can be passed in booleans
 */
function* counter(): Generator<number, string, boolean> {
    let i = 0;
    while (true) {
        if (yield i++) {
            break;
        }
    }
    return "done!";
}

var iter = counter();
var curr = iter.next()
while (!curr.done) {
    console.log(curr.value);
    curr = iter.next(curr.value === 5)
}
console.log(curr.value.toUpperCase());

// prints:
//
// 0
// 1
// 2
// 3
// 4
// 5
// DONE!

For more details on the change, see the pull request here.

More Accurate Array Spread

In pre-ES2015 targets, the most faithful emit for constructs like for/of loops and array spreads can be a bit heavy. For this reason, TypeScript uses a simpler emit by default that only supports array types, and supports iterating on other types using the --downlevelIteration flag. Under this flag, the emitted code is more accurate, but is much larger.

--downlevelIteration being off by default works well since, by-and-large, most users targeting ES5 only plan to use iterative constructs with arrays. However, our emit that only supported arrays still had some observable differences in some edge cases.

For example, the following example

[...Array(5)]

is equivalent to the following array.

[undefined, undefined, undefined, undefined, undefined]

However, TypeScript would instead transform the original code into this code:

Array(5).slice();

This is slightly different. Array(5) produces an array with a length of 5, but with no defined property slots!

1 in [undefined, undefined, undefined] // true
1 in Array(3) // false

And when TypeScript calls slice(), it also creates an array with indices that haven’t been set.

This might seem a bit of an esoteric difference, but it turns out many users were running into this undesirable behavior. Instead of using slice() and built-ins, TypeScript 3.6 introduces a new __spreadArrays helper to accurately model what happens in ECMAScript 2015 in older targets outside of --downlevelIteration. __spreadArrays is also available in tslib (which is worth checking out if you’re looking for smaller bundle sizes).

For more information, see the relevant pull request.

Improved UX Around Promises

Promises are one of the most common ways to work with asynchronous data nowadays. Unfortunately, using a Promise-oriented API can often be confusing for users. TypeScript 3.6 introduces some improvements for when Promises are mis-handled.

For example, it’s often very common to forget to .then() or await the contents of a Promise before passing it to another function. TypeScript’s error messages are now specialized, and inform the user that perhaps they should consider using the await keyword.

interface User {
    name: string;
    age: number;
    location: string;
}

declare function getUserData(): Promise<User>;
declare function displayUser(user: User): void;

async function f() {
    displayUser(getUserData());
//              ~~~~~~~~~~~~~
// Argument of type 'Promise<User>' is not assignable to parameter of type 'User'.
//   ...
// Did you forget to use 'await'?
}

It’s also common to try to access a method before await-ing or .then()-ing a Promise. This is another example, among many others, where we’re able to do better.

async function getCuteAnimals() {
    fetch("https://reddit.com/r/aww.json")
        .json()
    //   ~~~~
    // Property 'json' does not exist on type 'Promise<Response>'.
    //
    // Did you forget to use 'await'?
}

The intent is that even if a user is not aware of await, at the very least, these messages provide some more context on where to go from here.

In the same vein of discoverability and making your life easier – apart from better error messages on Promises, we now also provide quick fixes in some cases as well.

Quick fixes being applied to add missing 'await' keywords.

For more details, see the originating issue, as well as the pull requests that link back to it.

Better Unicode Support for Identifiers

TypeScript 3.6 contains better support for Unicode characters in identifiers when emitting to ES2015 and later targets.

const 𝓱𝓮𝓵𝓵𝓸 = "world"; // previously disallowed, now allowed in '--target es2015'

import.meta Support in SystemJS

TypeScript 3.6 supports transforming import.meta to context.meta in when your module target is set to system.

// This module:

console.log(import.meta.url)

// gets turned into the following:

System.register([], function (exports, context) {
  return {
    setters: [],
    execute: function () {
      console.log(context.meta.url);
    }
  };
});

get and set Accessors Are Allowed in Ambient Contexts

In previous versions of TypeScript, the language didn’t allow get and set accessors in ambient contexts (like in declare-d classes, or in .d.ts files in general). The rationale was that accessors weren’t distinct from properties as far as writing and reading to these properties; however, because ECMAScript’s class fields proposal may have differing behavior from in existing versions of TypeScript, we realized we needed a way to communicate this different behavior to provide appropriate errors in subclasses.

As a result, users can write getters and setters in ambient contexts in TypeScript 3.6.

declare class Foo {
    // Allowed in 3.6+.
    get x(): number;
    set x(val: number): void;
}

In TypeScript 3.7, the compiler itself will take advantage of this feature so that generated .d.ts files will also emit get/set accessors.

Ambient Classes and Functions Can Merge

In previous versions of TypeScript, it was an error to merge classes and functions under any circumstances. Now, ambient classes and functions (classes/functions with the declare modifier, or in .d.ts files) can merge. This means that now you can write the following:

export declare function Point2D(x: number, y: number): Point2D;
export declare class Point2D {
    x: number;
    y: number;
    constructor(x: number, y: number);
}

instead of needing to use

export interface Point2D {
    x: number;
    y: number;
}
export declare var Point2D: {
    (x: number, y: number): Point2D;
    new (x: number, y: number): Point2D;
}

One advantage of this is that the callable constructor pattern can be easily expressed while also allowing namespaces to merge with these declarations (since var declarations can’t merge with namespaces).

In TypeScript 3.7, the compiler will take advantage of this feature so that .d.ts files generated from .js files can appropriately capture both the callability and constructability of a class-like function.

For more details, see the original PR on GitHub.

APIs to Support --build and --incremental

TypeScript 3.0 introduced support for referencing other and building them incrementally using the --build flag. Additionally, TypeScript 3.4 introduced the --incremental flag for saving information about previous compilations to only rebuild certain files. These flags were incredibly useful for structuring projects more flexibly and speeding builds up. Unfortunately, using these flags didn’t work with 3rd party build tools like Gulp and Webpack. TypeScript 3.6 now exposes two sets of APIs to operate on project references and incremental program building.

For creating --incremental builds, users can leverage the createIncrementalProgram and createIncrementalCompilerHost APIs. Users can also re-hydrate old program instances from .tsbuildinfo files generated by this API using the newly exposed readBuilderProgram function, which is only meant to be used as for creating new programs (i.e. you can’t modify the returned instance – it’s only meant to be used for the oldProgram parameter in other create*Program functions).

For leveraging project references, a new createSolutionBuilder function has been exposed, which returns an instance of the new type SolutionBuilder.

For more details on these APIs, you can see the original pull request.

Semicolon-Aware Code Edits

Editors like Visual Studio and Visual Studio Code can automatically apply quick fixes, refactorings, and other transformations like automatically importing values from other modules. These transformations are powered by TypeScript, and older versions of TypeScript unconditionally added semicolons to the end of every statement; unfortunately, this disagreed with many users’ style guidelines, and many users were displeased with the editor inserting semicolons.

TypeScript is now smart enough to detect whether your file uses semicolons when applying these sorts of edits. If your file generally lacks semicolons, TypeScript won’t add one.

For more details, see the corresponding pull request.

Smarter Auto-Import Syntax

JavaScript has a lot of different module syntaxes or conventions: the one in the ECMAScript standard, the one Node already supports (CommonJS), AMD, System.js, and more! For the most part, TypeScript would default to auto-importing using ECMAScript module syntax, which was often inappropriate in certain TypeScript projects with different compiler settings, or in Node projects with plain JavaScript and require calls.

TypeScript 3.6 is now a bit smarter about looking at your existing imports before deciding on how to auto-import other modules. You can see more details in the original pull request here.

Breaking Changes

String-Named Methods Named "constructor" Are Constructors

As per the ECMAScript specification, class declarations with methods named constructor are now constructor functions, regardless of whether they are declared using identifier names, or string names.

class C {
    "constructor"() {
        console.log("I am the constructor now.");
    }
}

A notable exception, and the workaround to this break, is using a computed property whose name evaluates to "constructor".

class D {
    ["constructor"]() {
        console.log("I'm not a constructor - just a plain method!");
    }
}

DOM Updates

Many declarations have been removed or changed within lib.dom.d.ts. This includes (but isn’t limited to) the following:

  • The global window is no longer defined as type Window – instead, it is defined as type Window & typeof globalThis. Instead use typeof window.
  • GlobalFetch is gone. Instead, use WindowOrWorkerGlobalScope
  • Certain non-standard properties on Navigator are gone.
  • The experimental-webgl context is gone. Instead, use webgl or webgl2.

If you believe a change has been made in error, please file an issue!

JSDoc Comments Don’t Merge

In JavaScript files, TypeScript will only consult immediately preceding JSDoc comments to figure out declared types.

/**
 * @param {string} arg
 */
/**
 * oh, hi, were you trying to type something?
 */
function whoWritesFunctionsLikeThis(arg) {
    // 'arg' has type 'any'
}

Keywords Cannot Contain Escape Sequences

Previously keywords were not allowed to contain escape sequences. TypeScript 3.6 disallows them.

while (true) {
    u0063ontinue;
//  ~~~~~~~~~~~~~
//  error! Keywords cannot contain escape characters.
}

What’s Next?

TypeScript 3.6 is slated for the end of this month. We hope you give this release a shot and let us know how things work. If you have any suggestions or run into any problems, don’t be afraid to drop by the issue tracker and open up an issue!

Happy Hacking!

– Daniel Rosenwasser and the TypeScript Team

The post Announcing TypeScript 3.6 RC appeared first on TypeScript.

Understanding delta file changes and merge conflicts in Git pull requests

$
0
0

A while ago I worked on a support request with a user reporting unexpected behavior from Git when completing a big and long-living pull request using Azure Repos. This pull request had known conflicts but also some missing changes on files and paths where there were no merge conflicts detected at all. This made me think Git was indeed, as user was reporting, ignoring some changes on its own. Long story short, it was not.

Let’s dig into this and hopefully help anyone using Git to understand the key processes of a Git pull request and the whys of the resulting changes of the merge operation to happen at the end of it.

Delta file changes for a Git pull request

The changes to be applied at completion of a pull request are the result of merging the head of the source branch against the head of the target branch. To refer to these changes we use the term delta file changes (Δchanges). The method Git uses to determine these changes is by comparing the heads of both branches from the merge-base commit.

Diagram showing a Git tree and the merge base node

Any commit before the merge-base commit will not be considered because it is part of both branches. When the source branch has grown so big that it is difficult to find the merge-base commit in the history you can run:

git merge-base refs/heads/master refs/heads/dev

For this example, the target branch is named master and the source branch is named dev. The result of this command will be the SHA value for the merge-base commit.

This will allow you to identify which is the merge-base commit. All the commits made on the source branch after the merge-base commit will be considered as Δchanges. These are the commits that will be listed in the commits tab for your pull request.

Tip:
You can pass any type of Git reference to the merge-base command. You can also combine them:
– Explicit SHA values e.g., 5901ba2, 6b26d9e, 5597095
– Tags e.g., refs/tags/alpha, refs/tags/v1.1
– Remotes e.g., refs/remotes/origin/master

Merge conflicts in Git pull requests

There will be conflicts in the pull request when both the source branch and the target branch contain matching changes after the merge-base commit. This means both branches grew in parallel after the source branch was cut-off from the target branch and at some point, both branches made changes to the same file.

Git is especially good at tracking changes for text/code files. If the file is not a text/code file (such as images, videos etc), then Git will consider any change as a new version of the file.

Diagram showing merge conflicts

In this diagram we show an example of a merge conflict, both branches received a commit on the file abstracted in the shape of a square. If we attempt to merge these branches Git won’t know which version of the file you intend to keep as final; we call these competing files.

For competing files you’ll have to mimic a sync between the branches by committing the version you want to keep on either branch. Git makes this easy by adding some conflict markers to the lines of the file in both branches after the conflict has been detected, see Resolving a merge conflict using the command line.

Git ignoring file changes after a pull request completion with no conflicts

Remember we said Git would determine which changes to apply based on the merge-base commit? Let’s elaborate a more complicated scenario to demonstrate this.

Reversed Δchanges

Which is the final version for file abstracted as a square?
In this example a user modified the file in the source branch and then rolled it back to the way it was at the merge-base commit expecting Git to set this version as the final one for the merge operation.

However, Git compared the version of the file from the merge-base commit against the HEAD of the source branch and determined there were no changes on it and therefore it ignored it. At the same time the target branch received a change on the same file and since there was no input on this file from Git on the source branch, it remained untouched and with no conflicts after the merge operation was completed. Keep in mind this behavior applies not only at a file level but at a line level for text/code files.

From the perspective of a support engineer, my suggestion to developers experiencing unexpected results from a merge operation is to identify the head of the source branch at the moment of a pull request completion and compare it to the merge-base commit by running the git merge-base command. After all this being said we can narrow down the possible scenarios to merge conflicts and unexpected resulting changes applied. If the issue remains unclear, we’ll be happy to help you in the Customer Service and Support team for Azure DevOps.

The post Understanding delta file changes and merge conflicts in Git pull requests appeared first on Azure DevOps Blog.

Top Stories from the Microsoft DevOps Community – 2019.08.16

$
0
0

DevOps is making strides into the data realm. Whether we call it DataOps, MLOps, or simply CI/CD for Data, it is becoming easier to automate schema updates and data transformation processes. This week the community shared some excellent articles on the topic.

No interest in data? No worries! There is some content for the front-end developers as well!

Create Multi Stage YAML CI/CD pipeline for deploying database changes using Maven, Liquibase and Azure DevOps
Database schema changes have always been more difficult to automate than updates to code, and despite the industry efforts, most databases out there are still updated manually. In this post, Mohit Goyal is taking on the challenge of creating a database CI/CD pipeline using Liquibase and Maven in Azure YAML pipelines. Using a strategy like this can help you keep your schema changes in source control, and progressively roll them out to all of your environments!

Using DBT to Execute ELT Pipelines in Snowflake
Taking it a step further, John Aven is bringing DevOps into data transformation. John’s post describes using an open-source Data Build Tool (DBT) to create an Extract Load and Transform (ELT) pipeline with Azure YAML pipelines, using DBT to compile, test and run the data transformation “models”. The ability to test your changes can truly make a difference!

DevOps In Azure With Databricks And Data Factory
Since we’ve started on the Data path, I will also bring in a slightly older post by Alexandre Gattiker. The post features a detailed walkthrough of an Azure DevOps CI/CD pipeline for Azure Data Bricks and Azure Data Factory based Big Data application which predicts bike rentals using time and weather information.

Azure DevOps ReactJS Unified Build and Release
Bringing it back to the front-end development, let’s look at a YAML pipeline for a ReactJS application. In this post, Dara Oladapo is building and deploying a ReactJS application onto an Azure App Service on Linux using a Linux agent in Azure YAML Pipelines. Dara also shared his full YAML pipeline on GitHub here. Great work leveraging the new multi-stage CI/CD YAML pipelines!

Build your Jekyll site and Deploy it on GitHub Pages with an Azure DevOps pipeline
And for those who would like to avoid dealing with any type of database, there are always static websites! In this post, Xavier Geerinck walks us through his experience of moving a Jekyll website build and deploy pipeline from Travis CI to Azure DevOps. Xavier is working with a GitHub repo and YAML pipelines on an Ubuntu agent.

If you’ve written an article about Azure DevOps or find some great content about DevOps on Azure, please share it with the #AzureDevOps hashtag on Twitter!

The post Top Stories from the Microsoft DevOps Community – 2019.08.16 appeared first on Azure DevOps Blog.


Azure Archive Storage expanded capabilities: faster, simpler, better

$
0
0

Since launching Azure Archive Storage, we have seen unprecedented interest and innovative usage from a variety of industries. Archive Storage is built as a scalable service for cost-effectively storing rarely accessed data for long periods of time. Cold data such as application backups, healthcare records, autonomous driving recordings, etc. that might have been previously deleted could be stored in Azure Storage’s Archive tier in an offline state, then rehydrated to an online tier when needed. Earlier this month, we made Azure Archive Storage even more affordable by reducing prices by up to 50 percent in some regions, as part of our commitment to provide the most cost-effective data storage offering.

We’ve gathered your feedback regarding Azure Archive Storage, and today, we’re happy to share three archive improvements in public preview that make our service even better.

1. Priority retrieval from Azure Archive

To read data stored in Azure Archive Storage, you must first change the tier of the blob to hot or cool. This process is known as rehydration and takes a matter of hours to complete. Today we’re sharing the public preview release of priority retrieval from archive allowing for much faster offline data access. Priority retrieval allows you to flag the rehydration of your data from the offline archive tier back into an online hot or cool tier as a high priority action. By paying a little bit more for the priority rehydration operation, your archive retrieval request is placed in front of other requests and your offline data is expected to be returned in less than one hour.

Priority retrieval is recommended to be used for emergency requests for a subset of an archive dataset. For the majority of use cases, our customers plan for and utilize standard archive retrievals which complete in less than 15 hours. But on rare occasions, a retrieval time of an hour or less is required. Priority retrieval requests can deliver archive data in a fraction of the time of a standard retrieval operation, allowing our customers to quickly resume business as usual. For more information, please see Blob Storage Rehydration.

The archive retrieval options now provided under the optional parameter are:

  • Standard rehydrate-priority is the new name for what Archive has provided over the past two years and is the default option for archive SetBlobTier and CopyBlob requests, with retrievals taking up to 15 hours.
  • High rehydrate-priority fulfills the need for urgent data access from archive, with retrievals for blobs under ten GB, typically taking less than one hour.

Regional priority retrieval demand at the time of request can affect the speed at which your data rehydration is completed. In most scenarios, a high rehydrate-priority request may return your Archive data in under one hour. In the rare scenario where archive receives an exceptionally large amount of concurrent high rehydrate-priority requests, your request will still be prioritized over standard rehydrate-priority but may take one to five hours to return your archive data. In the extremely rare case that any high rehydrate-priority requests take over five hours to return archive blobs under a few GB, you will not be charged the priority retrieval rates.

2. Upload blob direct to access tier of choice (hot, cool, or archive)

Blob-level tiering for general-purpose v2 and blob storage accounts allows you to easily store blobs in the hot, cool, or archive access tiers all within the same container. Previously when you uploaded an object to your container, it would inherit the access tier of your account and the blob’s access tier would show as hot (inferred) or cool (inferred) depending on your account configuration settings. As data usage patterns change, you would change the access tier of the blob manually with the SetBlobTier API or automate the process with blob lifecycle management rules.

Today we’re sharing the public preview release of Upload Blob Direct to Access tier, which allows you to upload your blob using PutBlob or PutBlockList directly to the access tier of your choice using the optional parameter x-ms-access-tier. This allows you to upload your object directly into the hot, cool, or archive tier regardless of your account’s default access tier setting. This new capability makes it simple for customers to upload objects directly to Azure Archive in a single transaction. For more information, please see Blob Storage Access Tiers.

3. CopyBlob enhanced capabilities

In certain scenarios, you may want to keep your original data untouched but work on a temporary copy of the data. This holds especially true for data in Archive that needs to be read but still kept in Archive. The public preview release of CopyBlob enhanced capabilities builds upon our existing CopyBlob API with added support for the archive access tier, priority retrieval from archive, and direct to access tier of choice.

The CopyBlob API is now able to support the archive access tier; allowing you to copy data into and out of the archive access tier within the same storage account. With our access tier of choice enhancement, you are now able to set the optional parameter x-ms-access-tier to specify which destination access tier you would like your data copy to inherit. If you are copying a blob from the archive tier, you will also be able to specify the x-ms-rehydrate-priority of how quickly you want the copy created in the destination hot or cool tier. Please see Blob Storage Rehydration and the following table for information on the new CopyBlob access tier capabilities.


Hot tier source

Cool tier source

Archive tier source

Hot tier destination

Supported

Supported

Supported within the same account; pending rehydrate

Cool tier destination

Supported

Supported

Supported within the same account; pending rehydrate

Archive tier destination

Supported

Supported

Unsupported

Getting Started

All of the features discussed today (upload blob direct to access tier, priority retrieval from archive, and CopyBlob enhancements) are supported by the most recent releases of the Azure Portal, .NET Client Library, Java Client Library, Python Client Library. As always you can also directly use the Storage Services REST API (version 2019-02-02 and greater). In general, we always recommend using the latest version regardless of whether you are using these new features.

Build it, use it, and tell us about it!

We will continue to improve our Archive and Blob Storage services and are looking forward to hearing your feedback about these features through email at ArchiveFeedback@microsoft.com. As a reminder, we love hearing all of your ideas and suggestions about Azure Storage, which you can post at Azure Storage feedback forum.

Thanks, from the entire Azure Storage Team!

Announcing the general availability of Python support in Azure Functions

$
0
0

Python support for Azure Functions is now generally available and ready to host your production workloads across data science and machine learning, automated resource management, and more. You can now develop Python 3.6 apps to run on the cross-platform, open-source Functions 2.0 runtime. These can be published as code or Docker containers to a Linux-based serverless hosting platform in Azure. This stack powers the solution innovations of our early adopters, with customers such as General Electric Aviation and TCF Bank already using Azure Functions written in Python for their serverless production workloads. Our thanks to them for their continued partnership!

In the words of David Havera, blockchain Chief Technology Officer of the GE Aviation Digital Group, "GE Aviation Digital Group's hope is to have a common language that can be used for backend Data Engineering to front end Analytics and Machine Learning. Microsoft have been instrumental in supporting this vision by bringing Python support in Azure Functions from preview to life, enabling a real world data science and Blockchain implementation in our TRUEngine project."

Throughout the Python preview for Azure Functions we gathered feedback from the community to build easier authoring experiences, introduce an idiomatic programming model, and create a more performant and robust hosting platform on Linux. This post is a one-stop summary for everything you need to know about Python support in Azure Functions and includes resources to help you get started using the tools of your choice.

Bring your Python workloads to Azure Functions

Many Python workloads align very nicely with the serverless model, allowing you to focus on your unique business logic while letting Azure take care of how your code is run. We’ve been delighted by the interest from the Python community and by the productive solutions built using Python on Functions.

Workloads and design patterns

While this is by no means an exhaustive list, here are some examples of workloads and design patterns that translate well to Azure Functions written in Python.

Simplified data science pipelines

Python is a great language for data science and machine learning (ML). You can leverage the Python support in Azure Functions to provide serverless hosting for your intelligent applications. Consider a few ideas:

  • Use Azure Functions to deploy a trained ML model along with a scoring script to create an inferencing application.

Azure Functions inferencing app

  • Leverage triggers and data bindings to ingest, move prepare, transform, and process data using Functions.
  • Use Functions to introduce event-driven triggers to re-training and model update pipelines when new datasets become available.

Automated resource management

As an increasing number of assets and workloads move to the cloud, there's a clear need to provide more powerful ways to manage, govern, and automate the corresponding cloud resources. Such automation scenarios require custom logic that can be easily expressed using Python. Here are some common scenarios:

  • Process Azure Monitor alerts generated by Azure services.
  • React to Azure events captured by Azure Event Grid and apply operational requirements on resources.

Event-driven automated resource management

  • Leverage Azure Logic Apps to connect to external systems like IT service management, DevOps, or monitoring systems while processing the payload with a Python function.
  • Perform scheduled operational tasks on virtual machines, SQL Server, web apps, and other Azure resources.

Powerful programming model

To power accelerated Python development, Azure Functions provides a productive programming model based on event triggers and data bindings. The programming model is supported by a world class end-to-end developer experience that spans from building and debugging locally to deploying and monitoring in the cloud.

The programming model is designed to provide a seamless experience for Python developers so you can quickly start writing functions using code constructs that you're already familiar with, or import existing .py scripts and modules to build the function. For example, you can implement your functions as asynchronous coroutines using the async def qualifier or send monitoring traces to the host using the standard logging module. Additional dependencies to pip install can be configured using the requirements.txt file.

Azure Functions programming model

With the event-driven programming model in Functions, based on triggers and bindings, you can easily configure the events that will trigger the function execution and any data sources the function needs to orchestrate with. This model helps increase productivity when developing apps that interact with multiple data sources by reducing the amount of boilerplate code, SDKs, and dependencies that you need to manage and support. Once configured, you can quickly retrieve data from the bindings or write back using the method attributes of your entry-point function. The Python SDK for Azure Functions provides a rich API layer for binding to HTTP requests, timer events, and other Azure services, such as Azure Storage, Azure Cosmos DB, Service Bus, Event Hubs, or Event Grid, so you can use productivity enhancements like autocomplete and Intellisense when writing your code. By leveraging the Azure Functions extensibility model, you can also bring your own bindings to use with your function, so you can also connect to other streams of data like Kafka or SignalR.

Azure Functions queue trigger example

Easier development

As a Python developer, you can use your preferred tools to develop your functions. The Azure Functions Core Tools will enable you to get started using trigger-based templates, run locally to test against real-time events coming from the actual cloud sources, and publish directly to Azure, while automatically invoking a server-side dependency build on deployment. The Core Tools can be used in conjunction with the IDE or text editor of your choice for an enhanced authoring experience.

You can also choose to take advantage of the Azure Functions extension for Visual Studio Code for a tightly integrated editing experience to help you create a new app, add functions, and deploy, all within a matter of minutes. The one-click debugging experience enables you to test your functions locally, set breakpoints in your code, and evaluate the call stack, simply with the press of F5. Combine this with the Python extension for Visual Studio Code, and you have an enhanced Python development experience with auto-complete, Intellisense, linting, and debugging.

Azure Functions Visual Studio Code development

For a complete continuous delivery experience, you can now leverage the integration with Azure Pipelines, one of the services in Azure DevOps, via an Azure Functions-optimized task to build the dependencies for your app and publish them to the cloud. The pipeline can be configured using an Azure DevOps template or through the Azure CLI.

Advance observability and monitoring through Azure Application Insights is also available for functions written in Python, so you can monitor your apps using the live metrics stream, collect data, query execution logs, and view the distributed traces across a variety of services in Azure.

Host your Python apps with Azure Functions

Host your Python apps with the Azure Functions Consumption plan or the Azure Functions Premium plan on Linux.

The Consumption plan is now generally available for Linux-based hosting and ready for production workloads. This serverless plan provides event-driven dynamic scale and you are charged for compute resources only when your functions are running. Our Linux plan also now has support for managed identities, allowing your app to seamlessly work with Azure resources such as Azure Key Vault, without requiring additional secrets.

Azure Functions Linux Consumption managed identities

The Consumption plan for Linux hosting also includes a preview of integrated remote builds to simplify dependency management. This new capability is available as an option when publishing via the Azure Functions Core Tools and enables you to build in the cloud on the same environment used to host your apps as opposed to configuring your local build environment in alignment with Azure Functions hosting.

Python remote build with Azure Functions

Workloads that require advanced features such as more powerful hardware, the ability to keep instances warm indefinitely, and virtual network connectivity can benefit from the Premium plan with Linux-based hosting now available in preview.

Azure Functions Premium plan virtual network integration

With the Premium plan for Linux hosting you can choose between bringing only your app code or bringing a custom Docker image to encapsulate all your dependencies, including the Azure Functions runtime as described in the documentation “Create a function on Linux using a custom image.” Both options benefit from avoiding cold start and from scaling dynamically based on events.

Azure Functions Premium plan hosting for code or containers

Next steps

Here are a few resources you can leverage to start building your Python apps in Azure Functions today:

On the Azure Functions team, we are committed to providing a seamless and productive serverless experience for developing and hosting Python applications. With so much being released now and coming soon, we’d love to hear your feedback and learn more about your scenarios. You can reach the team on Twitter and on GitHub. We actively monitor StackOverflow and UserVoice as well, so feel free to ask questions or leave your suggestions. We look forward to hearing from you!

Find solutions faster by analyzing crash dumps in Visual Studio

$
0
0

When unexpected crashes occur in your managed application you are often left with little evidence of the issue; capturing and analyzing memory dumps may be your last best option. Thankfully Visual Studio is a great tool for analyzing your apps memory dumps! In this post we show you how easy it is to get important insights from a crash dump, and the steps to resolve the issue using Visual Studio.

What is a crash?

There are several different things that might be causing your managed application to crash, the most common are typically unhandled exceptions. These occurs where an exception is raised (First Chance Exception), but your code does not handle it (typically using a try-catch code construct). The exception goes up the stack and becomes, what we refer to as, a Second Chance Exception and crashes your app’s process.

Out of Memory Exceptions, Stack Overflow Exceptions and Execution Engine Exceptions also cause crashes. Stack Overflow Exceptions and Out of Memory Exceptions can occur when your app has insufficient memory space for any function to handle the exception, which again causes the process to crash.

Capturing a memory dump

Memory dumps are a great diagnostic tool because they are a complete snapshot of what a process is doing at the time the dump is captured. There are several tools available for capturing memory dumps including Visual Studio, ProcDump, DebugDiag and WinDbg. The relative strength of each tool depends on your environment and the scenario you are investigating (e.g. high CPU, memory leaks, first/second chance exceptions, etc.).

In the following example, I use the versatile ProcDump command-line utility from Sysinternals to capture a full user-mode dump (-ma) when an unhandled exception (-e) occurs (1145 is the process id of my application).

procdump.exe -ma -e 1145

Once the crash occurs ProcDump immediately writes the memory dump to disk (*.dmp).

Debugging crashes is made easier with the Visual Studio memory tools, so let me show you how I debug a Stack Overflow Exception in my application, and how the tools navigate me directly to the line of code that caused the problem.

Analyzing a crash dump with Visual Studio

I can open my memory dump directly in Visual Studio and will be presented with the Dump Summary page.

Visual Studio - Dump Summary Page

The Dump Summary page highlights several pieces of important information from the dump file including the OS Version and CLR Version. I can also search through a list of the modules that were loaded into memory at the time I captured the memory dump.

In this example the Exception Code and Exception Information state that the problem is “The thread used up its stack”. Simply put, we have a stack overflow exception. Knowing the problem is one half of the equation, but I also want to know the root cause of the issue, and this is where I think Visual Studio shines.

On the right side of the Dump Summary page, I can choose from several Actions, but as this is a managed application, I will select the Debug with Managed Only option and Visual Studio immediately drops me onto the thread and code line that caused the stack overflow exception!

Visual Studio - Crash Dump Exception

I now have a more complete view of the problem, it’s as if I had managed to set a break point at the exact moment of the stack overflow. This also presents me with the opportunity to review my Call Stack (which confirms the issue), review other threads, and even verify the state of any Local variables at that point in time.

In this instance Visual Studio is pointing me to a clear error on my definition of the get property. Instead of returning the private variable m_MyText I have mistakenly returned the public property MyText. This circular reference is the cause of the stack overflow exception.

Finding the root cause of the problem may not always be this clear, so you could also collaborate with a colleague directly from the exception by using Visual Studio Live Share. This gives you the ability to co-debug in real time without teammates needing to set up their environment.

Visual Studio - Start Live Share Session from an Exception

Conclusion

Over the years Visual Studio has developed first class support for handling and debugging memory dumps. It allows you to consider the impact your code is having during the exact moment of a catastrophic failure. Having the ability to investigate a problem with the same tools used for developing code can help save time determining and providing a solution.

Please let us know what you’d like to see next by suggesting feature requests or reporting issues via Developer Community.

The post Find solutions faster by analyzing crash dumps in Visual Studio appeared first on The Visual Studio Blog.

.NET Core and systemd

$
0
0

In preview7 a new package was added to the Microsoft.Extensions set of packages that enables integration with systemd. For the Windows focused, systemd allows similar functionality to Windows Services, there is a post on how to do what we discuss here for Windows Services in this post. This work was contributed by Tom Deseyn from Red Hat. In this post we will create a .NET Core app that runs as a systemd service. The integration makes systemd aware when the application has started/is stopping, and configures logs to be sent in a way that journald (the logging system of systemd) understands log priorities.

Create and publish an app

First let’s create the app that we will use. I’m going to use the new worker template, but this would also work well with an ASP.NET Core app. The main restriction is that it needs to be using a Microsoft.Extensions.Hosting based app model.

In VS:

Visual Studio new project dialog

Command Line:

When using the command line you can run:

dotnet new worker

This command will create you a new worker app the same as the VS UI. Once we have our app we need to add the Microsoft.Extensions.Hosting.Systemd NuGet package, you can do this by editing your csproj, using the CLI, or using VS UI:

Once you’ve added the NuGet package you can add a call to UseSystemd in your program.cs:

At this point you have configured your application to run with systemd. The UseSystemd method will noop when not running as a daemon so you can still run and debug your app normally or use it in production both with and without systemd.

Create unit files

Now that we have an app we need to create the configuration files for systemd that tell it about the service so that it knows how to run it. To do that you create a .service file (there are other types of unit file, the .service file is what we will use since we are deploying a service). You need this file on the Linux machine that you will be registering and running the app on. A basic service file looks like this:

This file needs to exist in the /etc/systemd/system/ directory, /etc/systemd/system/testapp.service in our case. By specifying Type=notify an application can notify systemd when the host has started/is stopping. Once the file exists in the directory run the following for systemd to load the new configuration file using the systemctl command which is how you interact with systemd:

sudo systemctl daemon-reload

After that if you can run the following to see that systemd knows about your service:

sudo systemctl status testapp
(replacing testapp with the name of your app if you used a different name)

You should see something like the following:

null

This shows that the new service you’ve registered is disabled, we can start our service by running:

sudo systemctl start testapp.service

Because we specified Type=notify systemd is aware when the host has started, and the systemctl start will block until then. If you re-run sudo systemctl status testapp you will see something like the following:

If you want your service to start when the machine does then you can use:

sudo systemctl enable testapp.service

You will see that the status message now changes to say enabled instead of disabled when running systemctl status.

If you are having trouble getting your app to start for some reason then you should make sure that you can run the file in the ExecPath yourself in the terminal first, then use systemctl status to see what messages you are getting from the app when it fails to start.

Exploring journalctl

Now that we have an app running with systemd we can look at the logging integration. One of the benefits of using systemd is the centralized logging system that you can access with journalctl.

To start, we can view the logs of our service by using journalctl, a command to access the logs:

sudo journalctl -u testapp

This displays all the logs for the unit (-u) file with testapp in the name. You could be more specific by using testapp.service. If you run journalctl without specifying the service you are interested in then you will see logs from all services interleaved with each other as all logs are seen as one big log stream in this system. You use journalctl to focus that single log stream to what you are interested in at the time.

Running the command would give you output that looks like:

You can see the logging is different than when running from the terminal: each message is on a single line. systemd is also aware of the log priorities. To show this in action I added a few log statements to my testapp and run again:

Then if I run sudo journaltcl -u testapp I see:

Log messages in a console app with red critical logs

In this log output the tool has highlighted the critical log message in red and shows that the lifetime of my app is now the SystemdLifetime proving to me that the integration has worked. The tool can do this because when calling UseSystemd we map Extensions.LogLevel to syslog log levels:

LogLevel Syslog level systemd name
Trace/Debug 7 debug
Information 6 info
Warning 4 warning
Error 3 err
Critical 2 crit

With this information I can run sudo journalctl -p 3 -u testapp which will filter log messages to only display critical and error logs.

Conclusion

If you’re using .NET Core apps with systemd then we think this package should give you a much better experience, and we hope you try it out and tells us any other features you’d like to see by logging issues on GitHub. If you are going to use this to run a web app then there is some additional guidance on the ASP.NET Docs page.

The post .NET Core and systemd appeared first on .NET Blog.

What’s new in Azure DevOps Sprint 156

$
0
0

Sprint 156 has just finished rolling out to all organizations and you can check out all the new features in the release notes. Here are some of the features that you can start using today.

Comments in Wiki pages 

Previously, you didn’t have a way to interact with others inside wiki. This made collaborating over content and getting questions answered a challenge since conversations had to happen over mail or chat channels. With comments, you can now collaborate with others within wiki. You can leverage the @mention users functionality inside comments to draw the attention of other team members. 

Azure Boards new features

Azure Boards introduced new collaboration features, some of which are listed below:

Customize system picklist values

You can now customize the values for any system picklist (except the reason field) such as Severity, Activity, Priority, etc. The picklist customizations are scoped so that you can manage different values for the same field for each work item type.

Mention people, work items and PRs in text fields

We heard that you wanted the ability to mention people, work items, and PRs in the work item description area (and other HTML fields) on the work item and not just in comments. Sometimes you are collaborating with someone on a work item, or want to highlight a PR in your work item description, but didn’t have a way to add that information. Now you can mention people, work items, and PRs in all long text fields on the work item.

Reactions on discussion comments

You can now add reactions to any comment, and there are two ways to add your reactions – the smiley icon at the top right corner of any comment, as well as at the bottom of a comment next to any existing reactions. You can add all six reactions if you like, or just one or two!

These are just the tip of the iceberg, and there are plenty more features that we’ve released in Sprint 156. Check out the full list of features for this sprint in the release notes.

The post What’s new in Azure DevOps Sprint 156 appeared first on Azure DevOps Blog.

Viewing all 5971 articles
Browse latest View live


<script src="https://jsc.adskeeper.com/r/s/rssing.com.1596347.js" async> </script>