Quantcast
Channel: Category Name
Viewing all 5971 articles
Browse latest View live

Remote Debugging a .NET Core Linux app in WSL2 from Visual Studio on Windows

$
0
0

With Visual Studio Code and WSL (Windows Subsystem for Linux) you can be in a real Linux environment and run "code ." from the Linux prompt and Visual Studio Code will launch in Windows and effectively split in half. A VSCode-Server will run in Linux and manage the Language Services, Debugger, etc, while Windows runs your VS Code instance. You can use VS Code to develop on remote machines over SSH as well and it works great. In fact there's a whole series of Remote Tutorials to check out here.

VS Code is a great Code Editor but it's not a full IDE (Integrated Development Environment) so there's still lots of reasons for me to use and enjoy Visual Studio on Windows (or Mac).

I wanted to see if it's possible to do 'remote' debugging with WSL and Visual Studio (not Code) and if so, is it something YOU are interested in, Dear Reader.

  • To start, I've got WSL (specifically WSL2) on my Windows 10 machine. You can get WSL1 today on Windows from "windows features" just by adding it. You can get WSL2 today in the Windows Insiders "Slow Ring."
  • Then I've got the new Windows Terminal. Not needed for this, but it's awesome if you like the command line.
  • I've got Visual Studio 2019 Community

I'm also using .NET Core with C# for my platform and language of choice. I've installed from https://dot.net/ inside Ubuntu 18.04, under Windows. I've got a web app (dotnet new razor) that runs great in Linux now.

RemoteWebApp in the Terminal

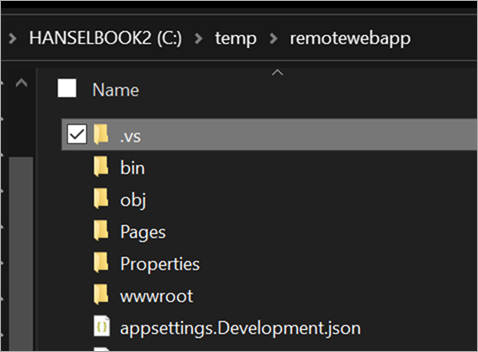
From the WSL prompt within terminal, I can run "explorer.exe ." and it will launch Windows Explorer at the path \wsl$Ubuntu-18.04homescottremotewebapp, but VS currently has some issues opening projects across this network boundary. I'll instead put my stuff at c:tempremotewebapp and access it from Linux as /mnt/c/temp/remotewebapp.

RemoteWebApp in Explorer

In a perfect world - this is future speculation/brainstorming, Visual Studio would detect when you opened a project from a Linux path and "Do The Right Thing(tm)."

I'll need to make sure the VSDbg is installed in WSL/Linux first. That's done automatically with VS Code but I'll do it manually in one line like this:

curl -sSL https://aka.ms/getvsdbgsh | /bin/sh /dev/stdin -v latest -l ~/vsdbg

We'll need a launch.json file with enough information to launch the project, attach to it with the debugger, and notice when things have started. VS Code will make this for you. In some theoretical future Visual Studio would also detect the context and generate this file for you. Here's mine, I put it in .vs/launch.json in the project folder.

VS will make a launch.json also but you'll need to add the two most important parts, the $adapter and $adapterArgs part as I have here.

{

// Use IntelliSense to find out which attributes exist for C# debugging
// Use hover for the description of the existing attributes
// For further information visit https://github.com/OmniSharp/omnisharp-vscode/blob/master/debugger-launchjson.md
"version": "0.2.0",
"configurations": [
{
"$adapter": "C:\windows\sysnative\bash.exe",
"$adapterArgs": "-c ~/vsdbg/vsdbg",
"name": ".NET Core Launch (web)",
"type": "coreclr",
"request": "launch",
"preLaunchTask": "build",
// If you have changed target frameworks, make sure to update the program path.
"program": "/mnt/c/temp/remotewebapp/bin/Debug/netcoreapp3.0/remotewebapp.dll",
"args": [],
"cwd": "/mnt/c/temp/remotewebapp",
"stopAtEntry": false,
// Enable launching a web browser when ASP.NET Core starts. For more information: https://aka.ms/VSCode-CS-LaunchJson-WebBrowser
"serverReadyAction": {
"action": "openExternally",
"pattern": "^\s*Now listening on:\s+(https?://\S+)"
},
"env": {
"ASPNETCORE_ENVIRONMENT": "Development"
},
"sourceFileMap": {
"/Views": "${workspaceFolder}/Views"
},
"pipeTransport": {
"pipeCwd": "${workspaceRoot}",
"pipeProgram": "bash.exe",
"pipeArgs": [ "-c" ],
"debuggerPath": "~/vsdbg/vsdbg"
},
"logging": { "engineLogging": true }
}
]
}

These launch.json files are used by VS and VS Code and other stuff and give the system and debugger enough to go on. There's no way I know of to automate this next step and attach it to a button like "Start Debugging" - that would be new work in VS - but you can start it like this by calling a VS2019 automation command from the "Command Window" you can access with View | Other Windows | Command Window, or Ctrl-Alt-A.

Once I've typed this once in the Command Window, I can start the next Debug session by just pressing Up Arrow to get the command from history and hitting enter. Again, not perfect, but a start.

DebugAdapterHost.Launch /LaunchJson:C:tempremotewebapp.vslaunch.json  

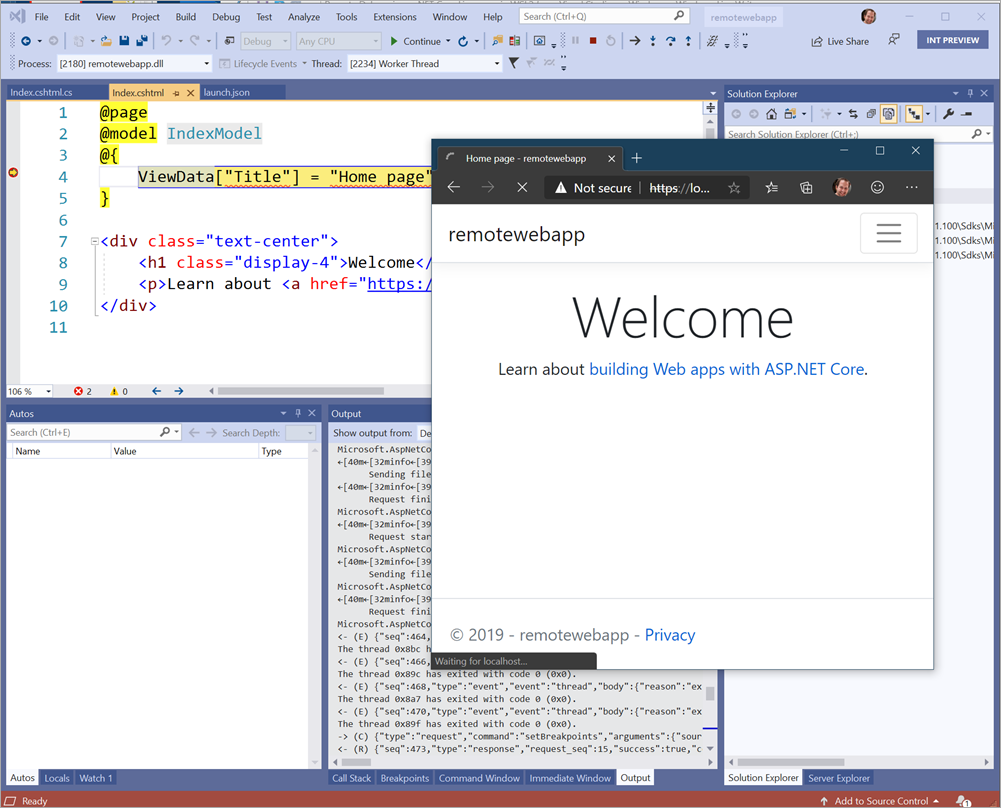
Here's a screenshot of me debugging a .NET Core app running in Linux under WSL from Windows Visual Studio 2019.

VS 2019

Thanks to Andy Sterland for helping me get this working.

So, it's possible, but it's not falling-off-a-log automatic. Should this setup and prep be automatic? Is development in WSL from Visual Studio (not Code) something you want? There is great support for Docker development within a container including interactive debugging already, so where do you see this fitting in...if at all? Does this add something or is it more convenient? Would you like "F5" debugging for WSL apps within VS like you can in VS Code?


Sponsor: Like C#? We do too! That’s why we've developed a fast, smart, cross-platform .NET IDE which gives you even more coding power. Clever code analysis, rich code completion, instant search and navigation, an advanced debugger... With JetBrains Rider, everything you need is at your fingertips. Code C# at the speed of thought on Linux, Mac, or Windows. Try JetBrains Rider today!


© 2019 Scott Hanselman. All rights reserved.
     

Advice to my 20 year old self

$
0
0

A lovely interactionI had a lovely interaction on Twitter recently where a young person reached out to me over Twitter DM.

She said:

If you could go back and give your 20-something-year-old self some advice, what would you say?

I’m about to graduate and I’m sort of terrified to enter the real world, so I’ve sort of been asking everyone.

What a great question! Off the top of my head - while sitting on the tarmac waiting for takeoff and frantically thumb-typing - I offered this brainstorm.

First
Avoid drama. In relationships and friends
Discard negative people
There’s 8 billion people out there
You don’t have to be friends with them all
Don’t let anyone hold you back or down
We waste hours and days and years with negative people
Collect awesome people like Pokémon
Network your butt off. Talk to everyone nice
Make sure they aren’t transactional networkers
Nice people don’t keep score
They generously share their network
And ask for nothing in return but your professionalism
Don’t use a credit card and get into debt if you can
Whatever you want to buy you likely don’t need it
Get a laptop and an iPad and buy experiences
Don’t buy things. Avoid wanting things
Molecules are expensive
Electrons are basically free
If you can avoid want now, you’ll be happier later
None of us are getting out of this alive
And we don’t get to take any of the stuff
So ask yourself what do I want
What is happiness for you
And optimize your existence around that thing
Enjoy the simple. street food. Good friends
If you don’t want things then you’ll enjoy people of all types
Use a password system like
@1Password
and manage your digital shit tightly
Be focused
And it will be ok
Does this help?

What's YOUR advice to your 20 year old self?


Sponsor: Like C#? We do too! That’s why we've developed a fast, smart, cross-platform .NET IDE which gives you even more coding power. Clever code analysis, rich code completion, instant search and navigation, an advanced debugger... With JetBrains Rider, everything you need is at your fingertips. Code C# at the speed of thought on Linux, Mac, or Windows. Try JetBrains Rider today!


© 2019 Scott Hanselman. All rights reserved.
     

GC Perf Infrastructure – Part 1

$
0
0

We open sourced our new GC Perf Infrastructure! It’s now part of the dotnet performance repo. I’ve been meaning to write about it ‘cause some curious minds had been asking when they could use it after I blogged about it last time but didn’t get around to it till now.

First of all, let me point out that the target audience of this infra, aside from the obvious (ie, those who make performance changes to the GC), are folks need to do in-depth analysis of GC/managed memory performance and/or to build automation around it. So it assumes you already have a fair amount of knowledge what to look for with the analysis.

Secondly, there are a lot of moving parts in the infra and since it’s still under development I wouldn’t be surprised if you hit problems when you try to use it. Please be patient with us as we work through the issues! We don’t have a whole lot of resources so we may not be able to get to them right away. And of course if you want to contribute it would be most appreciated. I know many people who are reading this are passionate about perf analysis and have done a ton of work to build/improve perf analysis for .NET, whether in your own tooling or other people’s. And contributing to perf analysis is a fantastic way to learn about GC tuning if you are looking to start somewhere. So I would strongly encourage you to contribute!

Topology

We discussed whether we wanted to open source this in its own repo and the conclusion we wouldn’t mostly just due to logistics reasons so this became part of the perf repo under the “src/benchmarks/gc” directory (which I’ll refer to as the root directory). It doesn’t depend on anything outside of this directory which means you don’t need to build anything outside of it if you just want to use the GC perf infra part.

The readme.md in the root directory describes the general workflow and basic usage. More documentation can be found in the docs directory.

There are 2 major components of the infra –

Running perf benchmarks

This runs our own perf benchmarks – this is for folks who need to actually make perf changes to the GC. It provides the following functionalities –

  • Specifying different commandline args to generate different perf characteristics in the tests, eg, different surv ratios for SOH/LOH and different pinning ratios;
  • Specifying builds to compare against;
  • Specifying different environments, eg, different env vars to specify GC configs, running in containers or high memory load situations;
  • Specifying different options to collect traces with, eg, GCCollectOnly or ThreadTime.

You specify all these in what we call a bench file (it’s a .yaml file but really could be anything – we just chose .yaml). We also provide configurations for the basic perf scenarios so when you make changes those should be run to make sure things don’t regress.

You don’t have to run our tests – you could run whatever you like as long as you can specify it as a commandline program, and still take advantage of the rest of what we provide like running in a container.

This is documented in the readme and I will be talking about this in more detail in one of the future blog entries.

Source for this is in the exec dir.

Analyzing perf

This can be used without the running part at all. If you already collected perf traces, you can use this to analyze them. I’d imagine more folks would be interested in this than the running part so I’ll devote more content to analysis. In the last GC perf infra post I already talked about things you could do using Jupyter Notebook (I’ll be showing more examples with the actual code in the upcoming blog entries). This time I’ll focus on actually setting things up and using the commands we provide. Feel free to try it out now that it’s out there.

Source for this is in the analysis dir.

Analysis setup

After you clone the dotnet performance repo, you’ll see the readme in the gc infra root dir. Setup is detailed in that doc. If you just want the analysis piece you don’t need to do all of the setup steps there. The only steps you need are –

  • Install python. 3.7 is the minimal required version and recommended version. 3.8 has problems with Jupyter Notebook. I wanted to point this out because 3.8 is the latest release version on python’s page.
  • Install the python libraries needed – you can install this via “py -m pip install -r src/requirements.txt” as the readme says and if no errors occur, great; but you might get errors with pythonnet which is mandatory for analysis. In fact installing pythonnet can be so troublesome that we devoted a whole doc just for it. I hope one day there are enough good c# charting libraries and c# works in Jupyter Notebook inside VSCode so we no longer need pythonnet.
  • Build the c# analysis library by running “dotnet publish” in the srcanalysismanaged-lib dir.

Specify what to analyze

Let’s say you’ve collected an ETW trace (this can be from .NET or .NET Core) and want to analyze it, you’ll need to tell the infra which process is of interest to you (on Linux you collect the events for the process of interest with dotnet-trace but since the infra works on both Windows and Linux this is the same step you’d perform). Specifying the process to analyze means simply writing a .yaml file that we call the “test status file”. From the readme, the test status file you write just for analysis only needs these 3 lines – success: true trace_file_name: x.etl # A relative path. Should generally match the name of this file. process_id: 1234 # If you don’t know this, use the print-processes command for a list

You might wonder why you need to specify the “success: true” line at all – this is simply because the infra can also be used to analyze the results of running tests with it and when you run lots of tests and analyze their results in automation we’d look for this line and only analyze the ones that succeeded.

You may already know the PID of the process you want to analyze via other tools like PerfView but we aim to have the infra used standalone without having to run other tools so there’s a command that prints out the PIDs of processes a trace contains.

We really wanted to have the infra provide meaningful built-in help so when you wonder how to do something you could generally find it in its help. To get the list of all commands simply ask for the top level help in the root dir – C:perfsrcbenchmarksgc>py . help

Read README.md first. For help with an individual command, use py . command-name --help. (You can also pass --help --hidden to see hidden arguments.)

run commands

[omitted]

analysis commands

Commands for analyzing test results (trace files). To compare a small number of configs, use diff. To compare many, use chart-configs. For detailed analysis of a single trace, use analyze-single or chart-individual-gcs.

   analyze-single | Given a single trace, print run metrics and optionally metrics for individual GCs.


analyze-single-gc | Print detailed info about a single GC within a single trace. [more output omitted]

(I apologize for the formatting – it amazes me that that we don’t seem to have a decent html editing program for blogging and writing a blog mostly consists of manually writing html ourselves which is really painful)

As the top level help says you can get help with specific commands. So we’ll follow that suggestion and do C:perfsrcbenchmarksgc>py . help print-processes Print all process PIDs and names from a trace file.

arg name arg type description
–name-regex any string Regular expression used to filter processes by their name
–hide-threads true or false Don’t show threads for each process

[more output omitted; I also did some formatting to get rid of some columns so the lines are not too long]

(from here on I will not show the help for each command I use as you can just do that on your own)

I already collected an .etl file with a test called fragment so I’ll run this command on the trace – C:perfsrcbenchmarksgc>py . print-processes C:tracesfragmentPerfViewGCCollectOnly.etl –name-regex fragment –hide-threads

pid name HeapSizePeakMB_Max TotalAllocatedMB command-line args
14392 fragment 1079 3.06e+04 fragment

Now we know the PID, we can make such a test status file that just contains the following lines and put it next to the PerfViewGCCollectOnly.etl file I collected which is in my c:tracesfragment dir: success: true trace_file_name: PerfViewGCCollectOnly.etl process_id: 14392 and I named the file fragment.yaml.

Examples of doing analysis

According to the top level help, for analysis on a single trace, you could use the analyze-single or the chart-individual-gcs command. Let’s try that. C:perfsrcbenchmarksgc>py . analyze-single C:tracesfragmentfragment.yaml Overall metrics

Name Value
TotalNumberGCs 74
CountUsesLOHCompaction
CountIsGen0 32
CountIsGen1 28
CountIsBackground 14
CountIsBlockingGen2 0

[more output omitted] So this gives overall metric and some stats on the first 10 GCs which I omitted here. Looks like we can drill down on this with some commandline args according to the help for this command (readme.md mentions that the metrics I’m specifying here are documented in metrics.md): C:perfsrcbenchmarksgc>py . analyze-single C:tracesfragmentfragment.yaml –gc-where Generation=0 –sort-gcs-descending PauseDurationMSec –single-gc-metrics PauseDurationMSec Generation PromotedMB UsesCompaction –show-first-n-gcs 32 [overall metrics omitted] Single gcs (first 32)

gc number PauseDurationMSec Generation PromotedMB UsesCompaction
6 48.0 0 159 True
33 42.1 0 139 True
50 42.0 0 137 True
3 37.2 0 159 True
8 36.2 0 149 True
69 36.0 0 137 True
66 34.7 0 147 True
35 34.2 0 138 True
71 34.2 0 145 True

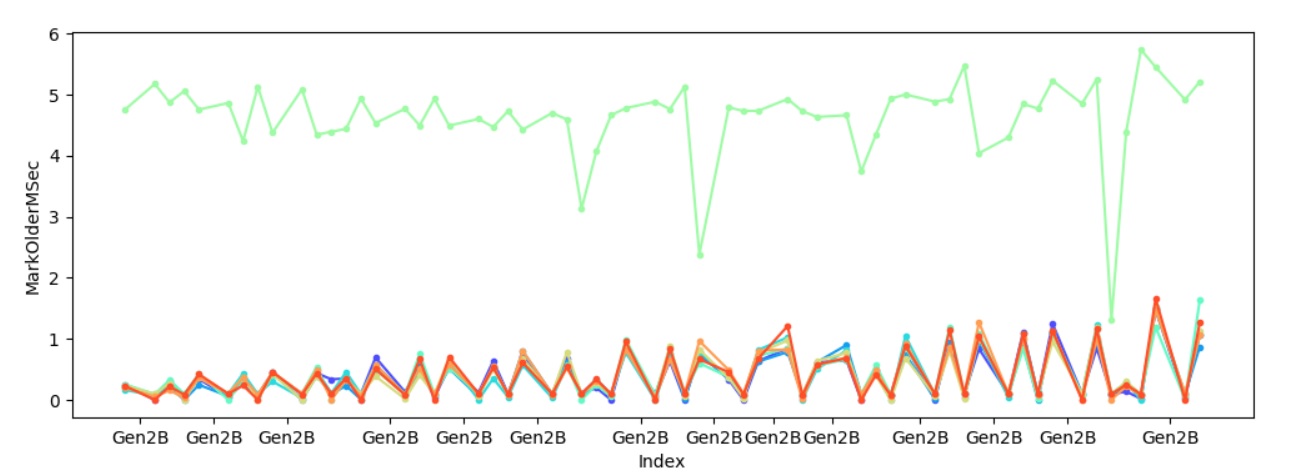
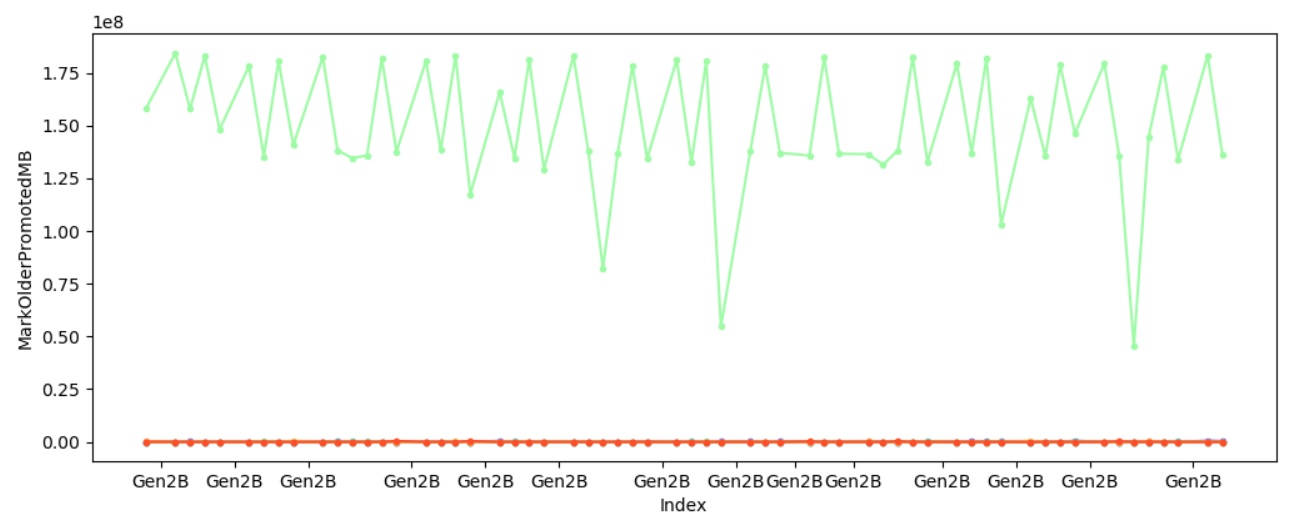
[more output omitted] As an example, I purposefully chose a test that I know is unsuitable to be run with Server GC ‘cause it only has one thread so I’m expecting to see some heap imbalance. I know the imbalance will occur when we mark older generation objects holding onto young gen objects so I’ll use the chart-individual-gcs command to show me how long each heap took to mark those. C:perfsrcbenchmarksgc>py . chart-individual-gcs C:tracesfragmentfragment.yaml –x-single-gc-metric Index –y-single-heap-metrics MarkOlderMSec This will show 8 heaps. Consider passing --show-n-heaps. markold-time Sure enough one of the heaps always takes significantly longer to mark young gen objects referenced by older gen objects, and to make sure it’s not because of some other factors I also looked at how much is promoted per heap – C:perfsrcbenchmarksgc>py . chart-individual-gcs C:tracesfragmentfragment.yaml –x-single-gc-metric Index –y-single-heap-metrics MarkOlderPromotedMB This will show 8 heaps. Consider passing --show-n-heaps. markold-promoted This confirms the theory – it’s because we marked significantly more with one heap which caused that heap to spend significantly longer in marking.

This trace was taken with the latest version of the desktop CLR. In the current version of coreclr we are able to handle this situation better but I’ll save that for another day since today I wanted to focus on tooling.

There’s an example.md that shows examples of using some of the commands. Note that the join analysis is not checked in just yet – the PR is out and I wanted to spend more time on the CR before merging it.

Announcing the preview of Azure Spot Virtual Machines

$
0
0

We’re announcing the preview of Azure Spot Virtual Machines. Azure Spot Virtual Machines provide access to unused Azure compute capacity at deep discounts. Spot pricing is available on single Virtual Machines in addition to Virtual Machine Scale Sets (VMSS). This enables you to deploy a broader variety of workloads on Azure while enjoying access to discounted pricing. Spot Virtual Machines offer the same characteristics as a pay-as-you-go Virtual Machines, with differences in pricing and evictions. Spot Virtual Machines can be evicted anytime if Azure needs capacity.

The workloads that are ideally suited to run on Spot Virtual Machines include, but are not necessarily limited to, the following:

•    Batch jobs.
•    Workloads that can sustain and/or recover from interruptions.
•    Development and test.
•    Stateless applications that can use Spot Virtual Machines to scale out, opportunistically saving cost.
•    Short-lived jobs which can easily be run again if the Virtual Machine is evicted.

Preview for Spot Virtual Machines will replace the preview of Azure low-priority Virtual Machines on scale sets. Eligible low-priority Virtual Machines will be automatically transitioned over to Spot Virtual Machines. Please refer to the FAQ for additional information. 

Pricing

Unlike low-priority Virtual Machines, prices for Spot Virtual Machines will vary based on capacity for a size or SKU in an Azure region. Spot pricing can give you insights into the availability and demand for a given Azure Virtual Machine series and specific size in a region. The prices will change slowly to provide stabilization, thus allowing you to better manage budgets. In the Azure portal, you will have access to the current Azure Virtual Machine Spot prices to easily determine which region or Virtual Machine size best fits your needs. Spot prices are capped at pay-as-you-go prices.
VM size pane in portal showing sizes and spot prices 

Deployment

Spot Virtual Machines are easy to deploy and manage. Deploying a Spot Virtual Machine is similar to configuring and deploying a regular Virtual Machine. For example, in the Azure portal, you can simply select Azure Spot Instance to deploy a Spot Virtual Machine. You can also define your maximum price for your Spot Virtual Machines. Here are two options: 

  1. You can choose to deploy your Spot Virtual Machines without capping the price. Azure will charge you the Spot Virtual Machine price at any given time, giving you peace of mind that your Virtual Machines will not be evicted for price reasons.
     Select capacity only eviction type.
  2. Alternatively, you can decide to provide a specific price to stay in your budget. Azure will not charge you above the maximum price you set and will evict the Virtual Machine if the spot price rises above your defined maximum price.
       Ability to provide maximum price to deploy Spot VM.

There are few other options available to lower costs.

  1. If your workload does not require a specific Virtual Machine series and size, then you can find other Virtual Machines in the same region that may be cheaper.
  2. If your workload is not dependent on a specific region, then you can find a different Azure region to reduce your cost.

Quota

As part of this announcement, to give better flexibility, Azure is also rolling out a separate quota for Spot Virtual Machines that is separate from your pay-as-you-go Virtual Machine quota. The quota for Spot Virtual Machines and Spot VMSS instances is a single quota for all Virtual Machine sizes in a specific Azure region. This approach will give you easy access to a broader set of Virtual Machines.
  Request new quota for Spot VMs.

Handling Evictions

Azure will try to keep your Spot Virtual Machine running and minimize evictions, but your workload should be prepared to handle evictions as runtime for an Azure Spot Virtual Machines and VMSS instances is not guaranteed. You can optionally get a 30-second eviction notice by subscribing to scheduled events. Virtual Machines can be evicted due to the following reasons:

  1. Spot prices have gone above the max price you defined for the Virtual Machine. Azure Spot Virtual Machines get evicted when the Spot price for the Virtual Machine you have chosen goes above the price you defined at the time of deployment. You can try to redeploy your Virtual Machine by changing prices.
  2. Azure needs to reclaim capacity.

In both scenarios, you can try to redeploy the Virtual Machine in the same region or availability zone.

Best practices

Here are some effective ways to best utilize Azure Spot Virtual Machines:

  • For long-running operations, try to create checkpoints so that you can restart your workload from a previous known checkpoint to handle evictions and save time.
  • In scale-out scenarios, to save costs, you can have two VMSS, where one has regular Virtual Machines and the other has Spot Virtual Machines. You can put both in the same load balancer to opportunistically scale out.
  • Listen to eviction notifications in the Virtual Machine to get notified when your Virtual Machine is about to be evicted.
  • If you are willing to utilize pay-as-you-go prices, then use Eviction type to “Capacity Eviction only”, in the API provide “-1” as max price as Azure never charges you more than the Spot Virtual Machine price.
  • To handle evictions, build a retry logic to redeploy Virtual Machines. If you do not require a specific Virtual Machine series and size, then try to deploy a different size that matches your workload needs.
  • While deploying VMSS, select max spread in portal management tab or FD==1 in the API to find capacity in a zone or region.

Learn more

Announcing the General Availability of Proximity Placement Groups

$
0
0

Earlier this year, we announced the preview of Azure proximity placement groups to enable customers to achieve co-location of Azure Infrastructure as a Service (IaaS) resources with low network latency.

Today’s general availability of proximity placement groups continues to be particularly useful for workloads that require low latency. In fact, this logical grouping construct ensures that your IaaS resources (virtual machines, or VMs) are physically located close to each other and adds new features and best practices for success.

Diagram describing the relationship between VMs, VM scale sets, availability sets and proximity placement groups.

New features

Since preview, we’ve added additional capabilities based on your great feedback:

More regions, more clouds

Starting now, proximity placement groups are available in all Azure public cloud regions (excluding India central).

Portal support

Proximity placement groups are available in the Azure portal. You can create a proximity placement group and use it when creating your IaaS resources.

Move existing resources to (and from) proximity placement groups

You can now use the Azure portal to move existing resources into (and out of) a proximity placement group. This configuration operation requires you to stop (deallocate) all VMs in your scale set or availability set prior to assigning them to a proximity placement group.

Supporting SAP applications

One of the common use cases for proximity placement groups is with multi-tiered, mission-critical applications such as SAP. We’ve announced support for SAP on Azure Virtual Machines as well as SAP HANA Large instances.

Measure virtual machine latency in Azure

You may need to measure the latency between components in your service such as application and database. We’ve documented the steps and tools on how to test VM network latency in Azure.

Learn from our experience

We’ve been monitoring proximity placement groups adoption as well as analyzing failures customers witnessed during the preview and captured the best practices for using proximity placement groups.

Azure Portal user interface to configure a proximity placement group and see all the relevant properties.

Best Practices

Here are some of the best practices that with your help we were able to develop:

  • For the lowest latency, use proximity placement groups together with accelerated networking. Accelerated networking enables single root I/O virtualization (SR-IOV) to a VM, greatly improving its networking performance. This high-performance path bypasses the host from the data-path, reducing latency, jitter, and CPU utilization. For more information, see Create a Linux virtual machine with Accelerated Networking or Create a Windows virtual machine with Accelerated Networking.
  • When trying to deploy a proximity placement group with VMs from different families and SKUs, try to deploy them all with a single template. This will increase the probability of having all of your VMs successfully deployed.
  • A proximity placement group is assigned to a data center when the first resource (VM) is being deployed and released once the last resource is being deleted or stopped. If you stop all your resources (including to save costs), you may land in a different data center once you bring them back. Reduce the chances of allocation failures by starting with your largest VM which could be memory optimized (M, Msv2), storage optimized (Lsv2) or GPU enabled.
  • If you are scripting your deployment using PowerShell, CLI or the SDK, you may get an allocation error OverconstrainedAllocationRequest. In this case, you should stop/deallocate all the existing VMs, and change the sequence in the deployment script to begin with the VM SKU/sizes that failed.
  • When reusing an existing proximity placement group from which VMs were deleted, wait for the deletion to fully complete before adding VMs to it.
  • You can use a proximity placement group alongside availability zone. While a PPG can’t span zones, this combination is useful in cases where you care about latency within the zone like in a case of an active-standby deployment where each is in a separate zone.
  • Availability sets and Virtual Machine Scale Sets do not provide any guaranteed latency between Virtual Machines. While historically, availability sets were deployed in a single datacenter, this assumption does not hold anymore. Therefore, using proximity placement groups is useful even if you have a single tier application deployed in a single availability set or a scale set.
  • Use proximity placement groups with the Azure Virtual Machine Scale Set new features (now in preview) which now supports heterogeneous Virtual Machine sizes and families in a single scale set, achieving high availability with fault domains in a single availability zone, using custom images with shared image gallery and more.

Learn more

If you want to learn how you can co-locate resources for improved latency refer to the proximity placement groups documentation.

If you would like to learn more about the latest additions to our Azure IaaS portfolio please read our Azure infrastructure as a service (IaaS) for every workload blog.

You can also watch this brief video to learn more about proximity placement groups. Azure Friday - How to reduce inter-VM latency with Proximity Placement Groups.

Building Xbox game streaming with Site Reliability best practices

$
0
0

Last month, we started sharing the DevOps journey at Microsoft through the stories of several teams at Microsoft and how they approach DevOps adoption. As the next story in this series, we want to share the transition one team made from a classic operations role to a Site Reliability Engineering (SRE) role: the story of the Xbox Reliability Engineering and Operations (xREO) team.

This transition was not easy and came out of necessity when Microsoft decided to bring Xbox games to gamers wherever they are through cloud game streaming (project xCloud). In order to deliver cutting-edge technology with top-notch customer experience, the team had to redefine the way it worked—improving collaboration with the development team, investing in automation, and get involved in the early stages of the application lifecycle. In this blog, we’ll review some of the key learnings the team collected along the way. To explore the full story of the team, see the journey of the xREO team.

Consistent gameplay requirements and the need to collaborate

A consistent experience is crucial to a successful game streaming session. To ensure gamers experience a game streamed from the cloud, it has to feel like it is running on a nearby console. This means creating a globally distributed cloud solution that runs on many data centers, close to end users. Azure’s global infrastructure makes this possible, but operating a system running on top of so many Azure regions is a serious challenge.

The Xbox developers who have started architecting and building this technology understood that they could not just build this system and “throw it over the wall” to operations. Both teams had to come together and collaborate through the entire application lifecycle so the system can be designed from the start with considerations on how it will be operated in a production environment.

Mobile device showing a racing game streamed from the cloud

Architecting a cloud solution with operations in mind

In many large organizations, it is common to see development and operation teams working in silos. Developers don’t always consider operation when planning and building a system, while operations teams are not empowered to touch code even though they deploy it and operate it in production. With an SRE approach, system reliability is baked into the entire application lifecycle and the team that operates the system in production is a valued contributor in the planning phase. In a new approach, involving the xREO team in the design phase enabled a collaborative environment, making joint technology choices and architecting a system that could operate with the requirements needed to scale.

Leveraging containers to clearly define ownership

One of the first technological decisions the development and xREO teams made together was to implement a microservices architecture utilizing container technologies. This allowed the development teams to containerize .NET Core microservices they would own and remove the dependency from the cloud infrastructure that was running the containers and was to be owned by the xREO team.

Another technological decision both teams made early on, was to use Kubernetes as the underlying container orchestration platform. This allowed the xREO team to leverage Azure Kubernetes Service (AKS), a managed Kubernetes cloud platform that simplifies the deployment of Kubernetes clusters, removing a lot of the operational complexity the team would have to face running multiple clusters across several Azure regions. These joint choices made ownership clear—the developers are responsible for everything inside the containers and the xREO team is responsible for the AKS clusters and other Azure services make the cloud infrastructure hosting these containers. Each team owns the deployment, monitoring and operation of its respective piece in production.

This kind of approach creates clear accountability and allows for easier incident management in production, something that can be very challenging in a monolithic architecture where infrastructure and application logic have code dependencies and are hard to untangle when things go sideways.

Two members of the xREO team, seated in a conference room in front of a laptop.

Scaling through infrastructure automation

Another best practice the xREO team invested in was infrastructure automation. Deploying multiple cloud services manually on each Azure region was not scalable and would take too much time. Using a practice known as “infrastructure as code” (IaC) the team used Azure Resource Manager templates to create declarative definitions of cloud environments that allow deployments to multiple Azure regions with minimal effort.

With infrastructure managed as code, it can also be deployed using continuous integration and continuous delivery (CI/CD) to bring further automation to the process of deploying new Azure resources to existing data centers, updating infrastructure definitions or bringing online new Azure regions when needed. Both IaC and CI/CD, allowed the team to remain lean, avoid repetitive mundane work and remove most of the risk of human error that comes with manual steps. Instead of spending time on manual work and checklists, the team can focus on further improving the platform and its resilience.

Site Reliability Engineering in action 

The journey of the xREO team started with a need to bring the best customer experience to gamers. This is a great example that shows how teams who want to delight customers with new experiences through cutting edge innovation must evolve the way they design, build, and operate software. Shifting their approach to operations and collaborating more closely with the development teams was the true transformation the xREO team has undergone.

With this new mindset in place, the team is now well positioned to continue building more resilience and further scale the system and by so, deliver the promise of cloud game streaming to every gamer.

Resources

Routing made easier with traffic camera images and more

$
0
0

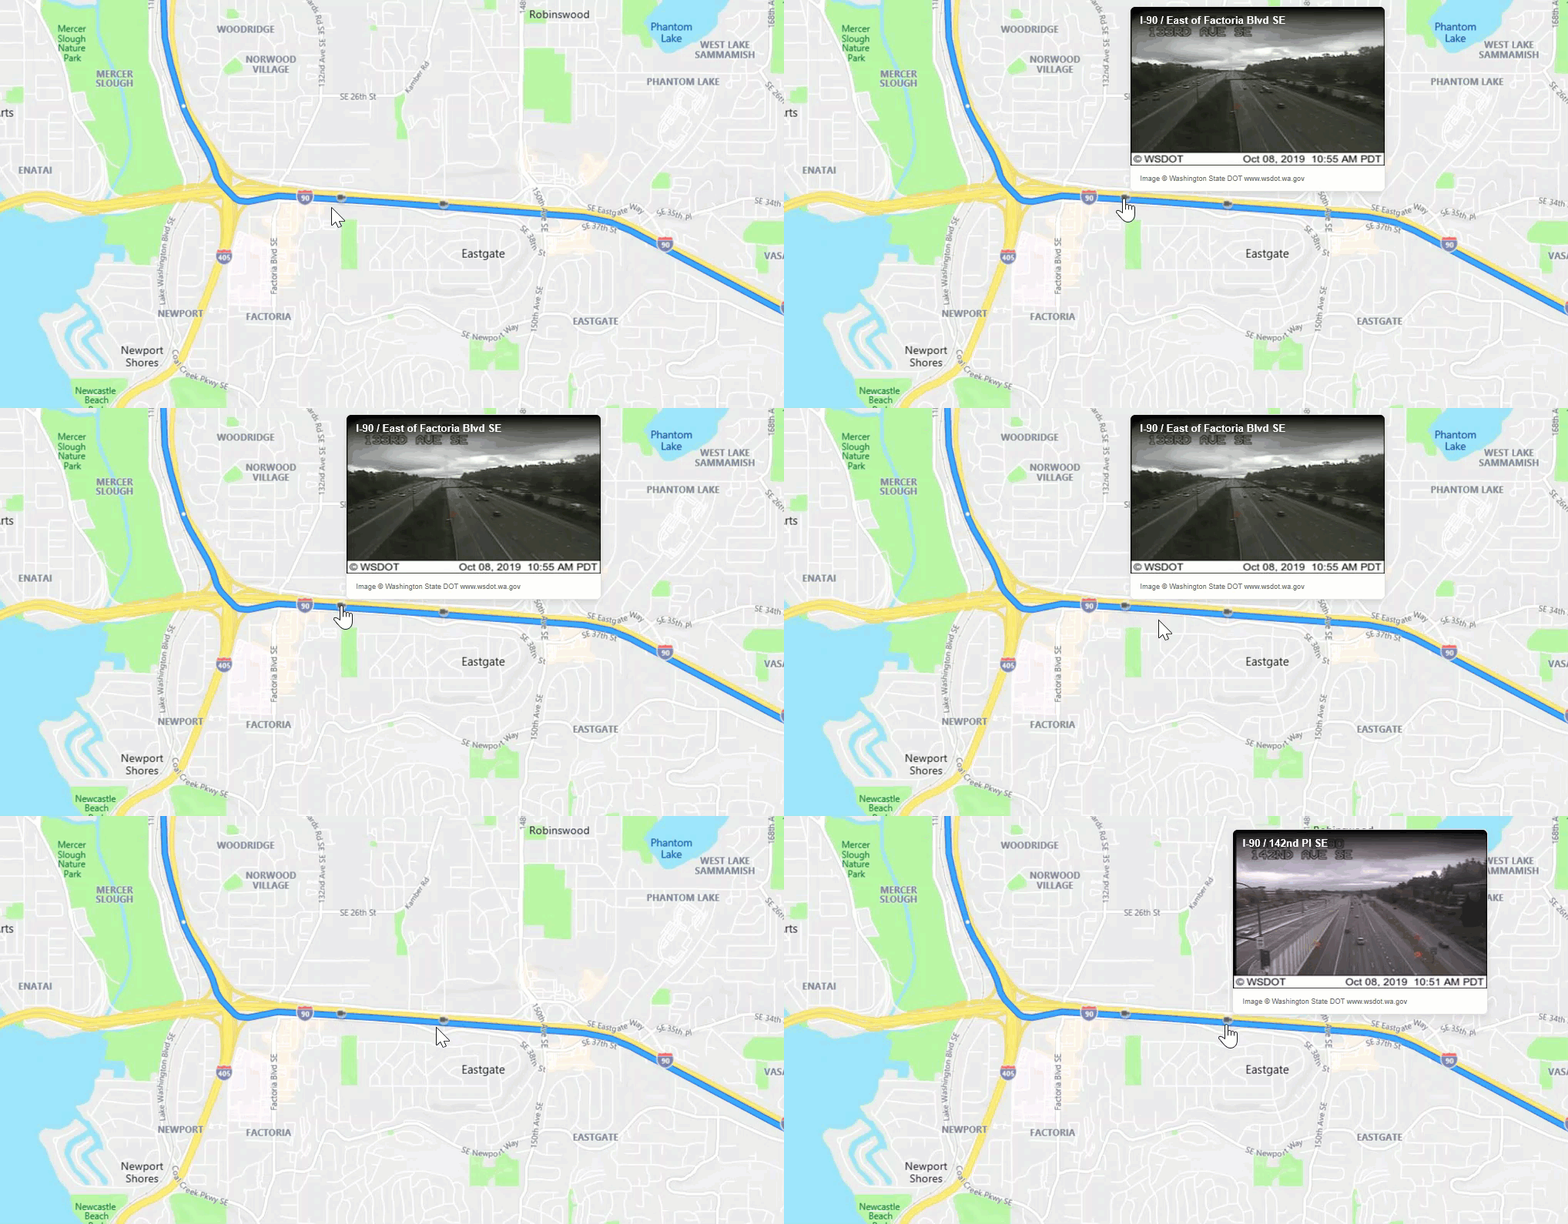
After launching traffic camera imagery on Bing Maps in April, we have seen a lot of interest in this new feature. You can view traffic conditions directly on a map and see the road ahead for your planned routes. This extra visibility helps you make informed decisions about the best route to your destination. Based on the popularity of this feature, the Bing Maps Routing and Traffic team has made some further improvements to this routing experience.

Hover to see traffic camera images or traffic incident details

In addition to clicking on the traffic camera icons on Bing Maps, traffic camera images and details can be accessed now by simply hovering over the camera icon along the planned route. Now you can quickly and easily glance at road conditions across your entire route.

Traffic Camera

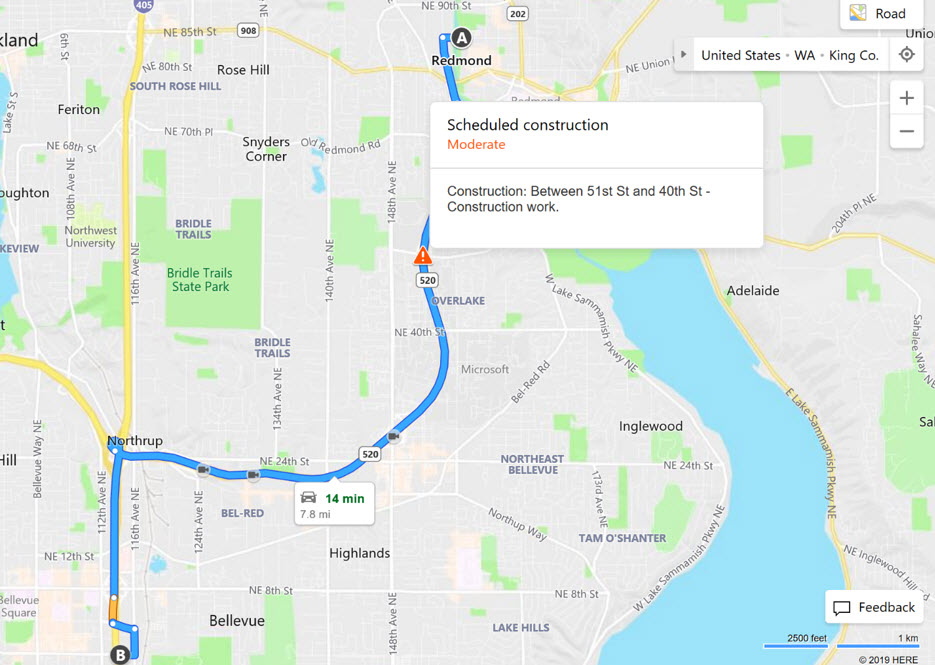
The Team also added traffic incident alerts along your planned route, which are shown as little orange or red triangle icons on the map. Just like the traffic cameras, you can view details about these traffic incident alerts by simply hovering over the little triangle icons. The examples below show traffic incident alerts about scheduled constructions and traffic ingestion respectively.

Scheduled Construction Screenshot

Serious Congestion Screenshot

Changes in click behavior

While hovering over the cameras or incident icons launches a popup for the duration of the hover, a click will keep the popup window open until you click anywhere else on the map or hover over another incident or camera icon.

Best Mode Routing

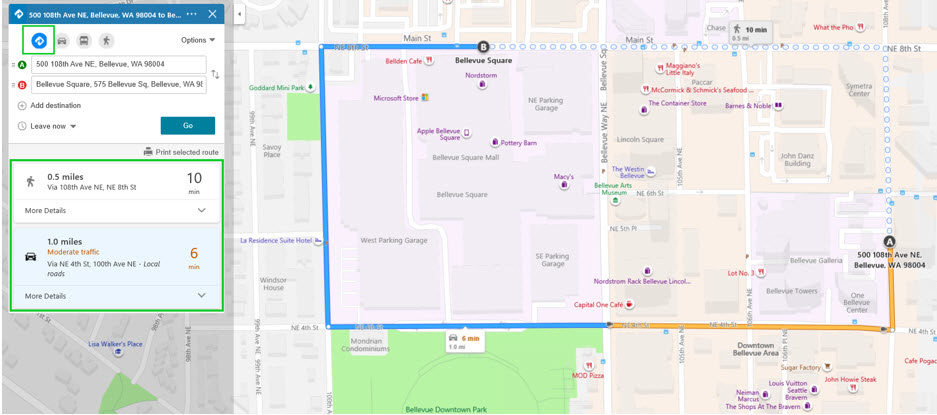
Sometimes, the destination you are trying to get to can be reached by different routing modes (e.g., driving, transit, or walking). In addition to allowing you to easily toggle between different routing modes on Bing Maps, we recently added a new default option of “Best Mode” to the Directions offering where you are served the best route options based on time, distance, and traffic. For example, for a very short-distance trip (e.g., 10 minutes walking), the "Best Mode" feature may recommend walking or driving routes because taking a bus such a short distance may not be the best option, considering wait time and bus fare. Likewise, for trips greater than 1.5 miles, walking may not be the best option. If a bus route requires several transfers, driving may be the better option.

The “Best Mode” feature allows you to view the best route options across modes without having to switch tabs for different modes. Armed with the recommended options and route details, you can quickly see how best to get to where you’re trying to go. Also, click on “More Details” to see detailed driving or transit journey instructions.

Best Mode Routing Screenshot

We hope these new features make life easier for you when it comes to getting directions and routing. Please let us know what you think on our Bing Maps Answers page. We are always looking for new ways to further improve our services with new updates releasing regularly.

- The Bing Maps Team

Get started with Collections in Microsoft Edge

$
0
0

We’re excited to announce that Collections is now enabled by default for all Microsoft Edge Insiders in the Canary and Dev channels (build 80.0.338.0 or later). Following our initial preview behind a feature flag two months ago, we have been adding in new features and functionality. For those who enabled the feature flag – thank you! We have been listening to your feedback and are excited to share the improvements we’ve made.

We designed Collections based on what you do on the web. If you’re a shopper, it will help you collect and compare items. If you’re an event or trip organizer, Collections will help pull together all your trip or event information as well as ideas to make your event or trip a success. If you’re a teacher or student, it will help you organize your web research and create your lesson plans or reports. Whatever you are doing on the web, Collections can help.

Recent improvements to Collections

We’ve been working hard to add more functionality and refine the feature over the last couple months – some of which were directly informed by your feedback.

Here are some of the improvements we made, based on your input:

Access your collections across your devices: We’ve added sync to Collections. We know some of you have seen issues around sync, your feedback has been helping us improve. We know this is an important scenario and are ready for you to try it. When you are signed into Microsoft Edge preview builds with the same profile on different computers, Collections will sync between them.

Open all links in a collection into a new window: We’ve heard you’d like an easy way to open all sites saved in a collection. Try out “Open all” from the “Sharing and more” menu to open tabs in a new window, or from the context menu on a collection to open them as tabs in the current window so you can easily pick up where you left off. We’ve also heard that you want an easy way to save a group of tabs to a collection. This is something that we are actively working on and are excited to share when it is ready.

Edit card titles: You’ve been asking for the ability to rename the titles of items in collections, so they are easier for you to understand. Now you can. To edit a title, right click and choose “Edit” from the context menu. A dialog will appear giving you the ability to rename the title.

Dark theme in Collections: We know you love dark theme, and we want to make sure we provide a great experience in Collections. We’ve heard some feedback on notes which we’ve addressed. Try it out and let us know what you think.

 “Try Collections” flyout: We understand that if you’re an active user of Collections that we were showing you the “Try Collections” flyout even though you previously used the feature. We’ve now tuned the flyout to be quieter.

Sharing a collection: You’ve told us that once you’ve collected content you want to share it with others. We have lots of work planned to better support sharing scenarios. One way you can share today is through the “Copy all” option added to the “Sharing and more” menu, or by selecting individual items and copying them via the “Copy” button in the toolbar.

Screenshot of Collections pane with “Sharing and more” menu opened with “Copy all” selected

Once you’ve copied items from your Collection, you can then paste them into your favorite apps, like OneNote or Email. If you are pasting into an app that supports HTML you will get a rich copy of the content.

Screenshot of pasting a shopping list from Collections into Outlook

Try out Collections

You can get started by opening the Collections pane from the button next to the address bar.

When you open the Collections pane, select Start new collection and give it a name. As you browse, you can start to add content related to your collection.

Screenshot showing the Collections pane in Microsoft Edge

Send Feedback

Now that we’re on by default, we hope that more of you will give us a try. Thank you again to all of you that have been using the feature and sending us feedback. If you think something’s not working right, or if there’s some capability you’d like to see added, please send us feedback using the smiley face icon in the top right corner of the browser.

Screenshot highlighting the Send Feedback button in Microsoft Edge

Thanks for continuing to be a part of this preview!

The post Get started with Collections in Microsoft Edge appeared first on Microsoft Edge Blog.


Networking enables the new world of Edge and 5G Computing

$
0
0

At the recent Microsoft Ignite 2019 conference, we introduced two new and related perspectives on the future and roadmap of edge computing.

Before getting further into the details of Network Edge Compute (NEC) and Multi-access Edge Compute (MEC), let’s take a look at the key scenarios which are emerging in line with 5G network deployments. For a decade, we have been working with customers to move their workloads from their on-premises locations to Azure to take advantage of the massive economies of scale of the public cloud. We get this scale with the ongoing build-out of new Azure regions and the constant increase of capacity in our existing regions, reducing the overall costs of running data centers.

For most workloads, running in the cloud is the best choice. Our ability to innovate and run Azure as efficiently as possible allows customers to focus on their business instead of managing physical hardware and associated space, power, cooling, and physical security. Now, with the advent of 5G mobile technology promising larger bandwidth and better reliability, we see significant requirements for low latency offerings to enable scenarios such as smart-buildings, factories, and agriculture. The “smart” prefix highlights that there is a compute-intensive workload, typically running machine learning or artificial intelligence-type logic, requiring compute resources to execute in near real-time. Ultimately the latency, or the time from when data is generated to the time it is analyzed, and a meaningful result is available, becomes critical for these smart-scenarios. Latency has become the new currency, and to reduce latency we need to move the required computing resources closer to the sensors, data origin or users.

Multi-access Edge Compute: The intersection of compute and networking

Internet of Things (IoT) creates incredible opportunities, but it also presents real challenges. Local connectivity in the enterprise has historically been limited to Ethernet and Wi-Fi. Over the past two decades, Wi-Fi has become the de-facto standard for wireless networks, not due to it necessarily being the best solution, but rather its entrenchment in the consumer ecosystem and lack of alternatives. Our customers from around the world tell us that deploying Wi-Fi to service their IoT devices requires compromises on coverage, bandwidth, security, manageability, reliability, and interoperability/roaming. For example, autonomous robots require better bandwidth, coverage, and reliability to operate safely within a factory. Airports generally have decent Wi-Fi coverage inside the terminals, but on the tarmac, coverage often drops significantly, making it insufficient and less suitable to power the smart airport.

Next-gen private cellular connectivity greatly improves bandwidth, coverage, reliability, and manageability. Through the combination of local compute resources and private mobile connectivity (private LTE), we can enable many new scenarios. For instance, in the smart factory example used earlier customers are now able to run their robotic control logic, highly available and independent of connectivity to the public cloud. MEC helps ensure that operations and any associated critical first-stage data processing remain up and production can continue uninterrupted.

With its promise and advantage of near-infinite compute and storage, the cloud is ideal for large data-intensive and computational tasks, such as machine learning jobs for predictive maintenance analytics. At this year’s Ignite conference, we shared our thoughts and experience, along with a technology preview of MEC with Azure. The technology preview brings private mobile network capabilities to Azure Stack Edge; an on-premises compute platform managed from Azure. In practical terms, the MEC allows locally controlling the robots; even if the factory suffers a network outage.

From an edge computing perspective, we have containers, running across Azure Stack Edge and Azure. A key aspect is that the same programming paradigm can be used for Azure and the edge-based MEC platform. Code can be developed and tested in the cloud, then seamlessly deployed at the edge. Developers can take advantage of the vast array of DevOps tools and solutions available in Azure and apply them to the new exciting edge scenarios. The MEC technology preview focuses on the simplified experience of cross-premises deployment and operations of managed compute and Virtual Network Functions with integration to existing Azure services.

Network Edge Compute

Whereas Multi-access Edge Compute (MEC) is intended to be deployed at the customer’s premises, Network Edge Compute (NEC) is the network carrier equivalent, placing the edge computing platform within their network. Last week we announced the initial deployment of our NEC platform in AT&T’s Dallas facility. Instead of needing to access applications and games running in the public cloud, software providers can bring their solutions physically closer to their end-users. At AT&T’s Business Summit we gave an augmented reality demonstration, working with Taqtile, and showed how to perform maintenance on an aircraft landing gear.

Image of industrial machinist operating advanced robotic equipment

The HoloLens user sees the real landing gear along with the virtual manual along with specific parts of the landing gear virtually highlighted. The mixing of real-world and virtual objects displayed via HoloLens is what is often referred to as augmented reality (AR) or mixed reality (MR).

Edge Computing Scenarios

We have been showcasing multiple MEC and NEC use-cases over these past few weeks. For more details please refer to our Microsoft Ignite MEC and 5G session.

Mixed Reality (MR)

Mixed reality use cases such as remote assistance can revolutionize several industrial automation scenarios. Lower latencies and higher bandwidth coupled with local compute, enables new remote rendering scenarios to reduce battery consumption in handsets and MR devices.

Retail e-fulfillment

Attabotics provides a robotic warehousing and fulfillment system for the retail and supply chain industries. Attabotics employs robots (Attabots) for storage and retrieval of goods from a grid of bins. A typical storage structure has about 100,000 bins and is serviced by between 60 and 80 Attabots. Azure Sphere powers the robots themselves. Communications using Wi-Fi or traditional 900 MHz spectrum does not meet the scale, performance and reliability requirements.
   Flow chart type graphic, depicting service chaining of warehouse robot connected to cloud services via radio controller and 5G packet core
The Nexus robot control system, used for command and control of the warehousing system, is built natively on Azure and uses Azure IoT Central for telemetry. With a Private LTE (CBRS) radio from our partners Sierra Wireless and Ruckus Wireless and packet core partner Metaswitch, we enabled the Attabots to communicate over a private LTE network. The reduced latency improved reliability and made the warehousing solution more efficient. The entire warehousing solution, including the private LTE network used for a warehouse, run on a single Azure Stack Edge.

Gaming

Multi-player online gaming is one of the canonical scenarios for low-latency edge computing. Game Cloud Studios has developed a game based on Azure Play Fab, called Tap and Field. The game backend and controls run on Azure, while the game server instances reside and run on the NEC platform. Having lower latencies results in better gaming experiences for players who are nearby in venues such as e-sport events, arcades, arenas, and similar venues.

Public Safety

The proliferation of drone use is disrupting many industries, from security and privacy to the delivery of goods. Air Traffic Control operations are on the cusp of one of the most significant disruptive events in the field, going from monitoring only dozens of aircrafts today to thousands tomorrow. This necessitates a sophisticated near real-time tracking system. Vorpal VigilAir has built a solution where drone and operator tracking is done using a distributed sensor network powered by a real-time tracking application running on the NEC.
Map imagery with overlays demonstrating mobile network/LTE coverage of industrial site

Data-driven digital agriculture solutions

Azure FarmBeats is an Azure solution that enables aggregation of agriculture datasets across providers, and generation of actionable insights by building artificial intelligence (AI) or machine learning (ML) models by fusing the datasets. Gathering datasets from sensors distributed across the farm requires a reliable private network, and generating insights requires a robust edge computing platform that is capable of being operated in a disconnected mode in remote locations where connectivity to the cloud is often sparse. Our solution, based on the Azure Stack Edge along with a managed private LTE network, offers a reliable and scalable connectivity fabric along with the right compute resources close to the farm.

MEC, NEC, and Azure: Bringing compute everywhere

MEC enables a low-latency connected Azure platform in your location, NEC provides a similar platform in a network carrier’s central office, and Azure provides a vast array of cloud services and controls.

At Microsoft, we fundamentally believe in providing options for all customers. Because it is impractical to deploy Azure datacenters in every major metropolitan city throughout the world, our new edge computing platforms provide a solution for specific low-latency application requirements that cannot be satisfied in the cloud. Software developers can use the same programming and deployment models for containerized applications using MEC where private mobile connectivity is required, deploying to NEC where apps are optimally located outside the customer’s premises, or directly in Azure. Many applications will look to take advantage of combined compute resources across the edge and public cloud.

We are building a new extended platform and continue to work with the growing ecosystem of mobile connectivity and edge computing partners. We are excited to enable a new wave of innovation unleashed by the convergence of 5G, private mobile connectivity, IoT and containerized software environments, powered by new and distributed programming models. The next phase of computing has begun.

We made Windows Server Core container images >40% smaller

$
0
0

Over the past year, we’ve been working with the Windows Server team to make Windows Server Core container images a lot smaller. They are now >40% smaller! The Windows Server team has already published the new images in the Server Core Insider Docker repo, and will eventually publish them to their stable repo with their 20H1 release. You can check them out for yourself. I’ll tell you how we did it and what you need to know to take advantage of the improvements.

Let’s start with the numbers:

  • Insider images are >40% smaller than the latest (patched) 1903 images.
  • Container startup into Windows PowerShell is 30-45% faster.

These measurements are based on images in the Windows Server Core insiders Docker repo. We used PowerShell as a proxy for any .NET Framework application, but also because we expect that PowerShell is used a lot in containers.

The improvements should apply to any scenario where you use Windows Server Core containers images. It should be most beneficial and noticeable for scaling applications in production, CI/CD and any other workflow that pulls images without the benefit of a Docker image cache or that has a need for faster startup.

A case of playing poorly with container layers

We started this project with the hypothesis that the way .NET Framework is packaged and installed does not play nicely with the way Docker layers work. We found that this was the case based on an investigation we did over a year ago.

As background, Docker creates a read-only layer for each command in a Dockerfile, like FROM, RUN and even ENV. If files are updated in multiple layers, you will end up carrying multiple copies of that file in the image even though there is only one copy in the final image layer (the one you see and use). We found that this situation was common with .NET Framework container images. This is similar to the way Git works with binaries, if you are familiar with that model. If this makes you cringe, then you are following along perfectly well.

.NET Framework Dockerfiles are open source, so I will use them as examples in the rest of the post. They are also a good source of Docker-related techniques if you want to customize your own Dockerfiles further.

The Dockerfile for .NET Framework 4.8 on Windows Server Core 2019 demonstrates the anti-pattern we’re wanting to fix, of updating files multiple times in different layers, as follows:

# escape=`

FROM mcr.microsoft.com/windows/servercore:ltsc2019

# Install .NET 4.8
RUN curl -fSLo dotnet-framework-installer.exe https://download.visualstudio.microsoft.com/download/pr/7afca223-55d2-470a-8edc-6a1739ae3252/abd170b4b0ec15ad0222a809b761a036/ndp48-x86-x64-allos-enu.exe `
    && .dotnet-framework-installer.exe /q `
    && del .dotnet-framework-installer.exe `
    && powershell Remove-Item -Force -Recurse ${Env:TEMP}*

# Apply latest patch
RUN curl -fSLo patch.msu http://download.windowsupdate.com/c/msdownload/update/software/updt/2019/09/windows10.0-kb4515843-x64_181da0224818b03254ff48178c3cd7f73501c9db.msu `
    && mkdir patch `
    && expand patch.msu patch -F:* `
    && del /F /Q patch.msu `
    && DISM /Online /Quiet /Add-Package /PackagePath:C:patchWindows10.0-kb4515843-x64.cab `
    && rmdir /S /Q patch

# ngen .NET Fx
ENV COMPLUS_NGenProtectedProcess_FeatureEnabled 0
RUN WindowsMicrosoft.NETFramework64v4.0.30319ngen uninstall "Microsoft.Tpm.Commands, Version=10.0.0.0, Culture=Neutral, PublicKeyToken=31bf3856ad364e35, processorArchitecture=amd64" `
    && WindowsMicrosoft.NETFramework64v4.0.30319ngen update `
    && WindowsMicrosoft.NETFrameworkv4.0.30319ngen update

Lets’s dive into what the Dockerfile is actually doing. The first FROM line pulls Windows Server Core 2019, which includes .NET Framework 4.7.2. The following RUN line then installs .NET Framework 4.8 on top. The middle RUN line services .NET Framework 4.8 with the latest patches. The last RUN line runs the ngen tool to create or update NGEN images, if needed. Many files are being updated multiple times with this series of commands. Each time a file is updated, the size of the image increases by the size of the new “duplicate” file.

In the worst case scenario, four copies of many files are created, and that doesn’t account for the fact that each file has IL and NGEN variants, for x86 and x64. The size explosion starts to become apparent and is hard to fully grasp without a full accounting in a spreadsheet.

Stepping back, not all file updates are equal. For example, you can (in theory) update a 1 KB text file 500 times before it will have the same impact of updating a 500 KB file once. We found that NGEN image files were the worst offender. NGEN images are generated by ngen.exe (which you see used in the Dockerfile) to improve startup performance. They are also big, typically 3x larger than their associated IL files. It quickly became clear that NGEN images were going to be a primary target for a solution.

Designing a container-friendly approach

Architecturally, we had three design characteristics that we wanted in a solution:

  • There should be a single copy of each file in the .NET Framework, across all container image layers published by Microsoft.
  • NGEN images that are created by default should align with default use cases.
  • Maintain startup performance as container image size is reduced.

The biggest risk was the last characteristic, about maintaining startup performance, given that our primary startup performance lever — NGEN — was the primary target for reducing container image size. You already know how the story ends from the introduction, but let’s keep digging, and look at what we did in preparation for Windows Server Core 20H1 images (what is in Insiders now).

Here’s what we did in the Windows Server Core base image layer:

  • Include a serviced copy of .NET Framework 4.8.
  • Remove all NGEN images, except for the three most critical ones, for both x86 and x64. These images are for mscorlib.dll, System.dll and System.Core.dll.

Here’s what we did in the .NET Framework runtime image layer:

  • NGEN assemblies used by Windows PowerShell and ASP.NET (and no more).
  • NGEN only 64-bit assemblies. The only 32-bit NGEN images are the three included in the Server Core base image.

You can see these changes in the Dockerfile for .NET Framework 4.8 on the Windows Server Core Insider image, as follows:

# escape=`

FROM mcr.microsoft.com/windows/servercore/insider:10.0.19023.1

# Enable detection of running in a container
ENV DOTNET_RUNNING_IN_CONTAINER=true

RUN `
    # Ngen top of assembly graph to optimize a set of frequently used assemblies
    WindowsMicrosoft.NETFramework64v4.0.30319ngen install "Microsoft.PowerShell.Utility.Activities, Version=3.0.0.0, Culture=neutral, PublicKeyToken=31bf3856ad364e35"
    # To optimize 32-bit assemblies, uncomment the next line and add an escape character (`) to the end of the previous line
    # && WindowsMicrosoft.NETFrameworkv4.0.30319ngen install "Microsoft.PowerShell.Utility.Activities, Version=3.0.0.0, Culture=neutral, PublicKeyToken=31bf3856ad364e35"

This Dockerfile is much simpler, but we’ll still take a deeper look. The FROM statement pulls the Windows Server Core Insider base image layer, which already contains the (serviced) version of the .NET Framework we want. This is why there are no subsequent RUN statements that download and install later or serviced .NET Framework versions. The single RUN statement uses ngen to pre-compile a curated set of assemblies that we expect will benefit most .NET applications, but only for the 64-bit version of .NET Framework.

This much more streamlined approach has the following key benefits:

  • The Windows Server Core base image is now a lot smaller, and will be a massive benefit for Windows applications that don’t use .NET Framework. They still contain the .NET Framework but only a much smaller set of the NGEN images as compared to the 1903 base image.
  • The .NET Framework container image is also significantly smaller because it is now constructed in a way that much better aligns with the way Docker layers and images work and it contains a much smaller and curated set of NGEN images.

In terms of guidance, this new approach means that you should strongly prefer the .NET Framework runtime (or SDK) image if you are using Windows PowerShell or containerizing a .NET Framework application. It also means that it makes more sense to customize NGEN in your own Dockerfiles since the images Microsoft produces have much fewer NGEN images to start with.

Looking back at the new .NET Framework runtime Dockerfile, you can see that the last line is commented, which would otherwise NGEN assemblies for the 32-bit .NET Framework. You should consider uncommenting this line if you run 32-bit .NET Framework applications. You would need to either copy this line to your application Dockerfile (typically as the first line after the FROM statement) or use this Dockerfile as an alternative to using the .NET Framework runtime image.

If you use your own version of this Dockerfile, then you can customize it further. For example, you could target a smaller or different set of assemblies that are specifically chosen for only your application.

Performance of the new approach

I’m finally going to share the performance numbers! I’ll explain a few more things first, to make sure you’ve got the right context.

Like I said earlier, our primary goal wasn’t to improve the startup time of PowerShell or ASP.NET, but maintain it as we reduced the size of container images. Turns out that we did better than that, but let me ignore our achievements for a moment to make a point. If you are not familar with containers, it may not be obvious how valuable achieving that goal really is. I’ll explain it.

For many scenarios, image size ends up being a dominant startup cost because images need to be pulled across a network as part of docker run. This is the case for scenarios where the container environment doesn’t maintain an image cache (more common than you might think).

If the value here still isn’t popping, I’ll try an anology (I really love analogies). Imagine you and I are racing two cars on a track. I’m racing a white one with a red maple leaf … OK, OK, the color doesn’t matter! The gun goes off and fans are expecting us to start tearing down the track. Instead of hitting the gas pedals, we jump out of the cars and first fill up our gas tanks, then jump back in and finally start moving forward to do the job we were paid to do (race the cars!). That’s basically what docker run has to do if you don’t have a local copy of an image.

With this improvement in place, we still have to jump out of the cars when the gun goes up, but your car tank is now half the size it was before, so filling it is much quicker, HOWEVER the car still goes the same speed and distance. Unfortunately for me, you win the race because I’m stuck with the older version of the car! Unlucky me.

I’m going to stretch this analogy a little further. I said that your tank fills up in half the time now, but still goes the same speed and distance. It turns out that we managed to make the car go faster, too, and it can still go just as far. Sounds awesome! That’s basically the same thing we achieved.

OK, back to reality … let’s look at the actual results we saw, as measured in our performance lab. Performance scenarios are on the left and the different container images in which we measured them are on top.

1903 1903-FX Insider Insider-FX
Size compressed (GB) 2.11 2.18 1.13 1.19
Size uncompressed (GB) 5.03 5.29 2.63 2.89
Container launch (s) 6.7 6.67 4.68 3.61
PowerShell launch (s) 0.64 0.13 0.73 0.15

Note: The 1903 image is the latest version of 1903, with nearly as year of patches (which increase the size of the image).

Legend:

  • 1903: mcr.microsoft.com/windows/servercore:1903
  • 1903-FX: mcr.microsoft.com/dotnet/framework/runtime:4.8-20191008-windowsservercore-1903
  • Insider: mcr.microsoft.com/windows/servercore/insider:10.0.19023.1
  • Insider-FX: image built from runtime Dockerfile
  • Size compressed (GB) — this is the size of an image, in gigabytes, within a registry and when you pull it (AKA “over the wire”).
  • Size uncompressed (GB) — this is the size of an image, in gigabytes, on disk after you pull it. It is uncompressed so that it is fast to run.
  • Container launch (s) — This is the time it takes, in seconds, to launch a container, into PowerShell. It is equivalent to: docker run --rm DOCKERIMAGE powershell exit.
  • PowerShell launch (s) — This the time it takes, in seconds, to launch PowerShell within a running container. It is equivalent to: powershell exit.

I’ll give you the value-oriented summary of what those numbers are actually telling us.

For the Windows Server Core Insider base image:

  • The compressed Insider image is 46% smaller than the 1903 base image.
  • The uncompressed Insider image is 47% smaller than the 1903 base image.
  • Container startup into Windows PowerShell is 30% faster, when using the Insider image compared to the 1903 base image.
  • Windows PowerShell startup within a running container is slower with the Insider image than the 1903 base image, by 100ms (15%) on our hardware.

For the .NET Framework runtime image, based on the new Windows Server Core Insider base image:

  • The compressed .NET Framework runtime image is 45% smaller than the 1903 runtime image.
  • The uncompressed .NET Framework runtime image is 45% smaller than the 1903 runtime image.
  • Container startup into Windows PowerShell is 45% faster, using the .NET Framework runtime image compared to the 1903 runtime image.
  • Windows PowerShell startup within a running container is slower with the Insider-based runtime image than the 1903 runtime image, by 20ms (15%) on our hardware. We are investigating why startup is slower in this scenario. It shouldn’t be.
  • We specifically measured the benefit of not including 32-bit images in the runtime image. It is 70MB in the compressed image and 300 MB in the uncompressed image.

Note: The drop in size is probably closer to 40% in actuality. We are comparing an Insider image to a serviced 1903 image (nearly a year of patches that cause size increases). Still, the measurements are in the right ball park and a big win. Also, we expect these numbers to change before the Windows Server 20H1 release, either a little better or a little worse, but not far off what I’ve described here.

If you are interested in the details or reproducing these numbers yourself, the following list details the measurements we made and some of our methodology.

  • Size compressed: Retrieving Docker Image Sizes
  • Size uncompressed: docker images
  • Container launch (run from the host, in PowerShell): powershell
    $a = @(); 1..5 | % { $a += (measure-command { docker run --rm DOCKERIMAGE powershell exit }).TotalSeconds }; $a
  • PowerShell launch (run from inside the container, in PowerShell): powershell
    $a = @(); 1..5 | % { $a += (measure-command { powershell exit } ).TotalSeconds } ; $a

Note: All launch measurements listed are the average of the middle 3 of 5 test runs.

PowerShell launch is run from within PowerShell. This approach could be viewed as a weak test methodology. Instead, it is a practical pattern for what we are measuring, which is the reduction of JIT time. The second PowerShell instance will be in a second process. There is some benefit from launching PowerShell from PowerShell because read-only pages will be shared across processes. JITed code is written to read-write pages, which are not shared across process boundaries, such that the actual code execution of PowerShell will be unique in both processes and sensitive to the need to JIT at startup. As a result, the difference in startup numbers is primarily due to the reduction in JIT compilation required during startup. That also explains why we are only measuring powershell exit (we are only targeting startup for the scenario). Feel free to measure this and other scenarios and give us your feedback. We’d appreciate that.

We haven’t yet started measuring the performance improvement to the .NET Framework SDK image. We expect to see size and container startup improvements for that image, too. You can see an early version of the .NET Framework SDK image Dockerfile that you can see and test.

Forward-looking Guidance

Starting with the next version of Windows Server, we have the following guidance for Windows container users:

  • If you are using .NET Framework applications with Windows containers, including Windows PowerShell, use a .NET Framework image.
  • If you are not using .NET, use the Windows Server Core base image, or another image derived from it.
  • If you need better startup performance than the .NET Framework runtime image has to offer, we recommend creating your own images with your own profile of NGEN images. This is considered a supported scenario, and doesn’t disqualify you from getting support from Microsoft.

Closing

A lot of our effort on Docker containers has been focused on .NET Core, however, we have been looking for opportunities to improve the experience for .NET Framework users as well. This post describes such an improvement. Please tell us about other pain points for using .NET Framework in containers. We’d be interested in talking with you if you are using .NET Framework containers in production to learn more about what is working well and what isn’t.

Please give us feedback as you start adopting the new Windows Server Core container images. We intend to produce .NET Framework images for the next version of Windows Server Core as soon as 20H1 images are available in the Windows Docker repo.

The post We made Windows Server Core container images >40% smaller appeared first on .NET Blog.

What’s new in Azure DevOps Sprint 161

$
0
0

Sprint 161 has just finished rolling out to all organizations and you can check out all the new features in the release notes. Here are some of the features that you can start using today.

Create bulk subscriptions in Azure Pipelines app for Slack and Microsoft Teams

Users of the Azure Pipelines app for Slack and Microsoft Teams can now bulk subscribe to all of the pipelines in a project. You can use filters to manage what gets posted in the Slack or Teams channels. You can continue to subscribe to individual pipelines too.

Checkout multiple repositories in Azure Pipelines

Pipelines often rely on multiple repositories. You can have different repositories with source, tools, scripts, or other items that you need to build your code. Previously, you had to add these repositories as submodules or as manual scripts to run git checkout. Now you can fetch and check out other repositories, in addition to the one you use to store your YAML pipeline.

Use GitHub Actions to trigger a run in Azure Pipelines

GitHub Actions make it easy to build, test, and deploy your code right from GitHub. We now have GitHub Actions for Azure Pipelines (Azure/pipelines). You can use Azure/pipelines to trigger a run in Azure Pipelines as part of your GitHub Actions workflow.

You can use this action to trigger a specific pipeline (YAML or classic release pipeline) in Azure DevOps. GitHub Actions will take the Project URL, pipeline name, and a Personal Access Token (PAT) for your Azure DevOps organization as inputs.

These are just the tip of the iceberg, and there are plenty more features that we’ve released in Sprint 161. Check out the full list of features for this sprint in the release notes.

The post What’s new in Azure DevOps Sprint 161 appeared first on Azure DevOps Blog.

Introducing maintenance control for platform updates

$
0
0

Today we are announcing the preview of a maintenance control feature for Azure Virtual Machines that gives more control to customers with highly sensitive workloads for platform maintenance. Using this feature, customers can control all impactful host updates, including rebootless updates, for up to 35 days.

Azure frequently updates its infrastructure to improve the reliability, performance, and security, or to launch new features. Almost all updates have zero impact on your Azure virtual machines (VMs). When updates do have an effect, Azure chooses the least impactful method for updates:

  • If the update does not require a reboot, the VM is briefly paused while the host is updated, or it's live migrated to an already updated host. These rebootless maintenance operations are applied fault domain by fault domain, and progress is stopped if any warning health signals are received.
  • In the extremely rare scenario when the maintenance requires a reboot, the customer is notified of the planned maintenance. Azure also provides a time window in which you can start the maintenance yourself, at a time that works for you.

Typically, rebootless updates do not impact the overall customer experience. However, certain very sensitive workloads may require full control of all maintenance activities. This new feature will benefit those customers who deploy this type of workload.

Who is this for?

The ability to control the maintenance window is particularly useful when you deploy workloads that are extremely sensitive to interruptions running on an Azure Dedicated Host or an Isolated VM, where the underlying physical server runs a single customer’s workload. This feature is not supported for VMs deployed in hosts shared with other customers.

The typical customer who should consider using this feature requires full control over updates because while they need to have the latest updates in place, their business requires that at least some of their cloud resources must be updated with zero impact on their own schedule.

Customers like financial services providers, gaming companies, or media streaming services using Azure Dedicated Hosts or Isolated VMs will benefit by being able to manage necessary updates without any impact on their most critical Azure resources.

How does it work?

A diagram showing how this feature works.

You can enable the maintenance control feature for platform updates by adding a custom maintenance configuration to a resource (either an Azure Dedicated Host or an Isolated VM). When the Azure updater sees this custom configuration, it will skip all non-zero-impact updates, including rebootless updates. For as long as the maintenance configuration is applied to the resource, it will be your responsibility to determine when to initiate updates for that resource. You can check for pending updates on the resource and apply updates within the 35-day window. When you initiate an update on the resource, Azure applies all pending host updates. A new 35-day window starts after another update becomes pending on the resource. If you choose not to apply the updates within the 35-day window, Azure will automatically apply all pending updates for you, to ensure that your resources remain secure and get other fixes and features.

Things to consider

  • You can automate platform updates for your maintenance window by calling “apply pending update” commands through your automation scripts. This can be batched with your application maintenance. You can also make use of Azure Functions and schedule updates at regular intervals.
  • Maintenance configurations are supported across subscriptions and resource groups, so you can manage all maintenance configurations in one place and use them anywhere they're needed.

Getting started

The maintenance control feature for platform updates is available in preview now. You can get started by using CLI, PowerShellREST APIs, .NET, or SDK. Azure portal support will follow.

For more information, please refer to the documentation: Maintenance for virtual machines in Azure.

FAQ

Q: Are there cases where I can’t control certain updates? 

A:  In case of a high-severity security issue that may endanger the Azure platform or our customers, Azure may need to override customer control of the maintenance window and push the change. This is a rare occurrence that would only be used in extreme cases, such as a last resort to protect you from critical security issues.

Q: If I don’t self-update within 35-days what action will Azure take?

A:  If you don’t execute a platform update within 35-days, Azure will apply the pending updates on a fault domain by fault domain basis. This is done to maintain security and performance, and to fix any defects.

Q: Is this feature supported in all regions?

A:   Maintenance Control is supported in all public cloud regions. Currently we don't support gov cloud regions, but this support will come later.

Microsoft partner ANSYS extends ability of Azure Digital Twins platform

$
0
0

Digital twins have moved from an exciting concept to reality. More companies than ever are connecting assets and production networks with sensors and using analytics to optimize operations across machinery, plants, and industrial networks. As exact virtual representations of the physical environment, digital twins incorporate historical and real-time data to enable sophisticated spatial analysis of key relationships. Teams can use digital twins to model the impact of process changes before putting them into production, reducing time, cost, and risk.

For the second year in a row, Gartner has identified digital twins as one of the top 10 strategic technology trends. According to Gartner, while 13 percent of organizations that are implementing IoT have already adopted digital twins, 62 percent are in the process or plan to do so. Gartner predicts a tipping point in 2022 when two out of three companies will have deployed at least one digital twin to optimize some facet of their business processes.

This is why we’re excited by the great work of ANSYS, a Microsoft partner working to extend the value of the Microsoft Azure Digital Twins platform for our joint customers. The ANSYS Twin Builder combines the power of physics-based simulations and analytics-driven digital twins to provide real-time data transfer, reusable components, ultrafast modeling, and other tools that enable teams to perform myriad “what-if” analyses, and build, validate, and deploy complex systems more easily.

“Collaborating with ANSYS to create an advanced IoT digital twins framework provides our customers with an unprecedented understanding of their deployed assets’ performance by leveraging physics and simulation-based analytics.” — Sam George, corporate vice president of Azure IoT, Microsoft

Digital twins model key relationships, simplifying design

Digital twins will be first and most widely adopted in manufacturing, as industrial companies invest millions to build, maintain, and track the performance of remotely deployed IoT-enabled assets, machinery, and vehicles. Operators depend on near-continuous asset uptime to achieve production goals, meaning supply-chain bottlenecks, machine failures, or other unexpected downtime can hamper production output and reduce revenue recognition for the company and its customers. The use of digital twins, analytics, business rules, and automation helps companies avoid many of these issues by guiding decision-making and enabling instant informed action.

Digital twins can also simulate a multidimensional view of asset performance that can be endlessly manipulated and perfected prior to producing new systems or devices, ending not just the guesswork of manually predicting new processes, but also the cost of developing multiple prototypes. Digital twins, analytics-based tools, and automation also equip companies to avoid unnecessary costs by prioritizing issues for investment and resolution.

Digital twins can optimize production across networks

Longer-term, companies can more easily operate global supply chains, production networks, and digital ecosystems through the use of IoT, digital twins, and other tools. Enterprise teams and their partners will be able to pivot from sensing and reacting to changes to predicting them and responding immediately based on predetermined business rules. Utilities will be better prepared to predict and prevent accidents, companies poised to address infrastructure issues before customers complain, and stores more strategically set up to maintain adequate inventories.

Simulations increase digital twins’ effectiveness

ANSYS’ engineering simulation software enables customers to model the design of nearly every physical product or process. The simulations are then compiled into runtime modules that can execute in a docker container and integrate automatically into IoT processing systems, reducing the heavy lift of IoT customization.

With the combined Microsoft Azure Digital Twins-ANSYS physics-based simulation capabilities, customers can now:

  • Simulate baseline and failure data resulting in accurate, physics-based digital twins models.
  • Use physics-based predictive models to increase accuracy and improve ROI from predictive maintenance programs.
  • Leverage “what-if analyses” to simulate different solutions before selecting the best one.
  • Use virtual sensors to estimate critical quantities through simulation.

Engineering software

In addition, companies can use physics-based simulations within the Microsoft-ANSYS platform to pursue high-value use cases such as these:

  •  Optimize asset performance: Teams can use digital twins to model asset performance to evaluate current performance versus targets, identifying, resolving, and prioritizing issues for resolution based on the value they create.
  •  Manage systems across their lifecycle: Teams can take a systems approach to managing complex and costly assets, driving throughput and retiring systems at the ideal time to avoid over-investing in market-lagging capabilities.
  •  Perform predictive maintenance: Teams can use analytics to determine and schedule maintenance, reduce unplanned downtime and costly break-fix repairs, and perform repairs in order of importance, which frees team members from unnecessary work.
  •  Orchestrate systems: Companies will eventually create systems of intelligence by linking their equipment, systems, and networks to orchestrate production across plants, campuses, and regions, attaining new levels of visibility and efficiency.
  •  Fuel product innovation: With rapid virtual prototyping, teams will be able to explore myriad product versions, reducing the time and cost required to innovate products, decreasing product failures, and enabling the development of customized products.
  •  Enhance employee training: Companies can use digital twins to conduct training with employees, improving their effectiveness on the job while reducing production design errors due to human error.
  •  Eliminate physical constraints: Digital twins eliminate the physical barriers to experimentation, meaning users can simulate tests and conditions for remote assets, such as equipment in other plants, regions, or space.

Opening up new opportunities for partners

According to Gartner, more than 20 billion connected devices are projected by 2020 and adoption of IoT and digital twins is only going to accelerate—in fact, MarketsandMarkets™ estimates that the digital twins market will reach a value of $3.8 billion in 2019 and grow to $35.8 billion by 2025. Our recent IoT Signals research found that 85 percent of decision-makers have already adopted IoT, 74 percent have projects in the “use” phase, and businesses expect to achieve 30 percent ROI on their IoT projects going forward. The top use case participants want to pursue is operations optimization (56 percent), to reap more value from the assets and processes they already possess. That’s why digital twins is so important right now because it provides a framework to accomplish this goal with greater accuracy than was possible before.

“As industrial companies require comprehensive field data and actionable insights to further optimize deployed asset performance, ecosystem partners must collaborate to form business solutions. ANSYS Twins Builder’s complementary simulation data stream augments Azure IoT Services and greatly enhances its customers’ understanding of asset performance.”—Eric Bantegnie, vice president and general manager at ANSYS

Thanks to Microsoft partners like ANSYS, companies are better equipped to unlock productivity and efficiency gains by removing critical constraints, including physical barriers, from process modeling. With tools like digital twins, companies will be limited only by their own creativity, creating a more intelligent and connected world where all have more opportunities to flourish.

Learn more about Microsoft Azure Digital Twins and ANSYS Twin Builder.

Azure Stack HCI now running on HPE Edgeline EL8000

$
0
0

Do you need rugged, compact-sized hyperconverged infrastructure (HCI) enabled servers to run your branch office and edge workloads? Do you want to modernize your applications and IoT functions with container technology? Do you want to leverage Azure's hybrid services such as backup, disaster recovery, update management, monitoring, and security compliance? 

Well, Microsoft and HPE have teamed up to validate the HPE Edgeline EL8000 Converged Edge system for Microsoft's Azure Stack HCI program. Designed specifically for space-constrained environments, the HPE Edgeline EL8000 Converged Edge system has a unique 17-inch depth form factor that fits into limited infrastructures too small for other x86 systems. The chassis has an 8.7-inch width which brings additional flexibility for deploying at the deep edge, whether it is in a telco environment, a mobile vehicle, or a manufacturing floor. This Network Equipment-Building System (NEBs) compliant system delivers secure scalability.

HPE Edgeline EL8000 Converged Edge system gives:

  • Traditional x86 compute optimized for edge deployments, far from the traditional data center without the sacrifice of compute performance.
  • Edge-optimized remote system management with wireless capabilities based on Redfish industry standard.
  • Compact form factor, with short-depth and half-width options.
  • Rugged, modular form factor for secure scalability and serviceability in edge and hostile environments including NEBs level three and American Society of Heating, Refrigerating and Air-Conditioning Engineers (ASHRAE) level three/four compliance.
  • Broad accelerator support for emerging edge artificial intelligence (AI) use cases, for field programmable gate arrays or graphics processing units.
  • Up to four independent compute nodes, which are cluster-ready with embedded networks.

Modular design providing broad configuration possibilities

The HPE Edgeline EL8000 Converged Edge system offers flexibility of choice for compute density or for input/output expansion. These compact, ruggedized systems offer high-performance capacity to support the use cases that matter most, including media streaming, IoT, AI, and video analytics. The HPE Edgeline EL8000 is a versatile platform that enables edge compute transformation so as use case requirements change, the system's flexible and modular architecture can scale to meet them.

Seamless management and security features with HPE Edgeline Chassis Manager

The HPE Edgeline EL8000 Converged Edge system features the HPE Edgeline Chassis Manager which limits downtime by providing system-level health monitoring and alerts. Increase efficiency and reliability by managing the chassis fan speeds for each server blade installed in addition to monitoring the health and status of the power supply. It simplifies firmware upgrade management and implementation with HPE Edgeline Chassis Manager.

Microsoft Azure Stack HCI:

Azure Stack HCI solutions bring together highly virtualized compute, storage, and networking on industry-standard x86 servers and components. Combining resources in the same cluster makes it easier for you to deploy, manage, and scale. Manage with your choice of command-line automation or Windows Admin Center.

Achieve industry-leading virtual machine performance for your server applications with Hyper-V, the foundational hypervisor technology of the Microsoft cloud, and Storage Spaces Direct technology with built-in support for non-volatile memory express (NVMe), persistent memory, and remote-direct memory access (RDMA) networking.

Help keep apps and data secure with shielded virtual machines, network microsegmentation, and native encryption.

You can take advantage of cloud and on-premises working together with a hyperconverged infrastructure platform in the public cloud. Your team can start building cloud skills with built-in integration to Azure infrastructure management services, including:

  • Azure Site Recovery for high availability and disaster recovery as a service (DRaaS).

  • Azure Monitor, a centralized hub to track what’s happening across your applications, network, and infrastructure – with advanced analytics powered by AI.

  • Cloud Witness, to use Azure as the lightweight tie breaker for cluster quorum.

  • Azure Backup for offsite data protection and to protect against ransomware.

  • Azure Update Management for update assessment and update deployments for Windows virtual machines (VMs) running in Azure and on-premises.

  • Azure Network Adapter to connect resources on-premises with your VMs in Azure via a point-to-site virtual private network (VPN.)

  • Sync your file server with the cloud, using Azure File Sync.

  • Azure Arc for Servers to manage role-based access control, governance, and compliance policy from Azure Portal.

By deploying the Microsoft and HPE HCI solution, you can quickly solve your branch office and edge needs with high performance and resiliency while protecting your business assets by enabling the Azure hybrid services built into the Azure Stack HCI Branch office and edge solution.  

Windows 10 SDK Preview Build 19035 available now!

$
0
0

Today, we released a new Windows 10 Preview Build of the SDK to be used in conjunction with Windows 10 Insider Preview (Build 19035 or greater). The Preview SDK Build 19035 contains bug fixes and under development changes to the API surface area.

The Preview SDK can be downloaded from developer section on Windows Insider.

For feedback and updates to the known issues, please see the developer forum. For new developer feature requests, head over to our Windows Platform UserVoice.

Things to note:

  • This build works in conjunction with previously released SDKs and Visual Studio 2017 and 2019. You can install this SDK and still also continue to submit your apps that target Windows 10 build 1903 or earlier to the Microsoft Store.
  • The Windows SDK will now formally only be supported by Visual Studio 2017 and greater. You can download the Visual Studio 2019 here.
  • This build of the Windows SDK will install on only on Windows 10 Insider Preview builds.
  • In order to assist with script access to the SDK, the ISO will also be able to be accessed through the following static URL: https://software-download.microsoft.com/download/sg/Windows_InsiderPreview_SDK_en-us_19035_1.iso.

Tools Updates

Message Compiler (mc.exe)

  • Now detects the Unicode byte order mark (BOM) in .mc files. If the If the .mc file starts with a UTF-8 BOM, it will be read as a UTF-8 file. Otherwise, if it starts with a UTF-16LE BOM, it will be read as a UTF-16LE file. If the -u parameter was specified, it will be read as a UTF-16LE file. Otherwise, it will be read using the current code page (CP_ACP).
  • Now avoids one-definition-rule (ODR) problems in MC-generated C/C++ ETW helpers caused by conflicting configuration macros (e.g. when two .cpp files with conflicting definitions of MCGEN_EVENTWRITETRANSFER are linked into the same binary, the MC-generated ETW helpers will now respect the definition of MCGEN_EVENTWRITETRANSFER in each .cpp file instead of arbitrarily picking one or the other).

Windows Trace Preprocessor (tracewpp.exe)

  • Now supports Unicode input (.ini, .tpl, and source code) files. Input files starting with a UTF-8 or UTF-16 byte order mark (BOM) will be read as Unicode. Input files that do not start with a BOM will be read using the current code page (CP_ACP). For backwards-compatibility, if the -UnicodeIgnore command-line parameter is specified, files starting with a UTF-16 BOM will be treated as empty.
  • Now supports Unicode output (.tmh) files. By default, output files will be encoded using the current code page (CP_ACP). Use command-line parameters -cp:UTF-8 or -cp:UTF-16 to generate Unicode output files.
  • Behavior change: tracewpp now converts all input text to Unicode, performs processing in Unicode, and converts output text to the specified output encoding. Earlier versions of tracewpp avoided Unicode conversions and performed text processing assuming a single-byte character set. This may lead to behavior changes in cases where the input files do not conform to the current code page. In cases where this is a problem, consider converting the input files to UTF-8 (with BOM) and/or using the -cp:UTF-8 command-line parameter to avoid encoding ambiguity.

TraceLoggingProvider.h

  • Now avoids one-definition-rule (ODR) problems caused by conflicting configuration macros (e.g. when two .cpp files with conflicting definitions of TLG_EVENT_WRITE_TRANSFER are linked into the same binary, the TraceLoggingProvider.h helpers will now respect the definition of TLG_EVENT_WRITE_TRANSFER in each .cpp file instead of arbitrarily picking one or the other).
  • In C++ code, the TraceLoggingWrite macro has been updated to enable better code sharing between similar events using variadic templates.

Signing your apps with Device Guard Signing

Windows SDK Flight NuGet Feed

We have stood up a NuGet feed for the flighted builds of the SDK. You can now test preliminary builds of the Windows 10 WinRT API Pack, as well as a microsoft.windows.sdk.headless.contracts NuGet package.

We use the following feed to flight our NuGet packages.

Microsoft.Windows.SDK.Contracts which can be used with to add the latest Windows Runtime APIs support to your .NET Framework 4.5+ and .NET Core 3.0+ libraries and apps.

The Windows 10 WinRT API Pack enables you to add the latest Windows Runtime APIs support to your .NET Framework 4.5+ and .NET Core 3.0+ libraries and apps.

Microsoft.Windows.SDK.Headless.Contracts provides a subset of the Windows Runtime APIs for console apps excludes the APIs associated with a graphical user interface. This NuGet is used in conjunction with

Windows ML container development. Check out the Getting Started guide for more information.

Breaking Changes

Removal of api-ms-win-net-isolation-l1-1-0.lib

In this release api-ms-win-net-isolation-l1-1-0.lib has been removed from the Windows SDK. Apps that were linking against api-ms-win-net-isolation-l1-1-0.lib can switch to OneCoreUAP.lib as a replacement.

Removal of IRPROPS.LIB

In this release irprops.lib has been removed from the Windows SDK. Apps that were linking against irprops.lib can switch to bthprops.lib as a drop-in replacement.

Removal of WUAPICommon.H and WUAPICommon.IDL

In this release we have moved ENUM tagServerSelection from WUAPICommon.H to wupai.h and removed the header. If you would like to use the ENUM tagServerSelection, you will need to include wuapi.h or wuapi.idl.

API Updates, Additions and Removals

The following APIs have been added to the platform since the release of Windows 10 SDK, version 1903, build 18362.

Additions:


namespace Windows.AI.MachineLearning {
  public sealed class LearningModelSessionOptions {
    bool CloseModelOnSessionCreation { get; set; }
  }
}
namespace Windows.ApplicationModel {
  public sealed class AppInfo {
    public static AppInfo Current { get; }
    Package Package { get; }
    public static AppInfo GetFromAppUserModelId(string appUserModelId);
    public static AppInfo GetFromAppUserModelIdForUser(User user, string appUserModelId);
  }
  public interface IAppInfoStatics
  public sealed class Package {
    StorageFolder EffectiveExternalLocation { get; }
    string EffectiveExternalPath { get; }
    string EffectivePath { get; }
    string InstalledPath { get; }
    bool IsStub { get; }
    StorageFolder MachineExternalLocation { get; }
    string MachineExternalPath { get; }
    string MutablePath { get; }
    StorageFolder UserExternalLocation { get; }
    string UserExternalPath { get; }
    IVectorView<AppListEntry> GetAppListEntries();
    RandomAccessStreamReference GetLogoAsRandomAccessStreamReference(Size size);
  }
}
namespace Windows.ApplicationModel.AppService {
  public enum AppServiceConnectionStatus {
    AuthenticationError = 8,
    DisabledByPolicy = 10,
    NetworkNotAvailable = 9,
    WebServiceUnavailable = 11,
  }
  public enum AppServiceResponseStatus {
    AppUnavailable = 6,
    AuthenticationError = 7,
    DisabledByPolicy = 9,
    NetworkNotAvailable = 8,
    WebServiceUnavailable = 10,
  }
  public enum StatelessAppServiceResponseStatus {
    AuthenticationError = 11,
    DisabledByPolicy = 13,
    NetworkNotAvailable = 12,
    WebServiceUnavailable = 14,
  }
}
namespace Windows.ApplicationModel.Background {
  public sealed class BackgroundTaskBuilder {
    void SetTaskEntryPointClsid(Guid TaskEntryPoint);
  }
  public sealed class BluetoothLEAdvertisementPublisherTrigger : IBackgroundTrigger {
    bool IncludeTransmitPowerLevel { get; set; }
    bool IsAnonymous { get; set; }
    IReference<short> PreferredTransmitPowerLevelInDBm { get; set; }
    bool UseExtendedFormat { get; set; }
  }
  public sealed class BluetoothLEAdvertisementWatcherTrigger : IBackgroundTrigger {
    bool AllowExtendedAdvertisements { get; set; }
  }
}
namespace Windows.ApplicationModel.ConversationalAgent {
  public sealed class ActivationSignalDetectionConfiguration
  public enum ActivationSignalDetectionTrainingDataFormat
  public sealed class ActivationSignalDetector
  public enum ActivationSignalDetectorKind
  public enum ActivationSignalDetectorPowerState
  public sealed class ConversationalAgentDetectorManager
  public sealed class DetectionConfigurationAvailabilityChangedEventArgs
  public enum DetectionConfigurationAvailabilityChangeKind
  public sealed class DetectionConfigurationAvailabilityInfo
  public enum DetectionConfigurationTrainingStatus
}
namespace Windows.ApplicationModel.DataTransfer {
  public sealed class DataPackage {
    event TypedEventHandler<DataPackage, object> ShareCanceled;
  }
}
namespace Windows.Devices.Bluetooth {
  public sealed class BluetoothAdapter {
    bool IsExtendedAdvertisingSupported { get; }
    uint MaxAdvertisementDataLength { get; }
  }
}
namespace Windows.Devices.Bluetooth.Advertisement {
  public sealed class BluetoothLEAdvertisementPublisher {
    bool IncludeTransmitPowerLevel { get; set; }
    bool IsAnonymous { get; set; }
    IReference<short> PreferredTransmitPowerLevelInDBm { get; set; }
    bool UseExtendedAdvertisement { get; set; }
  }
  public sealed class BluetoothLEAdvertisementPublisherStatusChangedEventArgs {
    IReference<short> SelectedTransmitPowerLevelInDBm { get; }
  }
  public sealed class BluetoothLEAdvertisementReceivedEventArgs {
    BluetoothAddressType BluetoothAddressType { get; }
    bool IsAnonymous { get; }
    bool IsConnectable { get; }
    bool IsDirected { get; }
    bool IsScannable { get; }
    bool IsScanResponse { get; }
    IReference<short> TransmitPowerLevelInDBm { get; }
  }
  public enum BluetoothLEAdvertisementType {
    Extended = 5,
  }
  public sealed class BluetoothLEAdvertisementWatcher {
    bool AllowExtendedAdvertisements { get; set; }
  }
  public enum BluetoothLEScanningMode {
    None = 2,
  }
}
namespace Windows.Devices.Bluetooth.Background {
  public sealed class BluetoothLEAdvertisementPublisherTriggerDetails {
    IReference<short> SelectedTransmitPowerLevelInDBm { get; }
  }
}
namespace Windows.Devices.Display {
  public sealed class DisplayMonitor {
    bool IsDolbyVisionSupportedInHdrMode { get; }
  }
}
namespace Windows.Devices.Input {
  public sealed class PenButtonListener
  public sealed class PenDockedEventArgs
  public sealed class PenDockListener
  public sealed class PenTailButtonClickedEventArgs
  public sealed class PenTailButtonDoubleClickedEventArgs
  public sealed class PenTailButtonLongPressedEventArgs
  public sealed class PenUndockedEventArgs
}
namespace Windows.Devices.Sensors {
  public sealed class Accelerometer {
    AccelerometerDataThreshold ReportThreshold { get; }
  }
  public sealed class AccelerometerDataThreshold
  public sealed class Barometer {
    BarometerDataThreshold ReportThreshold { get; }
  }
  public sealed class BarometerDataThreshold
  public sealed class Compass {
    CompassDataThreshold ReportThreshold { get; }
  }
  public sealed class CompassDataThreshold
  public sealed class Gyrometer {
    GyrometerDataThreshold ReportThreshold { get; }
  }
  public sealed class GyrometerDataThreshold
  public sealed class Inclinometer {
    InclinometerDataThreshold ReportThreshold { get; }
  }
  public sealed class InclinometerDataThreshold
  public sealed class LightSensor {
    LightSensorDataThreshold ReportThreshold { get; }
  }
  public sealed class LightSensorDataThreshold
  public sealed class Magnetometer {
    MagnetometerDataThreshold ReportThreshold { get; }
  }
  public sealed class MagnetometerDataThreshold
}
namespace Windows.Foundation.Metadata {
  public sealed class AttributeNameAttribute : Attribute
  public sealed class FastAbiAttribute : Attribute
  public sealed class NoExceptionAttribute : Attribute
}
namespace Windows.Globalization {
  public sealed class Language {
    string AbbreviatedName { get; }
    public static IVector<string> GetMuiCompatibleLanguageListFromLanguageTags(IIterable<string> languageTags);
  }
}
namespace Windows.Graphics.Capture {
  public sealed class GraphicsCaptureSession : IClosable {
    bool IsCursorCaptureEnabled { get; set; }
  }
}
namespace Windows.Graphics.DirectX {
  public enum DirectXPixelFormat {
    SamplerFeedbackMinMipOpaque = 189,
    SamplerFeedbackMipRegionUsedOpaque = 190,
  }
}
namespace Windows.Graphics.Holographic {
  public sealed class HolographicFrame {
    HolographicFrameId Id { get; }
  }
  public struct HolographicFrameId
  public sealed class HolographicFrameRenderingReport
  public sealed class HolographicFrameScanoutMonitor : IClosable
  public sealed class HolographicFrameScanoutReport
  public sealed class HolographicSpace {
    HolographicFrameScanoutMonitor CreateFrameScanoutMonitor(uint maxQueuedReports);
  }
}
namespace Windows.Management.Deployment {
  public sealed class AddPackageOptions
  public enum DeploymentOptions : uint {
    StageInPlace = (uint)4194304,
  }
  public sealed class PackageManager {
    IAsyncOperationWithProgress<DeploymentResult, DeploymentProgress> AddPackageByUriAsync(Uri packageUri, AddPackageOptions options);
    IVector<Package> FindProvisionedPackages();
    PackageStubPreference GetPackageStubPreference(string packageFamilyName);
    IAsyncOperationWithProgress<DeploymentResult, DeploymentProgress> RegisterPackageByUriAsync(Uri manifestUri, RegisterPackageOptions options);
    IAsyncOperationWithProgress<DeploymentResult, DeploymentProgress> RegisterPackagesByFullNameAsync(IIterable<string> packageFullNames, RegisterPackageOptions options);
    void SetPackageStubPreference(string packageFamilyName, PackageStubPreference useStub);
    IAsyncOperationWithProgress<DeploymentResult, DeploymentProgress> StagePackageByUriAsync(Uri packageUri, StagePackageOptions options);
  }
  public enum PackageStubPreference
  public enum PackageTypes : uint {
    All = (uint)4294967295,
  }
  public sealed class RegisterPackageOptions
  public enum RemovalOptions : uint {
    PreserveRoamableApplicationData = (uint)128,
  }
  public sealed class StagePackageOptions
  public enum StubPackageOption
}
namespace Windows.Media.Audio {
  public sealed class AudioPlaybackConnection : IClosable
  public sealed class AudioPlaybackConnectionOpenResult
  public enum AudioPlaybackConnectionOpenResultStatus
  public enum AudioPlaybackConnectionState
}
namespace Windows.Media.Capture {
  public sealed class MediaCapture : IClosable {
    MediaCaptureRelativePanelWatcher CreateRelativePanelWatcher(StreamingCaptureMode captureMode, DisplayRegion displayRegion);
  }
  public sealed class MediaCaptureInitializationSettings {
    Uri DeviceUri { get; set; }
    PasswordCredential DeviceUriPasswordCredential { get; set; }
  }
  public sealed class MediaCaptureRelativePanelWatcher : IClosable
}
namespace Windows.Media.Capture.Frames {
  public sealed class MediaFrameSourceInfo {
    Panel GetRelativePanel(DisplayRegion displayRegion);
  }
}
namespace Windows.Media.Devices {
  public sealed class PanelBasedOptimizationControl
  public sealed class VideoDeviceController : IMediaDeviceController {
    PanelBasedOptimizationControl PanelBasedOptimizationControl { get; }
  }
}
namespace Windows.Media.MediaProperties {
  public static class MediaEncodingSubtypes {
    public static string Pgs { get; }
    public static string Srt { get; }
    public static string Ssa { get; }
    public static string VobSub { get; }
  }
  public sealed class TimedMetadataEncodingProperties : IMediaEncodingProperties {
    public static TimedMetadataEncodingProperties CreatePgs();
    public static TimedMetadataEncodingProperties CreateSrt();
    public static TimedMetadataEncodingProperties CreateSsa(byte[] formatUserData);
    public static TimedMetadataEncodingProperties CreateVobSub(byte[] formatUserData);
  }
}
namespace Windows.Networking.BackgroundTransfer {
  public sealed class DownloadOperation : IBackgroundTransferOperation, IBackgroundTransferOperationPriority {
    void RemoveRequestHeader(string headerName);
    void SetRequestHeader(string headerName, string headerValue);
  }
  public sealed class UploadOperation : IBackgroundTransferOperation, IBackgroundTransferOperationPriority {
    void RemoveRequestHeader(string headerName);
    void SetRequestHeader(string headerName, string headerValue);
  }
}
namespace Windows.Networking.Connectivity {
  public enum NetworkAuthenticationType {
    Owe = 12,
  }
}
namespace Windows.Networking.NetworkOperators {
  public sealed class NetworkOperatorTetheringAccessPointConfiguration {
    TetheringWiFiBand Band { get; set; }
    bool IsBandSupported(TetheringWiFiBand band);
    IAsyncOperation<bool> IsBandSupportedAsync(TetheringWiFiBand band);
  }
  public sealed class NetworkOperatorTetheringManager {
    public static void DisableNoConnectionsTimeout();
    public static IAsyncAction DisableNoConnectionsTimeoutAsync();
    public static void EnableNoConnectionsTimeout();
    public static IAsyncAction EnableNoConnectionsTimeoutAsync();
    public static bool IsNoConnectionsTimeoutEnabled();
  }
  public enum TetheringWiFiBand
}
namespace Windows.Networking.PushNotifications {
  public static class PushNotificationChannelManager {
    public static event EventHandler<PushNotificationChannelsRevokedEventArgs> ChannelsRevoked;
  }
  public sealed class PushNotificationChannelsRevokedEventArgs
  public sealed class RawNotification {
    IBuffer ContentBytes { get; }
  }
}
namespace Windows.Security.Authentication.Web.Core {
  public sealed class WebAccountMonitor {
    event TypedEventHandler<WebAccountMonitor, WebAccountEventArgs> AccountPictureUpdated;
  }
}
namespace Windows.Security.Isolation {
  public sealed class IsolatedWindowsEnvironment
  public enum IsolatedWindowsEnvironmentActivator
  public enum IsolatedWindowsEnvironmentAllowedClipboardFormats : uint
  public enum IsolatedWindowsEnvironmentAvailablePrinters : uint
  public enum IsolatedWindowsEnvironmentClipboardCopyPasteDirections : uint
  public struct IsolatedWindowsEnvironmentContract
  public struct IsolatedWindowsEnvironmentCreateProgress
  public sealed class IsolatedWindowsEnvironmentCreateResult
  public enum IsolatedWindowsEnvironmentCreateStatus
  public sealed class IsolatedWindowsEnvironmentFile
  public static class IsolatedWindowsEnvironmentHost
  public enum IsolatedWindowsEnvironmentHostError
  public sealed class IsolatedWindowsEnvironmentLaunchFileResult
  public enum IsolatedWindowsEnvironmentLaunchFileStatus
  public sealed class IsolatedWindowsEnvironmentOptions
  public static class IsolatedWindowsEnvironmentOwnerRegistration
  public sealed class IsolatedWindowsEnvironmentOwnerRegistrationData
  public sealed class IsolatedWindowsEnvironmentOwnerRegistrationResult
  public enum IsolatedWindowsEnvironmentOwnerRegistrationStatus
  public sealed class IsolatedWindowsEnvironmentProcess
  public enum IsolatedWindowsEnvironmentProcessState
  public enum IsolatedWindowsEnvironmentProgressState
  public sealed class IsolatedWindowsEnvironmentShareFolderRequestOptions
  public sealed class IsolatedWindowsEnvironmentShareFolderResult
  public enum IsolatedWindowsEnvironmentShareFolderStatus
  public sealed class IsolatedWindowsEnvironmentStartProcessResult
  public enum IsolatedWindowsEnvironmentStartProcessStatus
  public sealed class IsolatedWindowsEnvironmentTelemetryParameters
  public static class IsolatedWindowsHostMessenger
  public delegate void MessageReceivedCallback(Guid receiverId, IVectorView<object> message);
}
namespace Windows.Storage {
  public static class KnownFolders {
    public static IAsyncOperation<StorageFolder> GetFolderAsync(KnownFolderId folderId);
    public static IAsyncOperation<KnownFoldersAccessStatus> RequestAccessAsync(KnownFolderId folderId);
    public static IAsyncOperation<KnownFoldersAccessStatus> RequestAccessForUserAsync(User user, KnownFolderId folderId);
  }
  public enum KnownFoldersAccessStatus
  public sealed class StorageFile : IInputStreamReference, IRandomAccessStreamReference, IStorageFile, IStorageFile2, IStorageFilePropertiesWithAvailability, IStorageItem, IStorageItem2, IStorageItemProperties, IStorageItemProperties2, IStorageItemPropertiesWithProvider {
    public static IAsyncOperation<StorageFile> GetFileFromPathForUserAsync(User user, string path);
  }
  public sealed class StorageFolder : IStorageFolder, IStorageFolder2, IStorageFolderQueryOperations, IStorageItem, IStorageItem2, IStorageItemProperties, IStorageItemProperties2, IStorageItemPropertiesWithProvider {
    public static IAsyncOperation<StorageFolder> GetFolderFromPathForUserAsync(User user, string path);
  }
}
namespace Windows.Storage.Provider {
  public sealed class StorageProviderFileTypeInfo
  public sealed class StorageProviderSyncRootInfo {
    IVector<StorageProviderFileTypeInfo> FallbackFileTypeInfo { get; }
  }
  public static class StorageProviderSyncRootManager {
    public static bool IsSupported();
  }
}
namespace Windows.System {
  public sealed class UserChangedEventArgs {
    IVectorView<UserWatcherUpdateKind> ChangedPropertyKinds { get; }
  }
  public enum UserWatcherUpdateKind
}
namespace Windows.UI.Composition.Interactions {
  public sealed class InteractionTracker : CompositionObject {
    int TryUpdatePosition(Vector3 value, InteractionTrackerClampingOption option, InteractionTrackerPositionUpdateOption posUpdateOption);
  }
  public enum InteractionTrackerPositionUpdateOption
}
namespace Windows.UI.Input {
  public sealed class CrossSlidingEventArgs {
    uint ContactCount { get; }
  }
  public sealed class DraggingEventArgs {
    uint ContactCount { get; }
  }
  public sealed class GestureRecognizer {
    uint HoldMaxContactCount { get; set; }
    uint HoldMinContactCount { get; set; }
    float HoldRadius { get; set; }
    TimeSpan HoldStartDelay { get; set; }
    uint TapMaxContactCount { get; set; }
    uint TapMinContactCount { get; set; }
    uint TranslationMaxContactCount { get; set; }
    uint TranslationMinContactCount { get; set; }
  }
  public sealed class HoldingEventArgs {
    uint ContactCount { get; }
    uint CurrentContactCount { get; }
  }
  public sealed class ManipulationCompletedEventArgs {
    uint ContactCount { get; }
    uint CurrentContactCount { get; }
  }
  public sealed class ManipulationInertiaStartingEventArgs {
    uint ContactCount { get; }
  }
  public sealed class ManipulationStartedEventArgs {
    uint ContactCount { get; }
  }
  public sealed class ManipulationUpdatedEventArgs {
    uint ContactCount { get; }
    uint CurrentContactCount { get; }
  }
  public sealed class RightTappedEventArgs {
    uint ContactCount { get; }
  }
  public sealed class SystemButtonEventController : AttachableInputObject
  public sealed class SystemFunctionButtonEventArgs
  public sealed class SystemFunctionLockChangedEventArgs
  public sealed class SystemFunctionLockIndicatorChangedEventArgs
  public sealed class TappedEventArgs {
    uint ContactCount { get; }
  }
}
namespace Windows.UI.Input.Inking {
  public sealed class InkModelerAttributes {
    bool UseVelocityBasedPressure { get; set; }
  }
}
namespace Windows.UI.Text {
  public enum RichEditMathMode
  public sealed class RichEditTextDocument : ITextDocument {
    void GetMath(out string value);
    void SetMath(string value);
    void SetMathMode(RichEditMathMode mode);
  }
}
namespace Windows.UI.ViewManagement {
  public sealed class UISettings {
    event TypedEventHandler<UISettings, UISettingsAnimationsEnabledChangedEventArgs> AnimationsEnabledChanged;
    event TypedEventHandler<UISettings, UISettingsMessageDurationChangedEventArgs> MessageDurationChanged;
  }
  public sealed class UISettingsAnimationsEnabledChangedEventArgs
  public sealed class UISettingsMessageDurationChangedEventArgs
}
namespace Windows.UI.ViewManagement.Core {
  public sealed class CoreInputView {
    event TypedEventHandler<CoreInputView, CoreInputViewHidingEventArgs> PrimaryViewHiding;
    event TypedEventHandler<CoreInputView, CoreInputViewShowingEventArgs> PrimaryViewShowing;
  }
  public sealed class CoreInputViewHidingEventArgs
  public enum CoreInputViewKind {
    Symbols = 4,
  }
  public sealed class CoreInputViewShowingEventArgs
  public sealed class UISettingsController
}

The post Windows 10 SDK Preview Build 19035 available now! appeared first on Windows Developer Blog.


Now available: Azure DevOps Server 2019 Update 1.1 RTW

$
0
0

Today, we are releasing Azure DevOps Server 2019 Update 1.1 RTW. Azure DevOps Server offers all the services of Azure DevOps, including Pipelines, Boards, Repos, Artifacts and Test Plans, as a self-hosted product that can be installed in your on-premises datacenter or in a virtual machine on the cloud.

Azure DevOps Server 2019 Update 1.1 includes bug fixes for Azure DevOps Server 2019 Update 1. You can find the details of the fixes in our release notes.

You can upgrade to Azure DevOps Server 2019 Update 1.1 from previous versions of Azure DevOps Server 2019 or Team Foundation Server 2012 or later. You can also install Azure DevOps Server 2019 Update 1.1 without first installing Azure DevOps Server 2019.

Here are some key links:

Updating an ASP.NET Core 2.2 Web Site to .NET Core 3.1 LTS

$
0
0

Now that .NET Core 3.1 is out jus this last week and it is a "LTS" or Long Term Support version, I thought it'd be a good time to update my main site and my podcast to .NET 3.1. You can read about what LTS means but quite simply it's that "LTS releases are supported for three years after the initial release."

I'm not sure about you, but for me, when I don't look at some code for a few months - in this case because it's working just fine - it takes some time for the context switch back in. For my podcast site and main site I honestly have forgotten what version of .NET they are running on.

Updating my site to .NET Core 3.1

First, it seems my main homepage is NET Core 2.2. I can tell because the csproj has a "TargetFramework" of netcoreapp2.2. So I'll start at the migration docs here to go from 2.2 to 3.0. .NET Core 2.2 reaches "end of life" (support) this month so it's a good time to update to the 3.1 version that will be supported for 3 years.

Here's my original csproj

<Project Sdk="Microsoft.NET.Sdk.Web">
  <PropertyGroup>
    <TargetFramework>netcoreapp2.2</TargetFramework>
    <AspNetCoreHostingModel>InProcess</AspNetCoreHostingModel>
    <RootNamespace>hanselman_core</RootNamespace>
  </PropertyGroup>
  <ItemGroup>
    <PackageReference Include="Microsoft.AspNetCore.App" />
    <PackageReference Include="Microsoft.AspNetCore.Razor.Design" Version="2.2.0" PrivateAssets="All" />
    <PackageReference Include="Microsoft.VisualStudio.Web.CodeGeneration.Design" Version="2.2.3" />
  </ItemGroup>
  <ItemGroup>
    <None Update="IISUrlRewrite.xml">
      <CopyToOutputDirectory>PreserveNewest</CopyToOutputDirectory>
    </None>
  </ItemGroup>
</Project>

and my 3.0 updated csproj. You'll note that most of it is deletions. Also note that I have a custom IISUrlRewrite.xml that I want to make sure gets to a specific place. You'll likely not have anything like this, but be aware.

<Project Sdk="Microsoft.NET.Sdk.Web">
  <PropertyGroup>
    <TargetFramework>netcoreapp3.1</TargetFramework>
    <RootNamespace>hanselman_core</RootNamespace>
  </PropertyGroup>
  <ItemGroup>
    <None Update="IISUrlRewrite.xml">
      <CopyToOutputDirectory>PreserveNewest</CopyToOutputDirectory>
    </None>
  </ItemGroup>
</Project>

Some folks are more little methodical about this, upgrading first to 3.0 and then to 3.1. You can feel free to jump all the way if you want. In this case the main breaking changes are from 2.x to 3.x so I'll upgrade the whole thing all in one step.

I compile and run and get an error "InvalidOperationException: Endpoint Routing does not support 'IApplicationBuilder.UseMvc(...)'. To use 'IApplicationBuilder.UseMvc' set 'MvcOptions.EnableEndpointRouting = false' inside 'ConfigureServices(...)." so I'll keep moving through the migration guide, as things change in major versions.

Per the docs, I can remove using Microsoft.AspNetCore.Mvc; and add using Microsoft.Extensions.Hosting; as IHostingEnvironment becomes IWebHostEnvironment. Since my app is a Razor Pages app I'll add a call to servicesAddRazorPages(); as well as calls to UseRouting, UseAuthorization (if needed) and most importantly, moving to endpoint routing like this in my Configure() call.

app.UseRouting();
app.UseEndpoints(endpoints =>

{
endpoints.MapRazorPages();
});

I also decide that I wanted to see what version I was running on, on the page, so I'd be able to better remember it. I added this call in my _layout.cshtml to output the version of .NET Core I'm using at runtime.

 <div class="copyright">&copy; Copyright @DateTime.Now.Year, Powered by @System.Runtime.InteropServices.RuntimeInformation.FrameworkDescription</div> 

In order versions of .NET, you couldn't get exactly what you wanted from RuntimeInformation.FrameworkDescription, but it works fine in 3.x so it's perfect for my needs.

Finally, I notice that I was using my 15 year old IIS Rewrite Rules (because they work great) but I was configuring them like this:

using (StreamReader iisUrlRewriteStreamReader 
                = File.OpenText(Path.Combine(env.ContentRootPath, "IISUrlRewrite.xml")))

{ var options = new RewriteOptions() .AddIISUrlRewrite(iisUrlRewriteStreamReader); app.UseRewriter(options); }

And that smells weird to me. Turns out there's an overload on AddIISUrlRewrite that might be better. I don't want to be manually opening up a text file and streaming it like that, so I'll use an IFileProvider instead. This is a lot cleaner and I can remove a using System.IO;

var options = new RewriteOptions()
    .AddIISUrlRewrite(env.ContentRootFileProvider, "IISUrlRewrite.xml");

app.UseRewriter(options);

I also did a little "Remove and Sort Usings" refactoring and tidied up both Program.cs and Startup.cs to the minimum and here's my final complete Startup.cs.

using Microsoft.AspNetCore.Builder;
using Microsoft.AspNetCore.Hosting;
using Microsoft.AspNetCore.Rewrite;
using Microsoft.Extensions.Configuration;
using Microsoft.Extensions.DependencyInjection;
using Microsoft.Extensions.Hosting;
namespace hanselman_core
{
    public class Startup
    {
        public Startup(IConfiguration configuration)
        {
            Configuration = configuration;
        }
        public IConfiguration Configuration { get; }
        // This method gets called by the runtime. Use this method to add services to the container.
        public void ConfigureServices(IServiceCollection services)
        {
            services.AddHealthChecks();
            services.AddRazorPages().AddRazorPagesOptions(options =>
            {
                options.Conventions.AddPageRoute("/robotstxt", "/Robots.Txt");
            });
            services.AddMemoryCache();
        }
        // This method gets called by the runtime. Use this method to configure the HTTP request pipeline.
        public void Configure(IApplicationBuilder app, IWebHostEnvironment env)
        {
            if (env.IsDevelopment())
            {
                app.UseDeveloperExceptionPage();
            }
            else
            {
                app.UseExceptionHandler("/Error");
                app.UseHsts();
            }
            app.UseHealthChecks("/healthcheck");
            var options = new RewriteOptions()
                .AddIISUrlRewrite(env.ContentRootFileProvider, "IISUrlRewrite.xml");
            app.UseRewriter(options);
            app.UseHttpsRedirection();
            app.UseDefaultFiles();
            app.UseStaticFiles();
            app.UseRouting();
            app.UseEndpoints(endpoints =>

{
endpoints.MapRazorPages();
}); } } }

And that's it. Followed the migration, changed a few methods and interfaces, and ended up removing a half dozen lines of code and in fact ended up with a simpler system. Here's the modified files for my update:

❯ git status

On branch main
Your branch is up to date with 'origin/main'.

Changes not staged for commit:
(use "git add <file>..." to update what will be committed)
(use "git restore <file>..." to discard changes in working directory)
modified: Pages/Index.cshtml.cs
modified: Pages/Shared/_Layout.cshtml
modified: Program.cs
modified: Startup.cs
modified: hanselman-core.csproj

Updating the Web Site in Azure App Service and Azure DevOps

That all works locally, so I'll check in in and double check my Azure App Service Plan and Azure DevOps Pipeline to make sure that the staging - and then production - sites are updated.

ASP.NET Core apps can rely on a runtime that is already installed in the Azure App Service or one can do a "self contained" install. My web site needs .NET Core 3.1 (LTS) so ideally I'd change this dropdown in General Settings to get LTS and get 3.1. However, this only works if the latest stuff is installed on Azure App Service. At some point soon in the future .NET Core 3.1 will be on Azure App Service for Linux but it might be a week or so. At the time of this writing LTS is still 2.2.7 so I'll do a self-contained install which will take up more disk space but will be more reliable for my needs and will allow me full controll over versions.

Updating to .NET Core 3.1 LTS

I am running this on Azure App Service for Linux so it's running in a container. It didn't startup so I checked the logs at startup via the Log Stream and it says that the app isn't listening on Port 8080 - or at least it didn't answer an HTTP GET ping.

App Service Log

I wonder why? Well, I scrolled up higher in the logs and noted this error:

2019-12-10T18:21:25.138713683Z The specified framework 'Microsoft.AspNetCore.App', version '3.0.0' was not found.

Oops! Did I make sure that my csproj was 3.1? Turns out I put in netcoreapp3.0 even though I was thinking 3.1! I updated and redeployed.

It's important to make sure that your SDK - the thing that builds - lines up with the the runtime version. I have an Azure DevOps pipeline that is doing the building so I added a "use .NET Core SDK" task that asked for 3.1.100 explicitly.

Using .NET Core 3.1 SDK

Again, I need to make sure that my Pipeline includes that self-contained publish with a -r linux-x64 parameter indicating this is the runtime needed for a self-contained install.

dotnet publish -r linux-x64

Now my CI/CD pipeline is building for 3.1 and I've set my App Service to run on 3.1 by shipping 3.1 with my publish artifact. When .NET Core 3.1 LTS is released on App Service I can remove this extra argument and rely on the Azure App Service to manage the runtime.

powered by .NET Core 3.1

All in all, this took about an hour and a half. Figure a day for your larger apps. Now I'll spend another hour (likely less) to update my podcast site.


Sponsor: Like C#? We do too! That’s why we've developed a fast, smart, cross-platform .NET IDE which gives you even more coding power. Clever code analysis, rich code completion, instant search and navigation, an advanced debugger... With JetBrains Rider, everything you need is at your fingertips. Code C# at the speed of thought on Linux, Mac, or Windows. Try JetBrains Rider today!


© 2019 Scott Hanselman. All rights reserved.
     

.NET Framework December 2019 Security and Quality Rollup

$
0
0

Today, we are releasing the December 2019 Security and Quality Rollup Updates for .NET Framework.

Quality and Reliability

This release contains the following quality and reliability improvements.

ASP.NET

  • ASP.NET will now emit a SameSite cookie header when HttpCookie.SameSite value is “None” to accommodate upcoming changes to SameSite cookie handling in Chrome. As part of this change, FormsAuth and SessionState cookies will also be issued with SameSite = ‘Lax’ instead of the previous default of ‘None’, though these values can be overridden in web.config. For more information, refer to Work with SameSite cookies in ASP.NET.

CLR1

  • Addresses and issue where some ClickOnce applications or applications creating the default AppDomain with a restricted permission set may observe application launch or application runtime failures, or unexpected behaviors. The observable issue was the System.AppDomainSetup.TargetFrameworkName is null, leading to any quirks enabling reverting back to .NET Framework 4.0 behaviors.

WPF2

  • Addresses an issue where some Per-Monitor Aware WPF applications that host System-Aware or Unaware child-windows, and run on .NET 4.8, may occasionally encounter a crash with exceptionSystem.Collections.Generic.KeyNotFoundException.

1 Common Language Runtime (CLR)
2 Windows Presentation Foundation (WPF)

Getting the Update

The Security and Quality Rollup is available via Windows Update, Windows Server Update Services, and Microsoft Update Catalog.

Microsoft Update Catalog

You can get the update via the Microsoft Update Catalog. For Windows 10, NET Framework 4.8 updates are available via Windows Update, Windows Server Update Services, Microsoft Update Catalog. Updates for other versions of .NET Framework are part of the Windows 10 Monthly Cumulative Update.

Note: Customers that rely on Windows Update and Windows Server Update Services will automatically receive the .NET Framework version-specific updates. Advanced system administrators can also take use of the below direct Microsoft Update Catalog download links to .NET Framework-specific updates. Before applying these updates, please ensure that you carefully review the .NET Framework version applicability, to ensure that you only install updates on systems where they apply.

The following table is for Windows 10 and Windows Server 2016+ versions.

Product Version Cumulative Update
Windows 10 1909 and Windows Server, version 1909
.NET Framework 3.5, 4.8 Catalog 4533002
Windows 10 1903 and Windows Server, version 1903
.NET Framework 3.5, 4.8 Catalog 4533002
Windows 10 1809 (October 2018 Update) and Windows Server 2019 4533094
.NET Framework 3.5, 4.7.2 Catalog 4533013
.NET Framework 3.5, 4.8 Catalog 4533001
Windows 10 1803 (April 2018 Update)
.NET Framework 3.5, 4.7.2 Catalog 4530717
.NET Framework 3.5, 4.8 Catalog 4533000
Windows 10 1709 (Fall Creators Update)
.NET Framework 3.5, 4.7.1, 4.7.2 Catalog 4530714
.NET Framework 3.5, 4.8 Catalog 4532999
Windows 10 1703 (Creators Update)
.NET Framework 3.5, 4.7, 4.7.1, 4.7.2 Catalog 4530711
.NET Framework 3.5, 4.8 Catalog 4532998
Windows 10 1607 (Anniversary Update) and Windows Server 2016
.NET Framework 3.5, 4.6.2, 4.7, 4.7.1, 4.7.2 Catalog 4530689
.NET Framework 3.5, 4.8 Catalog 4532997

The following table is for earlier Windows and Windows Server versions.

Product Version Security and Quality Rollup
Windows 8.1, Windows RT 8.1 and Windows Server 2012 R2 4533097
.NET Framework 3.5 Catalog 4514371
.NET Framework 4.5.2 Catalog 4514367
.NET Framework 4.6, 4.6.1, 4.6.2, 4.7, 4.7.1, 4.7.2 Catalog 4533011
.NET Framework 4.8 Catalog 4533004
Windows Server 2012 4533096
.NET Framework 3.5 Catalog 4514370
.NET Framework 4.5.2 Catalog 4514368
.NET Framework 4.6, 4.6.1, 4.6.2, 4.7, 4.7.1, 4.7.2 Catalog 4533010
.NET Framework 4.8 Catalog 4533003
Windows 7 SP1 and Windows Server 2008 R2 SP1 4533095
.NET Framework 3.5.1 Catalog 4507004
.NET Framework 4.5.2 Catalog 4507001
.NET Framework 4.6, 4.6.1, 4.6.2, 4.7, 4.7.1, 4.7.2 Catalog 4533012
.NET Framework 4.8 Catalog 4533005
Windows Server 2008 4533098
.NET Framework 2.0, 3.0 Catalog 4507003
.NET Framework 4.5.2 Catalog 4507001
.NET Framework 4.6 Catalog 4533012

Previous Monthly Rollups

The last few .NET Framework Monthly updates are listed below for your convenience:
* November 2019 Preview of Quality Rollup
* October 2019 Preview of Quality Rollup
* October 2019 Security and Quality Rollup

The post .NET Framework December 2019 Security and Quality Rollup appeared first on .NET Blog.

Azure Sphere guardian module simplifies & secures brownfield IoT

$
0
0

One of the toughest IoT quandaries is figuring out how to bake IoT into existing hardware in a secure, cost-effective way. For many customers, scrapping existing hardware investments for new IoT-enabled devices (“greenfield” installations) isn’t feasible. And retrofitting mission-critical devices that are already in service with IoT (“brownfield” installations) is often deemed too risky, too complicated, and too expensive.

This is why we’re thrilled about a major advancement for Azure Sphere that opens up the brownfield opportunity, helping make IoT retrofits more secure, substantially easier, and more cost effective than ever before. The guardian module with Azure Sphere simplifies the transformation of brownfield devices into locked-down, internet-connected, data-wielding, intelligent devices that can transform business.

For an in-depth exploration of the guardian module and how it’s being used at major corporations like Starbucks, sign up for the upcoming Azure Sphere Guardian Module webinar.

An image of Rodney Clark, VP of IoT and mixed reality sales.

The guardian module with Azure Sphere offers some key advantages

Like all Microsoft products, Azure Sphere is loaded with robust security features at every turn—from silicon to cloud. For brownfield installations, the guardian module with Azure Sphere physically plugs into existing equipment ports without the need for any hardware redesign.

Azure Sphere, rather than the device itself, talks to the cloud. The guardian module processes data and controls the device without exposing existing equipment to the potential dangers of the internet. The module shields brownfield equipment from attack by restricting the flow of data to only trusted cloud and device communication partners while also protecting module and equipment software.

Using the Azure Sphere guardian module, enterprises can enable any number of secure operations between the device and the cloud. The device can even use the Azure Sphere Security Service for certificate-based authentication, failure reporting, and software updates.

Opportunities abound for the Microsoft partner ecosystem

Given the massive scale of connectable equipment already in use in retail, industrial, and commercial settings, the new guardian module presents a lucrative opportunity for Microsoft partners. Azure Sphere can connect an enormous range of devices of all types, leading the way for a multitude of practical applications that can pay off through increased productivity, predictive maintenance, cost savings, new revenue opportunities, and more.

Fulfilling demand for such a diverse set of use cases is only possible thanks to Azure Sphere’s expanding partner ecosystem. Recent examples of this growth include our partnership with NXP to deliver a new Azure Sphere-certified chip that is an extension of their i.MX 8 high-performance applications process series and brings greater compute capabilities to support advanced workloads. As well as our collaboration with Qualcomm Technologies, Inc to deliver the first cellular-enabled Azure Sphere chip, which gives our customers the ability to securely connect anytime, anywhere.

Starbucks uses Azure Sphere guardian module to connect coffee machines

If you saw Satya Nadella’s Vision Keynote at Build 2019, you probably recall the demonstration of Starbucks’ IoT-connected coffee machines. But what you may not know is the Azure Sphere guardian module is behind the scenes, enabling Starbucks to connect these existing machines to the cloud.

As customers wait for their double-shot, no-whip mochas to brew, these IoT-enabled machines are doing more than meets the eye. They’re collecting more than a dozen data points for each precious shot, like the types of beans used, water temperature, and water quality. The solution enables Starbucks to proactively identify any issues with their machines in order to smooth their customers’ paths to caffeinated bliss.

Beyond predictive maintenance, Azure Sphere will enable Starbucks to transmit new recipes directly to machines in 30,000 stores rather than manually uploading recipes via thumb drives, saving Starbucks lots of time, money, and thumb drives. Watch this Microsoft Ignite session to see how Starbucks is tackling IoT at scale in pursuit of the perfect pour.

As an ecosystem, we have a tremendous opportunity to meet demand for brownfield installations and help our customers quickly bring their existing investments online without taking on risk and jeopardizing mission-critical equipment. The first guardian modules are available today from Avnet and AI-Link, with more expected soon.

Discover the value of adding secured connectivity to existing mission-critical equipment by registering for our upcoming Azure Sphere Guardian Modules webinar. You will experience a guided tour of the guardian module, including a deep dive into its architecture and the opportunity this open-source offering presents to our partner community. We’ll also hear from Starbucks around what they’ve learned since implementing the guardian module with Azure Sphere.

Combine the Power of Video Indexer and Computer Vision

$
0
0

We are pleased to introduce the ability to export high-resolution keyframes from Azure Media Service’s Video Indexer. Whereas keyframes were previously exported in reduced resolution compared to the source video, high resolution keyframes extraction gives you original quality images and allows you to make use of the image-based artificial intelligence models provided by the Microsoft Computer Vision and Custom Vision services to gain even more insights from your video. This unlocks a wealth of pre-trained and custom model capabilities. You can use the keyframes extracted from Video Indexer, for example, to identify logos for monetization and brand safety needs, to add scene description for accessibility needs or to accurately identify very specific objects relevant for your organization, like identifying a type of car or a place.

Let’s look at some of the use cases we can enable with this new introduction.

Using keyframes to get image description automatically

You can automate the process of “captioning” different visual shots of your video through the image description model within Computer Vision, in order to make the content more accessible to people with visual impairments. This model provides multiple description suggestions along with confidence values for an image. You can take the descriptions of each high-resolution keyframe and stitch them together to create an audio description track for your video.

Image description within Computer Vision

Using Keyframes to get logo detection

While Video Indexer detects brands in speech and visual text, it does not support brands detection from logos yet. Instead, you can run your keyframes through Computer Vision’s logo-based brands detection model to detect instances of logos in your content.

This can also help you with brand safety as you now know and can control the brands showing up in your content. For example, you might not want to showcase the logo of a company directly competing with yours. Also, you can now monetize on the brands showing up in your content through sponsorship agreements or contextual ads.

Furthermore, you can cross-reference the results of this model for you keyframe with the timestamp of your keyframe to determine when exactly a logo is shown in your video and for how long. For example, if you have a sponsorship agreement with a content creator to show your logo for a certain period of time in their video, this can help determine if the terms of the agreement have been upheld.

Computer Vision’s logo detection model can detect and recognize thousands of different brands out of the box. However, if you are working with logos that are specific to your use case or otherwise might not be a part of the out of the box logos database, you can also use Custom Vision to build a custom object detector and essentially train your own database of logos by uploading and correctly labeling instances of the logos relevant to you.

Computer Vision's logo detector, detecting the Microsoft logo.

Using keyframes with other Computer Vision and Custom Vision offerings

The Computer Vision APIs provide different insights in addition to image description and logo detection, such as object detection, image categorization, and more. The possibilities are endless when you use high-resolution keyframes in conjunction with these offerings.

For example, the object detection model in Computer Vision gives bounding boxes for common out of the box objects that are already detected as part of Video Indexer today. You can use these bounding boxes to blur out certain objects that don’t meet your standards.

Object detection model

High-resolution keyframes in conjunction with Custom Vision can be leveraged to achieve many different custom use cases. For example, you can train a model to determine what type of car (or even what breed of cat) is showing in a shot. Maybe you want to identify the location or the set where a scene was filmed for editing purposes. If you have objects of interest that may be unique to your use case, use Custom Vision to build a custom classifier to tag visuals or a custom object detector to tag and provide bounding boxes for visual objects.

Try it for yourself

These are just a few of the new opportunities enabled by the availability of high-resolution keyframes in Video Indexer. Now, it is up to you to get additional insights from your video by taking the keyframes from Video Indexer and running additional image processing using any of the Vision models we have just discussed. You can start doing this by first uploading your video to Video Indexer and taking the high-resolution keyframes after the indexing job is complete and second creating an account and getting started with the Computer Vision API and Custom Vision.

Have questions or feedback? We would love to hear from you. Use our UserVoice page to help us prioritize features, leave a comment below or email VISupport@Microsoft.com for any questions.

Viewing all 5971 articles
Browse latest View live


<script src="https://jsc.adskeeper.com/r/s/rssing.com.1596347.js" async> </script>