Quantcast
Channel: Category Name
Viewing all 5971 articles
Browse latest View live

CMake, Linux targeting, and IntelliSense improvements in Visual Studio 2019 version 16.5 Preview 2

$
0
0

Visual Studio’s native support for CMake allows you to target both Windows and Linux from the comfort of a single IDE. Visual Studio 2019 version 16.5 Preview 2 introduces several new features specific to cross-platform development, including:

File copy optimizations for CMake projects targeting a remote Linux system

Visual Studio automatically copies source files from your local Windows machine to your remote Linux system when building and debugging on Linux. In Visual Studio 2019 version 16.5 this behavior has been optimized. Visual Studio now keeps a “fingerprint file” of the last set of sources copied remotely and optimizes behavior based on the number of files that have changed.

  1. If no changes are identified, then no copy occurs.
  2. If only a few files have changed, then sftp is used to copy the files individually.
  3. If only a few directories have changed, then a non-recursive rsync command is issued to copy those directories.
  4. Otherwise, a rsync recursive copy is called from the first common parent directory of the changed files.

These improvements were tested against LLVM. A trivial change was made to a source file, which causes the remote source file copy to be called and the executable to be rebuilt when the user starts debugging.

Debugging LLVM-objdump with no optimizations Debugging LLVM-objdump with 16.5 optimizations 
Time elapsed for remote source file copy 3 minutes and 24 seconds 2 seconds

With no optimizations, a full recursive rsync copy is executed from the CMake root. With these optimizations, Visual Studio detects that a single file has changed and uses sftp to re-copy only the file that has changed.

These optimizations are enabled by default. The following new options can be added to CMakeSettings.json to customize file copy behavior.

“remoteCopyOptimizations” : {

“remoteCopyUseOptmizations”: “RsyncAndSftp”

“rsyncSingleDirectoryCommandArgs”: “-t”

}

Possible values for remoteCopyOptimizations are RsyncAndSftp (default), RsyncOnly, and None (where a full recursive rsync copy is always executed from the CMake root). rsyncSingleDirectoryCommandArgs can be passed to customize rsync behavior when a non-recursive rsync command is issued (step 3 above). The existing properties remoteCopySources, rsyncCommandArgs (which are passed when a recursive rsync command is issued, step 4 above) and rsyncCopySourcesMethod can also be used to customize file copy behavior. Please see Additional settings for CMake Linux projects for more information.

Note that these performance improvements are specific to remote connections. Visual Studio’s native support for WSL can access files stored in the Windows filesystem, which eliminates the need to copy and maintain sources on a remote machine.

Native WSL support with the separation of build and deploy

Visual Studio 2019 version 16.1 introduced the ability to separate your remote build system from your remote deploy system. In Visual Studio 2019 version 16.5 this functionality has been extended to include our native support for WSL. Now, you can build natively on WSL and deploy/debug on a second remote Linux system connected over SSH.

Separation of build and deploy with CMake projects

The Linux system specified in the CMake Settings Editor is used for build. To build natively on WSL, navigate to the CMake Settings Editor (Configuration drop-down > Manage Configurations…) and add a new WSL configuration. You can select either WSL-GCC-Debug or WSL-Clang-Debug depending on which toolset you would like to use.

The remote Linux system specified in launch.vs.json is used for debugging. To debug on a second remote Linux system, add a new remote Linux configuration to launch.vs.json (right-click on the root CMakeLists.txt in the Solution Explorer > Debug and Launch Settings) and select C/C++ Attach for Linux (gdb). Please see launch.vs.json reference for remote Linux projects to learn more about customizing this configuration and properties specific to the separation of build and deploy.

Note that the C/C++ Attach for Linux (gdb) configuration is for debugging on remote Linux systems. If you want to build and debug on the same instance of WSL, add a C/C++ Launch for WSL configuration to launch.vs.json. More information on the entry points to launch.vs.json can be found here.

Separation of build and deploy with MSBuild-based Linux projects

The Linux system specified in the Linux Property Pages is used for build. To build natively on WSL, navigate to Configuration Properties > General and set the Platform Toolset. You can select either GCC for Windows Subsystem for Linux or Clang for Windows Subsystem for Linux depending on which toolset you would like to use. Click “Apply.”

By default, Visual Studio builds and debugs in WSL. To specify a second remote system for debugging, navigate to Configuration Properties > Debugging and set Remote Debug Machine to one of the specified remote connections. You can add a new remote connection via the Connection Manager. You can also specify a path to the directory on the remote system for the project to deploy to via Remote Deploy Directory.

Easily add, remove, and rename files in CMake projects

It’s easier than ever to work with CMake projects in Visual Studio. In the latest preview, you can add, remove, and rename source files and targets in your CMake projects from the IDE without manually editing your CMake scripts. When you add or remove files with the Solution Explorer, Visual Studio will automatically edit your CMake project. You can also add, remove, and rename the project’s targets from the Solution Explorer’s targets view.

You can now easily add, remove, and rename files in CMake projects in Visual Studio

In some cases, there may be more than one place where it makes sense to add a source file to a CMake script. When this happens, Visual Studio will ask you where you want to make the change and display a preview of the proposed modifications:

Visual Studio will prompt you to resolve ambiguity when adding a new file to your CMake project

This feature is enabled by default as of Visual Studio 2019 15.5 Preview 2, but it can be turned off in Tools > Options > CMake, “Enable automatic CMake script modification…”

CMake language services

The latest Visual Studio preview also makes it easy to make sense of complex CMake projects. Code navigation features such as Go To Definition and Find All References are now supported for variables, functions, and targets in CMake script files.
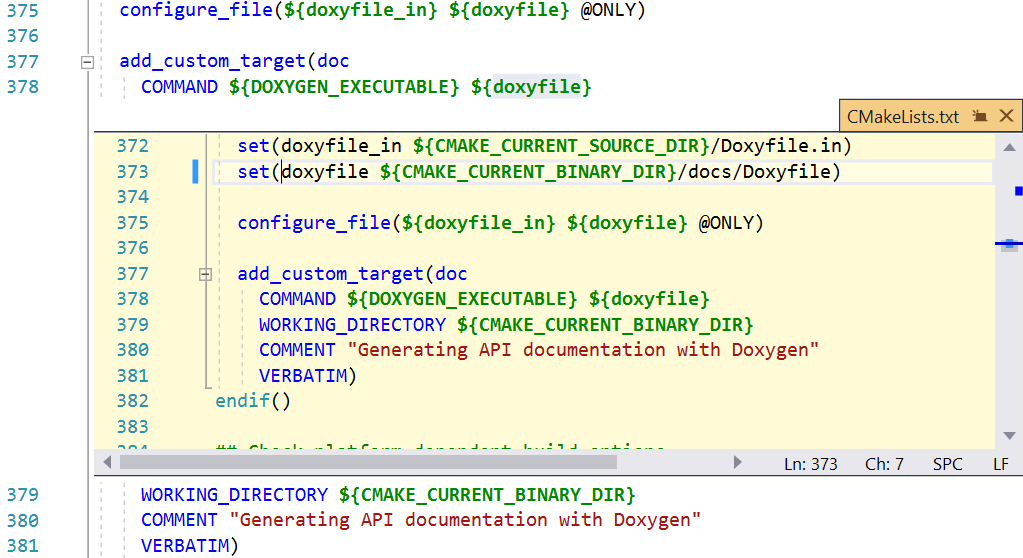
CMake language services, including Peek Definition, in CMakeLists.txt

These navigation features work across your entire CMake project to offer more productivity than naïve text search across files and folders, and are integrated with other IDE productivity features such as Peek Definition. Stay tuned for more information on both CMake features in standalone blog posts coming soon.

Command line utility to interact with the Connection Manager

In Visual Studio 2019 version 16.5 or later you can use a command line utility to programmatically add and remove remote connections from the connection store. This is useful for tasks such as provisioning a new development machine or setting up Visual Studio in continuous integration. Full documentation on the utility including usage, commands, and options can be found here.

FIPS 140-2 compliance for remote C++ development

Federal Information Processing Standard (FIPS) Publication 140-2 is a U.S. government standard for cryptographic models. Implementations of the standard are validated by NIST. Starting with Visual Studio version 16.5 remote Linux development with C++ is FIPS 140-2 compliant. You can follow our step-by-step instructions to set up a secure, FIPS-compliant connection between Visual Studio and your remote Linux system.

IntelliSense improvements 

IntelliSense now displays more readable type names when dealing with the Standard Library. For example, in the Quick Info tooltip std::_vector_iterator<int> becomes_std::vector<int>::iterator.

We’ve also added the ability to toggle whether Enter, Space, and Tab function as commit characters, and to toggle whether Tab is used to Insert Snippet. Whether using a CMake or MSBuild project, you can find these settings under Tools > Options > Text Editor > C/C++ > Advanced > IntelliSense.

New Tools > Options > Text Editor > C/C++ > Advanced > IntelliSense settings in Visual Studio

Give us your feedback

Download Visual Studio 2019 version 16.5 Preview 2 today and give it a try. We’d love to hear from you to help us prioritize and build the right features for you. We can be reached via the comments below, Developer Community, email (visualcpp@microsoft.com), and Twitter (@VisualC). The best way to file a bug or suggest a feature is via Developer Community.

The post CMake, Linux targeting, and IntelliSense improvements in Visual Studio 2019 version 16.5 Preview 2 appeared first on C++ Team Blog.


Fueling intelligent energy with IoT

$
0
0

At Microsoft, building a future that we can all thrive in is at the center of everything we do. On January 16, as part of the announcement that Microsoft will be carbon negative by 2030, we discussed how advances in human prosperity, as measured by GDP growth, are inextricably tied to the use of energy. Microsoft has committed to deploy $1 billion into a new climate innovation fund to accelerate the development of carbon reduction and removal technologies that will help us and the world become carbon negative. The Azure IoT team continues to invest in the platforms and tools that enable solution builders to deliver new energy solutions, customers to empower their workforce, optimize digital operations and build smart, connected, cities, vehicles, and buildings.

Earlier, Microsoft committed $50 Million through Microsoft AI for Earth that provides technology, resources, and expertise into the hands of those working to solve our most complex global environmental challenges. Challenges like helping customers around the world meet their energy and sustainability commitments. Our partnership with Vattenfall illustrates how we will power new Swedish datacenter locations with renewable energy and our partnership with E.ON who manages low-voltage distribution grids is challenging the limits of traditional technology for low-voltage distribution grids through an inhouse IoT platform based on Microsoft Azure IoT Hub.

Over the past few years, our engineers have had the pleasure to connect with and learn from a large ecosystem of energy solution builders and customers that are proactively shifting their consumption priorities. Transmission system operators (TSOs) are focused on transforming grid operations while distribution system operators (DSOs) and utilities are approaching their customers with new solutions, and all participants are requesting better, more accurate, more secure data.

As millions of new electric vehicles are entering our roads, new challenges arise around the transformation of the energy grid that moves us in our daily commutes. At the heart of these transformations are solutions that help energy providers get connected, stay connected, and transform their businesses through devices, insights, and actions.

Late 2019, we announced updates to Azure IoT Central to help solution builders move beyond proof of concept to building business-critical applications they can brand and sell directly or through Microsoft AppSource. Builders can brand, customize, and make their own apps using extensibility via APIs, data connectors to business applications, repeatability, and manageability of their investment through multitenancy and seamless device connectivity. Two IoT Central energy app templates for solar panel and smart meter monitoring already help energy solution builders accelerate development.

IoT Central Energy Solutions

Azure IoT Central Energy App Templates.

DistribuTECH 2020

DistribuTECH International is the leading annual transmission and distribution event that addresses technologies used to move electricity from the power plant through the transmission and distribution systems to the meter and inside the home. Held January 28 to January 30 in San Antonio, Texas, we invited 8 leading Energy solution builders to join us at DistribuTECH to demonstrate how they have leveraged Azure IoT to deliver amazing innovation. These partners will join Azure IoT Experts who are available to discuss your business scenarios or get more specific on IoT devices, working with IoT data and delivering a secure solution from the edge to the cloud.

Partners fueling intelligent energy

NXP EdgeVerse™ platform: intelligently manage grid load securely at the edge

The shift to vehicle electrification requires a completely different fueling infrastructure than gas-powered vehicles. Drivers of electric vehicles need to trust they can fuel for every occasion—everywhere, anytime and not get stranded. Every electric utility vehicle in a managed fleet, for example, must be authorized to charge without overloading the grid during peak times.

To manage grid load intelligently, edge computing and security becomes vital. NXP and Microsoft have demonstrated “Demand Side Management” of a smart electric vehicle charging grid and infrastructure running on NXP’s EdgeVerse™ using Azure IoT Central. This solution helps reduced development risk and speed time to market. NXP EdgeVerse includes the NXP Layerscape LS1012 processor and i.MX RT 1060 series, integrated in Scalys TrustBox Edge, to provide best-in-class power efficiency and the most secure (portable) level of communication solution that connects to Azure IOT Central. As the fueling model shifts from petroleum to electric, intelligent management of grid load balancing is key.

OMNIO.net: Danish IoT connectivity startup onboarding devices and unifying data

OMNIO.net, a Danish Industrial IoT connectivity startup, is partnering with Microsoft Azure IoT to solve two of the biggest hurdles in Industrial IoT: onboarding of devices and unification of data.

OMNIO.net is helping companies of all sizes who have outfitted their campuses with solar panels. The OMNIO.net solution connected these panels to Azure IoT Hub to gather real-time data that will help optimize energy production and limit downtime. Companies look to OMNIO.net to overcome challenges connecting industrial devices and getting the most from their data. What may have taken months in the past, with the combination of OMNIO.net’s energy expertise and Azure IoT offers device connection for partners in less than 24 hours, so customers can focus on using their data to solve pressing business challenges rather than on IT.

iGen Technologies: a self-powered heating system for your home

iGen Technologies’ i2 is a self-power heating system for residential homes. With its patented technology, i2 sets a new benchmark in home comfort and efficiency, by generating, storing and using its own electricity, keeping the heat on, even during a grid outage. The system delivers resilience, lower operating costs, efficiency gains, and greenhouse gas emission reductions. The fully integrated solution offers a dispatchable resource with fuel switching capability, providing utilities a valuable tool to manage peak load and surplus generation situations. iGEN has partnered with Microsoft Azure IoT Central to develop a smart IoT interface for the i2 heat and power system. The integration of iGEN’s distributed energy resource (DER) technology with Microsoft’s robust IoT app platform offers an ideal solution for utility Demand Response programs.

The i2 self-powerd heating system The i2 self-powered heating system. 

Agder Energi, NODES: scaling a sustainable and integrated energy marketplace

Distributed energy resources, digitalization, decarbonization, and new consumer behavior introduce challenges and opportunities for grid system operators to maintain reliable operation of the power system and create customer-centric services. The NODES marketplace relies on Azure to scale its flexible marketplace across 15 projects in 10 different European countries. The focus is on the use of flexibility from the distribution grid, transmission and distribution coordination, and integration with current balancing markets. Agder Energi is now piloting a flexible asset register and data hub with device management and analytics built on IoT Central. Rune Hogga, CEO of Agder Energi Flexibility, told us, "In order to have control of the data and be able to verify flexibility trades, Azure IoT Central provides us with a fast and efficient way to set up a system to collect data from a large number of distributed flexible assets."

L&T Technology Services: reducing carbon consumption and emissions

L&T Technology Services (LTTS) has developed low carbon and EV charging grid solutions for global enterprises, buildings, and smart cities. The LTTS Smart City, Campus & Building solutions enable reducing carbon emissions by up to 40 percent through its iBEMS on Azure solution by connecting an entire building's infrastructure to through single unified interface. In collaboration with Microsoft Real Estate & Facilities, LTTS is building breakthrough EV Charging Solutions providing actionable insights and usage patterns, demand forecasting, design and efficiency anomalies for Facility Managers on EV Charger assets while accurately tracking carbon credit. The LTTS solution also enables Facility Managers to optimize EV Charging Grid based on energy sources (geothermal, solar, electric) and grid constraints such as energy capacity, providing consumer EV charging notifications-based drive range preferences.

Telensa: utilities to support the business case for smart street lighting

Telensa makes wireless smart city applications, helping cities and utilities around the world save energy, work smarter, and deliver more cohesive services for their residents. Telensa is demonstrating how utilities can support the business case for smart street lighting, offering a platform to simply and seamlessly add other smart city applications like traffic monitoring, air quality and EV charging with AI-driven data insights. Telensa’s smart city solutions are increasingly built on Microsoft Azure IoT, leveraging the combination of data, devices, and connectivity, making IoT applications a practical proposition for any city.

Telensa is leading the Urban Data Project, with an initial deployment in Cambridge, UK. This new edge-AI technology is generating valuable insights from streetlight-based imaging, creating a trusted infrastructure for urban data to enable cities to collect, protect, and use their data for the benefit of all residents. The first deployment is in Cambridge, UK. Telensa’s Urban IQ, using Microsoft Power BI for data visualization is an open, low-cost platform to add multiple sensor applications.

  Telensa’s streetlight based multi-sensor pods, which run on Azure IoT Edge and feature real-time AI and machine learning to extract insights.

Telensa’s streetlight based multi-sensor pods, which run on Azure IoT Edge and feature real-time AI and machine learning to extract insights.

eSmart Systems: improving powerline inspections and asset optimization by empowering human experts with Collaborative AI

eSmart Systems helps utilities gain insight into their assets by creating a virtuous cycle of collaboration and training between subject matter experts like Distribution or Transmission Engineers and state of the art deep learning artificial intelligence (AI).

A Microsoft finalist for AI energy partner of the year in 2019, eSmart’s Connected Drone software uses the Azure platform for accurate and self-improving power grid asset discovery and analysis. Grid inspectors continuously review results and correct them to feedback more accurate results to the system. Utilities can optimize visual data to improve their asset registries, reduce maintenance costs and improve reliability.

Kongsberg Digital: Grid Logic digital twin services for electrical grids

Increased electrification and introduction of intermittent, distributed, and renewable energy production challenge today’s grid operations. A lack of sufficient data and insights lead to over-investment, capacity challenges, and power quality issues. With Grid Logic digital twin services running on Azure, grid operators get forecasting and insights into hotspots and scenario simulation. With Azure IoT Hub, Grid Logic will make it possible to build a robust operating system for automation of real-time grid operation, optimization, and automation.

 Grid Logic capacity heatmap for a part of Norwegian DSO BKK Nett’s grid Grid Logic capacity heatmap for a part of Norwegian DSO BKK Nett’s grid.

Let’s connect and collaborate to build your energy solutions  

Microsoft Azure IoT is empowering businesses and industries to shape the future with IoT. We’re ready to meet and support you wherever you are in your transformation journey. Pairing a strong portfolio of products and partners will help you accelerate building robust IoT solutions, to achieve your goals. If you are attending DistribuTECH 2020, speak with Azure IoT experts, or connect with one of the partners mentioned above. 

Learn more about Microsoft Azure IoT and IoT for energy

Partner links:

Six things to consider when using Video Indexer at scale

$
0
0

Your large archive of videos to index is ever-expanding, thus you have been evaluating Microsoft Video Indexer and decided that you want to take your relationship with it to the next level by scaling up.
In general, scaling shouldn’t be difficult, but when you first face such process you might not be sure what is the best way to do it. Questions like “are there any technological constraints I need to take into account?”, “Is there a smart and efficient way of doing it?”, and “can I prevent spending excess money in the process?” can cross your mind. So, here are six best practices of how to use Video Indexer at scale.

1. When uploading videos, prefer URL over sending the file as a byte array

Video Indexer does give you the choice to upload videos from URL or directly by sending the file as a byte array, but remember that the latter comes with some constraints.

First, it has file size limitations. The size of the byte array file is limited to 2 GB compared to the 30 GB upload size limitation while using URL.

Second and more importantly for your scaling, sending files using multi-part means high dependency on your network, service reliability, connectivity, upload speed, and lost packets somewhere in the world wide web, are just some of the issues that can affect your performance and hence your ability to scale. 

Illustration of the different issues that can affect reliability of uploading a file using multi-part

When you upload videos using URL you just need to give us a path to the location of a media file and we will take care of the rest (see below the field from the upload-video API).

To upload videos using URL via API you can check this short-code sample or you can use AzCopy for a fast and reliable way to get your content to a storage account from which you can submit it to Video Indexer using SAS URL.

URL address field in the uploadVideo API

2. Increase media reserved units if needed

Usually in the proof of concept stage when you just start using Video Indexer, you don’t need a lot of computing power. Now, when you want to scale up your usage of Video Indexer you have a larger archive of videos you want to index and you want the process to be at a pace that fits your use case. Therefore, you should think about increasing the number of compute resources you use if the current amount of computing power is just not enough.

In Azure Media Services, when talking about computing power and parallelization we talk about media reserved units (RUs), those are the compute units that determine the parameters for your media processing tasks. The number of RUs affects the number of media tasks that can be processed concurrently in each account and their type determines the speed of processing and one video might require more than one RU if its indexing is complex. When your RUs are busy, new tasks will be held in a queue until another resource is available.

We know you want to operate efficiently and you don’t want to have resources that eventually will stay idle part of the time. For that reason, we offer an auto-scale system that spins RUs down when less processing is needed and spin RUs up when you are in your rush hours (up to fully use all of your RUs). You can easily enable this functionality by turning on the autoscale in the account settings or using Update-Paid-Account-Azure-Media-Services API.

autoscale button in the account settingsAPI sample to update paid account on AMS with autoScale = trueTo minimize indexing duration and low throughput we recommend you start with 10 RUs of type S3. Later if you scale up to support more content or higher concurrency, and you need more resources to do so, you can contact us using the support system (on paid accounts only) to ask for more RUs allocation.

3. Respect throttling

Video Indexer is built to deal with indexing at scale, and when you want to get the most out of it you should also be aware of the system’s capabilities and design your integration accordingly. You don’t want to send an upload request for a batch of videos just to discover that some of the movies didn’t upload and you are receiving an HTTP 429 response code (too many requests). It can happen due to the fact that you sent more requests than the limit of movies per minute we support. Don’t worry, in the HTTP response, we add a retry-after header. The header we will specify when you should attempt your next retry. Make sure you respect it before trying your next request.

The documentation of the HTTP 429 response the user receives

4. Use callback URL

Have you ever called customer service and their response was “I’m now processing your request, it will take a few minutes. You can leave your phone number and we’ll get back to you when it is done”? The cases when you do leave your number and they call you back the second your request was processed are exactly the same concept as using callback URL.

Thus we recommend that instead of polling the status of your request constantly from the second you sent the upload request, you can just add a callback URL, and wait for us to update you. As soon as there is any status change in your upload request, we will send a POST notification to the URL you sent.

You can add a callback URL as one of the parameters of the upload-video API (see below the description from the API). If you are not sure how to do it, you can check the code samples from our GitHub repo. By the way, for callback URL you can also use Azure Functions, a serverless event-driven platform that can be triggered by HTTP and implement a following flow.

callback URL address field in the uploadVideo API

5. Use the right indexing parameters for you

Probably the first thing you need to do when using Video Indexer, and specifically when trying to scale, is to think about how to get the most out of it with the right parameters for your needs. Think about your use case, by defining different parameters you can save yourself money and make the indexing process for your videos faster.

We are giving you the option to customize your usage in Video Indexer by choosing those indexing parameters. Don’t set the preset to streaming it if you don’t plan to watch it, don’t index video insights if you only need audio insights, it is that easy.

Before uploading and indexing your video read this short documentation, check the indexingPreset and streamingPreset parts to get a better idea of what your options are.

6. Index in optimal resolution, not highest resolution

Not too long ago, we were in times when HD videos didn't exist. Now, we have videos of varied qualities from HD to 8K. The question is, what video quality do you need for indexing your videos? The higher the quality of the movie you upload means the higher the file size, and this leads to higher computing power and time needed to upload the video.

Our experiences show that, in many cases, indexing performance has almost no difference between HD (720P) videos and 4K videos. Eventually, you’ll get almost the same insights with the same confidence.

For example, for the face detection feature, a higher resolution can help with the scenario where there are many small but contextually important faces. However, this will come with a quadratic increase in runtime (and therefore higher COGS) and an increased risk of false positives.

Therefore, we recommend you to verify that you get the right results for your use case and to first test it locally. Upload the same video in 720P and in 4K and compare the insights you get. Remember, No need to use a cannon to kill a fly.

Have questions or feedback? We would love to hear from you. Use our UserVoice page to help us prioritize features, leave a comment below or email VISupport@Microsoft.com for any questions.

We want to hear about your use case, and we can help you scale.

Microsoft Compliance Score helps address the ever-changing data privacy landscape

Mind your Margins!

$
0
0

Introduction

The search box is the most important piece of UX on our page. It won’t be an overstatement to say that the search box is the most important piece of UX on any search engine. As the front line between us and what customers are looking for, it is very important that the search box is:

  • Clear (easy to spot),
  • Responsive (low latency),
  • Intelligent (provides relevant suggestions).

At Bing, every pixel of UX earns its position and size on the page. We put every UX element through rigorous design reviews and multiple controlled experiments. No change to the UX is too trivial, no change passes through un-verified. Besides this all the various ways users interact with the different UX elements on our page(s) are analyzed constantly. During one such exercise we noticed that some of our customers were having a sub-optimal experience with our search box. Some of their clicks were being ignored by the search box. As we dug deeper the investigation led us to recognize the power of detailed instrumentation and the impact that small tweaks in the UX can have on overall customer satisfaction. Along the way we uncovered that this issue was not unique to Bing. In fact, we saw it on websites big and small throughout the web. It turns out,  “Mind your margins!”, a phrase you might have heard from your English teacher, is still relevant and is applicable to search boxes on many of the world’s premiere websites.

The search box as it appears to the users on Bing.com.
Figure 1: The search box as it appears to the users on Bing.com.
 

The Issue: Missed Clicks

While analyzing user interaction (with our web pages) data on Bing.com, something caught our attention recently. We noticed that a non-trivial percentage of our users clicked multiple times on the search box. In some cases, however, the number of clicks were way more than the number of searches or re-queries issued by the user. When we dug deeper into these interactions using our in-house web instrumentation library, Clarity (which lets us replay user interactions), we were able to determine that in a large number of such cases our users’ clicks were being missed. A “missed click” is a click by the user that does not bring about any change in the UX or the state of the web page. It is as if the click never happened and is a common UX issue for buttons and links on many web properties. Missed clicks anywhere on the page are not good but especially bad when they are on the search box which is the most important piece of UX on Bing.

To see this in action look at the video snippet below:

.
Figure 2: Shows missed click on the search box on Bing.com


Missed clicks are not easy to detect, consider a user clicking somewhere on the page you did not anticipate (not clicking a link or an image or a button but clicking on something unclickable like text or an empty space). Will your instrumentation take that signal to your data warehouse? Most websites today will miss that the user clicked somewhere on the page if it was not a button or a link. Luckily for us at Bing, Clarity was able to detect not just missed clicks but many other subtle user interaction patterns with our web pages. Clarity was able to show us that sometimes even though users were clicking on our search box multiple times, their clicks were being missed. We were then able to quantify that 4% of all the users that clicked on the search box had one or more missed clicks


The Cause: Margins

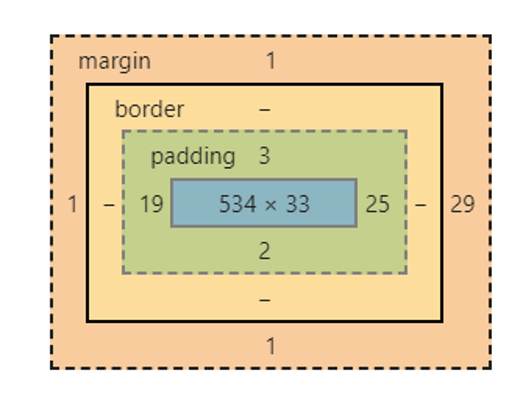
Once we noticed the missed clicks, we then wanted to find out the exact location of where these were occurring on the search box. Immediately one location jumped out at us. We noticed that most missed clicks were occurring on the left corner of the search box i.e. margin or the area between the html form control that contains the search box and the search box itself (shown in orange below). Since both the form and the search box have the same background color, it was not possible for the users to know that they were clicking on the margin of the search box. Click events on this margin, therefore, were not passed to the search box thereby causing missed clicks. It was now clear to us why we were losing 4% of clicks on the search box (The area covered by the margins, orange area, which is not clickable is around 10% of the area of the search box shown in blue + green).
 

Figure 3: Clicks on the orange area to the left and top of the  search box, were not handled by the event handlers associated with search box and were being ignored.
Figure 4: CSS Box Model of the Bing Search box
 

The Fix

The fix was straightforward, we had to reduce the margins between the search box and the html form that contained the search box, specifically the top, left and bottom margins. The right margins were less of an issue since the presence of the “search by image” icon and the spy glass icon for search gave users a clear visual clue that this part of the control was not for text in search box. The Figure below shows one of the many treatments we tried for the fix, reducing the top margin by 4px and reducing the left margin by 19 px made almost the entire area of the form control (which contains the search box) clickable and all but eliminated the missed clicks on the search box, while maintaining visual parity with the control. As an aside keeping visual parity between control and treatment was important as we wanted to isolate any metric movements just to the elimination of search box margins.

Figure 5: Removal of margins on the search box all but completely hides the orange area and eliminates missed clicks.


Figure 6: Video showing the fix, no more missed clicks on the Bing search box.
 

Results / Gauging User Impact

Once we rolled out the fix to production, missed clicks on the search box all but vanished, and not only that - the results from multiple flights suggested positive movements in our user satisfaction metrics as well. We saw the User SAT metrics like traffic utility rate and SSRX (the two hardest to move metrics historically) showed high stat significant movement in the positive direction. Eliminating missed clicks on the search box alone ended up improving the Session Success Rate Metric (SSRX) by 0.017% and the Traffic utility rate went up by 0.3%. Both these metrics are extremely hard to move and have been shown to impact not just user satisfaction with the search results page but also long-term user retention.

We would have shipped this change just to fix the missed clicks issue but when we saw the positive impact on these metrics, it was icing on the cake. Yet again we learned that even small changes in user interface can deliver significant user impact all up.


Not Unique to Bing

Armed with our success on Bing, we were curious to investigate whether other websites with search boxes had such margins as well, after all a margin between the search box and the container html control (both with the same background color) is a common UX pattern present on multiple sites. We found that other popular websites including search engines and social media have unclickable areas (due to margins) on their search boxes too and may be experiencing missed clicks. It is possible that these websites can impact their users positively by using the fix we applied in Bing.


Conclusion

As we wrapped up our investigation we were left with a few key takeaways:

  1. Small tweaks matter, even tiny changes to the UX can lead to a significant impact on user satisfaction. 
  2. Don’t forget Fitts law, don’t make it hard for users to click where you want them to.
  3. Scale multiplies the impact of small improvements and just as much multiplies the negative impact of minor annoyances. Even an issue which will affect a tiny fraction of your users might lead to thousands even hundreds of thousands of users with a sub optimal experience.
  4. You can’t afford to have blind spots in your web page instrumentation, any user action, no matter how trivial,  taken on your page should be instrumented stored and analyzed.
  5. Don’t take popular UX patterns for granted. 

And finally, when it comes to your search boxes, “Mind your Margins!”  😊

Clarity: Fine grained instrumentation to track user interactions

We cannot overstate the contribution of Clarity in underscoring and helping us identify this issue. Clarity our website analytics tool developed in house, played a pivotal role in this investigation and showed us the impact of the issue on our user base. As mentioned earlier, missed clicks anywhere on a web page are not tracked on most websites, fortunately clarity keeps track of all user interactions and DOM mutations on the Bing.com webpages, while allowing web masters powerful privacy controls. It provided us with a trove of data with missed clicks and their precise location on the page which helped us not only understand the impact of the missed clicks but also identify the fix(es) necessary. If you are a webmaster, we strongly encourage you to explore this tool by visiting https://clarity.microsoft.com and applying for the free pilot so you can start reaping the benefits in just a few clicks. To learn more about how clarity tracks user interaction check out clarity project page on GitHub


Assess your servers with a CSV import into Azure Migrate

$
0
0

At Microsoft Ignite, we announced new Azure Migrate assessment capabilities that further simplify migration planning. In this post, we will demonstrate how to import servers into Azure Migrate Server Assessment through a CSV upload. Virtual servers of any hypervisor or cloud as well as physical servers can be assessed. You can get started with the CSV import feature by creating an Azure Migrate project or using your existing project.

Previously, Server Assessment required setting up an appliance in customer premises to perform discovery of VMware, Hyper-V virtual machines (VMs), and physical servers. We now also support importing and assessing servers without deploying an appliance. Import-based assessments provide support for Server Assessment features like Azure suitability analysis, migration cost planning, and performance-based rightsizing. The import-based assessment is helpful in the initial stages of migration planning, when you may not be able to deploy the appliance due to pending organizational or security constraints that prevent you from sending data to Azure.

Importing your servers is easy. Simply upload the server inventory in a CSV file as per the template provided by Azure Migrate. Only four data points are mandatory — server name, number of cores, size of memory, and operating system name. While you can run the assessment with this minimal information, we recommend you provide disk data as well to avail disk sizing in assessments.

A screenshot of the Discover machines page in Azure Migrate - Servers.

An example CSV file with the Server name, number of cores, Operating system name, CPU utilization, and disk information filled in.

A screenshot of the CMDB_Import overview.

Azure suitability analysis

The assessment determines whether a given server can be migrated as-is to Azure. Azure support is checked for each server discovered; if it is found that a server is not ready to be migrated, remediation guidance is automatically provided. You can customize your assessment by changing its properties, and regenerate the assessment reports. You can also generate an assessment report by choosing a VM series of your choice and specify the uptime of the workloads you will run in Azure.

Cost estimation and sizing

Assessment reports provide detailed cost estimates. You can optimize on cost using performance-based rightsizing assessments; the performance utilization value you specify of your on-premises server is taken into consideration to recommend an appropriate Azure Virtual Machine and disk SKU. This helps to optimize and right-size on cost as you migrate servers that might be over-provisioned in your on-premises data center. You can apply subscription offers and Reserved Instance pricing on the cost estimates

A screenshot of the CMDB_Import Azure readiness page.

Assess your imported servers in four simple steps

  1. Create an Azure Migrate project and add the Server Assessment solution to the project. If you already have a project, you do not need to create a new one. Download the CSV template for importing servers.
  2. Gather the inventory data from a configuration management database (CMDB), or from your vCenter server, or Hyper-V environments. Convert the data into the format of the Azure Migrate CSV template.
  3. Import the servers into Azure Migrate by uploading the server inventory in a CSV file as per the template.
  4. Once you have successfully imported the servers, create assessments and review the assessment reports.

When you are ready to deploy an appliance, you can leverage the performance history gathered by the appliance for more accurate sizing, as well as plan migration phases using dependency analysis.

Get started right away by creating an Azure Migrate project. Note that the inventory metadata uploaded is persisted in the geography you select while creating the project. You can select a geography of your choice. Server Assessment is available today in Asia Pacific, Australia, Brazil, Canada, Europe, France, India, Japan, Korea, United Kingdom, and United States geographies.

In the upcoming blog, we will talk about application discovery and agentless dependency analysis.

Resources to get started

  • Read this tutorial on how to import and assess servers using Azure Migrate Server Assessment.
  • Read these tutorials on how to assess Hyper-V, VMware, or any physical or virtual servers using the appliance in Server Assessment.

Azure IoT improves pharmaceutical sample management and medication adherence

$
0
0

For the recent IoT Signals report, commissioned by our Azure IoT team and conducted by Hypothesis Group, more than 3,000 decision makers at enterprise companies across the US, UK, Germany, France, China, and Japan who were currently involved in IoT, participated in a 20-minute online survey. Healthcare was one of the industries included in the research. Of the healthcare executives surveyed, 82 percent said they have at least one IoT project in either the learning, proof of concept, purchase, or use phase, with many reporting they have one or more projects currently in ‘use.’ The top use cases cited by the healthcare executives included:

  • Tracking patient staff and inventory.
  • Remote device monitoring and service.
  • Remote health monitoring and assistance.
  • Safety, security, and compliance.
  • Facilities management.

Today we want to shed light on how two innovative companies are building upon this momentum and their own research to build IoT-enabled solutions with Azure IoT technologies that support medication management and adherence. These solutions address the safety, security, compliance, and inventory use cases highlighted in the report.

The Cost of Pharmaceutical Samples

According to a January 2019 article published by JAMA, Medical Marketing in the United States, 1997-2016, “Marketing to health care professionals by pharmaceutical companies accounted for [the] most promotional spending and increased from $15.6 billion to $20.3 billion, including $5.6 billion for prescriber detailing, $13.5 billion for free samples.”

Improving sample management

With billions of dollars on the line, one of our partners has developed an innovative way to ensure that pharmaceutical companies manage their samples in a cost-effective way. Using their own knowledge of the pharmaceutical industry and in-depth research, P360 (formerly Prescriber360), developed Swittons to Example of a branded virtual rep devicebridge the gap between pharmaceutical companies and physicians. Designed as a “virtual pharmaceutical representative,” this IoT-enabled device offers real-time, secure communications between the physician and the pharmaceutical company. With this single device, physicians can order a sample, request a visit from a medical science liaison (MSL) or sales rep, or connect with the pharmaceutical company’s inside sales rep (as shown in the graphic below).

Designed to be branded with each pharmaceutical company’s product, the device is a physician engagement tool that enables pharmaceutical companies to customize and manage a sales channel that remains fully authentic to their brand experience. Furthermore, it provides an audit trail to manage samples more economically, enabling pharmaceutical companies to penetrate market whitespace and extend efficient sampling in areas that were previously unreachable.

sample management workflowBuilt on our Azure IoT platform, Swittons takes advantage of the latest in cloud, security, telecommunications, and analytics technology. “We strategically selected Azure IoT as the foundation for our Swittons ‘Virtual Rep.’ Microsoft’s vision, investments and the breadth of Azure cloud were the key criteria for selection. Having a reliable IoT platform along with world-class data and security infrastructure in Azure made the choice very easy,” commented Anupam Nandwana, CEO, P360, parent company of Swittons.

On the other end of the pharmaceutical supply chain is another scenario that dramatically affects the efficacy of pharmaceutical products—medication adherence.

Ensuring medication adherence

In the US today, 25 to 50 percent of all adults fail to take their prescribed medication on time, contributing to poor health outcomes, over-utilization of healthcare services and significant cost increases.

The causes of low levels of medication adherence are multi-faceted and include factors like carelessness, fear, supply, cost, and lack of understanding or information, with forgetfulness as the primary cause.

Furthermore, as cited in an editorial from BMJ Quality and Safety, “medication adherence thus constitutes one of the ‘big hairy problems’ or ‘big hairy audacious goals’ of healthcare. As well as affecting patients’ long-term outcomes, non-adherence can increase healthcare costs through consumption of medicines below the threshold of adherence required for clinical benefit, as well as contributing to healthcare resource use such as hospital admissions.

In response to this, the global market for medication adherence (hardware-based automation and adherence systems and software-based applications) was worth nearly $1.7 billion in 2016. The market is expected to reach more than $3.9 billion by 2021, increasing at a CAGR of 18.0 percent from 2016 through 2021. This steep increase is fueled by burgeoning demand for advanced medication adherence systems and a growing number of people worldwide with chronic diseases.

Personal experience leads to action

Emanuele Musini knows all too well the implications of not taking medications properly. In fact, it was the pain of losing his father in 2005 from a chronic condition and a lack of adhering to the prescribed medication regimen that became the catalyst for Emanuele to start studying the issue in-depth, searching for a solution. In 2015, Emanuele, along with his multidisciplinary team of doctors, entrepreneurs, engineers, and user-experience professionals, created Pillo Health, a health platform centered around a robot and digital assistant designed to prevent other family members from enduring what Emanuele and his family experienced. Since their founding, they’ve partnered with leading manufacturers, such as Stanley Black & Decker, to bring in-home medication management solutions to market with solutions like Pria, a winner of the 2019 CES Innovation Awards.”

The Pillo Health team built their medication adherence solution on Microsoft Azure Cloud Services using Azure Cognitive Services for voice technology and facial recognition, and services from the Azure IoT platform, including IoT Hub. The result is a voice-first, personalized, cloud-enabled, medication assistant that can help people maintain their medication regimen through social connectivity and delivery of important medical information at home. In a 4-week study conducted with AARP in 2018 for diabetic patients who were prescribed Metformin, Pillo delivered an average medication adherence rate of more than 87 percent—a meaningful 20 to 30 percent improvement from conventional reported standards.

Antonello Scalmato, Director of Cloud Services at Pillo Health noted, “We selected Microsoft Azure because it provided the best infrastructure for PaaS applications, allowed us to speed up the development of our complex product and avoided the overhead of machine and security management for traditional web API infrastructure. Moreover, IoT Hub provides a channel for secure communications and notifications to our users, and also enables simple device management that protects our product, from the factory into the users' homes.”

Pillo Health digital medication assistant Pillo Health digital medication assistant in the home

Learn More


Azure Cost Management updates – January 2020

$
0
0

Whether you're a new student, thriving startup, or the largest enterprise, you have financial constraints and you need to know what you're spending, where, and how to plan for the future. Nobody wants a surprise when it comes to the bill, and this is where Azure Cost Management comes in.

We're always looking for ways to learn more about your challenges and how Azure Cost Management can help you better understand where you're accruing costs in the cloud, identify and prevent bad spending patterns, and optimize costs to empower you to do more with less. Here are a few of the latest improvements and updates based on your feedback:

Let's dig into the details. 

Automate reporting for Microsoft Customer Agreement with scheduled exports

You already know you can dig into your cost and usage data from the Azure portal. You may even know you can get rich reporting from the Cost Management Query API or get the full details, in all its glory, from the UsageDetails API. These are both great for ad-hoc queries, but maybe you're looking for a simpler solution. This is where Azure Cost Management exports come in.

Azure Cost Management exports automatically publish your cost and usage data to a storage account on a daily, weekly, or monthly basis. Up to this month, you've been able to schedule exports for Enterprise Agreement (EA) and pay-as-you-go (PAYG) accounts. Now, you can also schedule exports across subscriptions for Microsoft Customer Agreement billing accounts, subscriptions, and resource groups.

Learn more about scheduled exports in Create and manage exported data

Raising awareness of disabled costs

Enterprise Agreement (EA) and Microsoft Customer Agreement (MCA) accounts both offer an option to hide prices and charges from subscription users. While this can be useful to obscure negotiated discounts (including vendors), it also puts you at risk of over-spending since teams that deploy and manage resources don't have visibility and cannot effectively keep costs down. To avoid this, we recommend using custom Azure RBAC roles for anyone who shouldn't see costs, while allowing everyone else to fully manage and optimize costs.

Unfortunately, some organizations may not realize costs have been disabled. This can happen when you renew your EA enrollment or when you switch between EA partners, as an example. In an effort to help raise awareness of these settings, you will see new messaging when costs have been disabled for the organization. Someone who does not have access to see costs will see a message like the following in cost analysis:

Message stating "Cost Management not enabled for subscription users. Contact your subscription account admin about enabling 'Account owner can view charges' on the billing account."

EA billing account admins and MCA billing profile owners will also see a message in cost analysis to ensure they're aware that subscription users cannot see or optimize costs.

Cost analysis showing a warning to Enterprise Agreement (EA) and Microsoft Customer Agreement (MCA) admins that "Subscription users cannot see or optimize costs. Enable Cost Management." with a link to enable view charges for everyone

To enable access to Azure Cost Management, simply click the banner and turn on "Account owners can view charges" for EA accounts and "Azure charges" for MCA accounts. If you're not sure whether subscription users can see costs on your billing account, check today and unlock new cost reporting, control, and optimization capabilities for your teams. 

What's new in Cost Management Labs

With Cost Management Labs, you get a sneak peek at what's coming in Azure Cost Management and can engage directly with us to share feedback and help us better understand how you use the service, so we can deliver more tuned and optimized experiences. Here are a few features you can see in Cost Management Labs:

  • Get started quicker with the cost analysis Home view
    Azure Cost Management offers five built-in views to get started with understanding and drilling into your costs. The Home view gives you quick access to those views so you get to what you need faster.
  • NEW: Try Preview gives you quick access to preview featuresNow available in the public portal
    You already know Cost Management Labs gives you early access to the latest changes. Now you can also opt in to individual preview features from the public portal using the Try preview command in cost analysis.

Of course, that's not all. Every change in Azure Cost Management is available in Cost Management Labs a week before it's in the full Azure portal. We're eager to hear your thoughts and understand what you'd like to see next. What are you waiting for? Try Cost Management Labs today. 

Custom RBAC role preview for management groups

Management groups now support defining custom RBAC roles to allow you to assign more specific permissions to users, groups, and apps within your organization. One example could be a role that allows someone to be able to create and manage the management group hierarchy as well as manage costs using Azure Cost Management + Billing APIs. Today, this requires both the Management Group Contributor and Cost Management Contributor roles, but these permissions could be combined into a single custom role to streamline role assignment.

If you're unfamiliar with RBAC, Azure role-based access control (RBAC) is the authorization system used to manage access to Azure resources. To grant access, you assign roles to users, groups, service principals, or managed identities at a particular scope, like a resource group, subscription, or in this case, a management group. Cost Management + Billing supports the following built-in Azure RBAC roles, from least to most privileged:

  • Cost Management Reader: Can view cost data, configuration (including budgets exports), and recommendations.
  • Billing Reader: Lets you read billing data.
  • Reader: Lets you view everything, but not make any changes.
  • Cost Management Contributor: Can view costs, manage cost configuration (including budgets and exports), and view recommendations.
  • Contributor: Lets you manage everything except access to resources.
  • Owner: Lets you manage everything, including access to resources.

While most organizations will find the built-in roles to be sufficient, there are times when you need something more specific. This is where custom RBAC roles come in. Custom RBAC roles allow you to define your own set of unique permissions by specifying a set of wildcard "actions" that map to Azure Resource Manager API calls. You can mix and match actions as needed to meet your specific needs, whether that's to allow an action or deny one (using "not actions"). Below are a few examples of the most common actions:

  • Microsoft.Consumption/*/read – Read access to all cost and usage data, including prices, usage, purchases, reservations, and resource tags.
  • Microsoft.Consumption/budgets/* – Full access to manage budgets.
  • Microsoft.CostManagement/*/read – Read access to cost and usage data and alerts.
  • Microsoft.CostManagement/views/* – Full access to manage shared views used in cost analysis.
  • Microsoft.CostManagement/exports/* – Full access to manage scheduled exports that automatically push data to storage on a regular basis.
  • Microsoft.CostManagement/cloudConnectors/* – Full access to manage AWS cloud connectors that allow you manage Azure and AWS costs together in the same management group. 

New ways to save money with Azure

Lots of cost optimization improvements over the past month! Here are a few you might be interested in:

Recent changes to Azure usage data

Many organizations use the full Azure usage and charges dataset to understand what's being used, identify what charges should be internally billed to which teams, and/or to look for opportunities to optimize costs with Azure reservations and Azure Hybrid Benefit, just to name a few. If you're doing any analysis or have setup integration based on product details in the usage data, please update your logic for the following services.

All of the following changes were effective January 1:

Also, remember the key-based Enterprise Agreement (EA) billing APIs have been replaced by new Azure Resource Manager APIs. The key-based APIs will still work through the end of your enrollment, but will no longer be available when you renew and transition into Microsoft Customer Agreement. Please plan your migration to the latest version of the UsageDetails API to ease your transition to Microsoft Customer Agreement at your next renewal. 

Documentation updates

There were tots of documentation updates. Here are a few you might be interested in:

Want to keep an eye on all of the documentation updates? Check out the Cost Management doc change history in the azure-docs repository on GitHub. If you see something missing, select Edit at the top of the document and submit a quick pull request.

What's next?

These are just a few of the big updates from last month. We're always listening and making constant improvements based on your feedback, so please keep the feedback coming.

Follow @AzureCostMgmt on Twitter and subscribe to the YouTube channel for updates, tips, and tricks. And, as always, share your ideas and vote up others in the Cost Management feedback forum.

TraceProcessor 0.3.0

$
0
0

TraceProcessor version 0.3.0 is now available on NuGet with the following package ID:

Microsoft.Windows.EventTracing.Processing.All

This release contains some feature additions and bug fixes since version 0.2.0. (A full changelog is below). Basic usage is still the same as in version 0.1.0.

The focus of this release has been in preparation for a forthcoming version 1.0.0, including many minor changes to naming and data types moving towards a finalized version 1 API.

Also, this release adds trace.UseStreaming(), which supports accessing multiple types of trace data in a streaming manner (processing data as it is read from the trace file, rather than buffering that data in memory). For example, a syscalls trace can be quite large, and buffering the entire list of syscalls in a trace can be quite expensive. The following code shows accessing syscall data in the normal, buffered manner via trace.UseSyscalls():


using Microsoft.Windows.EventTracing;
using Microsoft.Windows.EventTracing.Processes;
using Microsoft.Windows.EventTracing.Syscalls;
using System;
using System.Collections.Generic;

class Program
{
    static void Main(string[] args)
    {
        if (args.Length != 1)
        {
            Console.Error.WriteLine("Usage: <trace.etl>");
            return;
        }

        using (ITraceProcessor trace = TraceProcessor.Create(args[0]))
        {
            IPendingResult<ISyscallDataSource> pendingSyscallData = trace.UseSyscalls();

            trace.Process();

            ISyscallDataSource syscallData = pendingSyscallData.Result;

            Dictionary<IProcess, int> syscallsPerCommandLine = new Dictionary<IProcess, int>();

            foreach (ISyscall syscall in syscallData.Syscalls)
            {
                IProcess process = syscall.Thread?.Process;

                if (process == null)
                {
                    continue;
                }

                if (!syscallsPerCommandLine.ContainsKey(process))
                {
                    syscallsPerCommandLine.Add(process, 0);
                }

                ++syscallsPerCommandLine[process];
            }

            Console.WriteLine("Process Command Line: Syscalls Count");

            foreach (IProcess process in syscallsPerCommandLine.Keys)
            {
                Console.WriteLine($"{process.CommandLine}: {syscallsPerCommandLine[process]}");
            }
        }
    }
}

With a large syscalls trace, attempting to buffer the syscall data in memory can be quite expensive, or it may not even be possible. The following code shows how to access the same syscall data in a streaming manner, replacing trace.UseSyscalls() with trace.UseStreaming().UseSyscalls():


using Microsoft.Windows.EventTracing;
using Microsoft.Windows.EventTracing.Processes;
using Microsoft.Windows.EventTracing.Syscalls;
using System;
using System.Collections.Generic;

class Program
{
    static void Main(string[] args)
    {
        if (args.Length != 1)
        {
            Console.Error.WriteLine("Usage: <trace.etl>");
            return;
        }

        using (ITraceProcessor trace = TraceProcessor.Create(args[0]))
        {
            IPendingResult<IThreadDataSource> pendingThreadData = trace.UseThreads();

            Dictionary<IProcess, int> syscallsPerCommandLine = new Dictionary<IProcess, int>();

            trace.UseStreaming().UseSyscalls(ConsumerSchedule.SecondPass, context =>
            {
                Syscall syscall = context.Data;
                IProcess process = syscall.GetThread(pendingThreadData.Result)?.Process;

                if (process == null)
                {
                    return;
                }

                if (!syscallsPerCommandLine.ContainsKey(process))
                {
                    syscallsPerCommandLine.Add(process, 0);
                }

                ++syscallsPerCommandLine[process];
            });

            trace.Process();

            Console.WriteLine("Process Command Line: Syscalls Count");

            foreach (IProcess process in syscallsPerCommandLine.Keys)
            {
                Console.WriteLine($"{process.CommandLine}: {syscallsPerCommandLine[process]}");
            }
        }
    }
}

By default, all streaming data is provided during the first pass through the trace, and buffered data from other sources is not available. This example shows how to combine streaming with buffering – thread data is buffered before syscall data is streamed. As a result, the trace must be read twice – once to get buffered thread data, and a second time to access streaming syscall data with the buffered thread data now available. In order to combine streaming and buffering in this way, the example passes ConsumerSchedule.SecondPass to trace.UseStreaming().UseSyscalls(), which causes syscall processing to happen in a second pass through the trace. By running in a second pass, the syscall callback can access the pending result from trace.UseThreads() when it processes each syscall. Without this optional argument, syscall streaming would have run in the first pass through the trace (there would be only one pass), and the pending result from trace.UseThreads() would not be available yet. In that case, the callback would still have access to the ThreadId from the syscall, but it would not have access to the process for the thread (because thread to process linking data is provided via other events which may not have been processed yet).

Some key differences in usage between buffering and streaming:

  1. Buffering returns an IPendingResult<T>, and the result it holds is available only before the trace has been processed. After the trace has been processed, the results can be enumerated using techniques such as foreach and LINQ.
  2. Streaming returns void and instead takes a callback argument. It calls the callback once as each item becomes available. Because the data is not buffered, there is never a list of results to enumerate with foreach or LINQ – the streaming callback needs to buffer whatever part of the data it wants to save for use after processing has completed.
  3. The code for processing buffered data appears after the call to trace.Process(), when the pending results are available.
  4. The code for processing streaming data appears before the call to trace.Process(), as a callback to the trace.UseStreaming.Use…() method.
  5. A streaming consumer can choose to process only part of the stream and cancel future callbacks by calling context.Cancel(). A buffering consumer always is provided a full, buffered list.

Sometimes trace data comes in a sequence of events – for example, syscalls are logged via separate enter and exit events, but the combined data from both events can be more helpful. The method trace.UseStreaming().UseSyscalls() correlates the data from both of these events and provides it as the pair becomes available. A few types of correlated data are available via trace.UseStreaming():

Code

Description

trace.UseStreaming().UseContextSwitchData() Streams correlated context switch data (from compact and non-compact events, with more accurate SwitchInThreadIds than raw non-compact events).
trace.UseStreaming().UseScheduledTasks() Streams correlated scheduled task data.
trace.UseStreaming().UseSyscalls() Streams correlated system call data.
trace.UseStreaming().UseWindowInFocus() Streams correlated window-in-focus data.

Additionally, trace.UseStreaming() provides parsed events for a number of different standalone event types:

Code

Description

trace.UseStreaming().UseLastBranchRecordEvents() Streams parsed last branch record (LBR) events.
trace.UseStreaming().UseReadyThreadEvents() Streams parsed ready thread events.
trace.UseStreaming().UseThreadCreateEvents() Streams parsed thread create events.
trace.UseStreaming().UseThreadExitEvents() Streams parsed thread exit events.
trace.UseStreaming().UseThreadRundownStartEvents() Streams parsed thread rundown start events.
trace.UseStreaming().UseThreadRundownStopEvents() Streams parsed thread rundown stop events.
trace.UseStreaming().UseThreadSetNameEvents() Streams parsed thread set name events.

Finally, trace.UseStreaming() also provides the underlying events used to correlate data in the list above. These underlying events are:

Code

Description

Included in

trace.UseStreaming().UseCompactContextSwitchEvents() Streams parsed compact context switch events. trace.UseStreaming().UseContextSwitchData()
trace.UseStreaming().UseContextSwitchEvents() Streams parsed context switch events. SwitchInThreadIds may not be accurate in some cases. trace.UseStreaming().UseContextSwitchData()
trace.UseStreaming().UseFocusChangeEvents() Streams parsed window focus change events. trace.UseStreaming().UseWindowInFocus()
trace.UseStreaming().UseScheduledTaskStartEvents() Streams parsed scheduled task start events. trace.UseStreaming().UseScheduledTasks()
trace.UseStreaming().UseScheduledTaskStopEvents() Streams parsed scheduled task stop events. trace.UseStreaming().UseScheduledTasks()
trace.UseStreaming().UseScheduledTaskTriggerEvents() Streams parsed scheduled task trigger events. trace.UseStreaming().UseScheduledTasks()
trace.UseStreaming().UseSessionLayerSetActiveWindowEvents() Streams parsed session-layer set active window events. trace.UseStreaming().UseWindowInFocus()
trace.UseStreaming().UseSyscallEnterEvents() Streams parsed syscall enter events. trace.UseStreaming().UseSyscalls()
trace.UseStreaming().UseSyscallExitEvents() Streams parsed syscall exit events. trace.UseStreaming().UseSyscalls()

If there are other types of data that you think would benefit from streaming support, please let us know.

As before, if you find these packages useful, we would love to hear from you, and we welcome your feedback. For questions using this package, you can post on StackOverflow with the tag .net-traceprocessing, and issues can also be filed on the eventtracing-processing project on GitHub.

The full changelog for version 0.3.0 is as follows:

Breaking Changes

  • StartTime and StopTime have changed from DateTime to DateTimeOffset (no longer UTC but now preserving the trace time zone offset).
  • The following three properties on IContextSwitchIn were incorrect and have been removed: ThreadState, IsWaitModeSwapable and ThreadRank. These properties remain available from IContextSwitchOut.
  • Metadata has been removed. Use trace.UseMetadata instead.
  • OriginalFileName was removed because it may contain inaccurate data. Use IImage.OriginalFileName instead.
  • IImageWeakKey was removed because it may contain inaccurate data. Use IImage.Timestamp and IImage.Size instead.
  • WeakKey was removed because it may contain inaccurate data. Use Use IImage.Timestamp and IImage.Size instead.
  • DefaultSymCachePath was removed. Use static properties on SymCachePath instead.
  • DefaultSymbolPath was removed. Use static properties on SymCachePath instead.
  • Service snapshots were previously available from both IServiceDataSource and ISystemMetadata. They are now only available from IServiceDataSource.
  • Trace statistics and stack events have had their shapes made consistent with event APIs elsewhere in trace processor.
  • Renames:

    • ExecutingDeferredProcedureCall was removed. Use ICpuSample.IsExecutingDeferredProcedureCall instead.
    • ExecutingInterruptServicingRoutine was removed. Use ICpuSample.IsExecutingInterruptServicingRoutine instead.
    • IsWaitModeSwapable was incorrect and has been renamed IsUserMode.
    • The enum RawWaitReason has been renamed KernelWaitReason.
    • The RawWaitReason property on IContextSwitchOut has been renamed WaitReason.
    • StartTime has been renamed to EnterTime, and ISyscall.StopTime has been renamed to ExitTime.
    • ErrorCode has been changed to ExitCode for consistency.
    • UniqueKey has been renamed to ObjectAddress for accuracy.
    • TimeRange has been renamed to TraceTimeRange.
    • DiskIOPriority has been renamed to IOPriority.
    • A few core types named GenericEvent* have been renamed to TraceEvent* for consistency, since they also apply to classic and unparsed events (TraceEventHeaderFlags, TraceEventHeaderProperties and TraceEventType).
    • Trace statistics-related types are now in the Event namespace instead of the Metadata namespace.
    • StackEvent-related types are now in the Event namespace instead of the Symbols namespace.
    • Type has been replaced by TraceEvent.HeaderType.
    • EventProperty has been renamed to HeaderProperties.
    • Core extensibility types have been moved from the .Events namespace up to the Microsoft.Windows.EventTracing namespace.
    • Size has been renamed to Length for consistency.
    • WindowsTracePreprocessor has been renamed to TraceMessage for accuracy.
    • IsWindowsTracePreprocessor has been renamed to IsTraceMessage for accuracy.
  • Data Type Updates:
    • Most properties on IContextSwitch, IContextSwitchOut IContextSwitchIn have been made nullable for correctness.
    • uint Processor has been changed to int Processor on multiple types.
    • ID-like properties (for example, ProcessId and ThreadId) have been changed from uint to int for consistency with .NET.
    • UserStackRange is now nullable, and Base and Limit addresses have been swapped to match KernelStackRange ordering and actual Windows stack memory layout.
    • The type of RemainingQuantum on IContextSwitchOut has been changed from int? to long? due to observed data overflow.
    • Throughout the API, timestamp properties are now of type TraceTimestamp rather than Timestamp. (TraceTimestamp implicitly converts to Timestamp).
  • Cleanup:

    • ITraceTimestampContext has a new method (GetDateTimeOffset).
    • EventContext is now a ref struct instead of a class.
    • UserData is now of type ReadOnlySpan<byte> instead of IntPtr. The associated EventContext.UserDataLength has been removed; instead use EventContext.UserData.Length.
    • ExtendedData is now of type ExtendedDataItemReadOnlySpan, which is enumerable, rather than IReadOnlyList<ExtendedDataItem>.
    • TraceEvent has been split from EventContext and moved to EventContext.Event.
    • ICompletableEventConsumer has been replaced by ICompletable.
    • EventConsumerSchedule and IScheduledEventConsumer have been replaced by ConsumerSchedule and IScheduledConsumer.
    • Completion requests are no longer included in trace.Use(IEventConsumer) and require a separate call to trace.UseCompletion.
    • PendingResultAvailability has been merged into ConsumerSchedule.
    • UsePendingResult has been moved into an extension method.
    • PreparatoryPass and MainPass have been replaced with FirstPass and SecondPass.
    • WindowInFocus processing will no longer throw an exception when focus change events are missing.
    • Generic event field parsing exceptions will no longer be thrown during processing. Instead they are thrown on access to the Fields property of the IGenericEvent. GenericEventSettings.SuppressFieldParsingExceptions has been removed.
    • MarkHandled and MarkWarning have been removed.

New Data Exposed

  • Streaming window-in-focus data as well as parsed events are now available via trace.UseStreaming().
  • UseClassicEvents() now provides all classic events, not just unhandled ones.
  • Previously the very last ContextSwitch on each processor was omitted from IContextSwitchDataSource.ContextSwitches, as the information about the thread switching in at that time was not present. Now these context switches are included in the list with a null value for IContextSwitch.SwitchIn.
  • A new HypervisorPartitionDataSource has been added that exposes data about the Hyper-V partition the trace was recorded in.
  • TraceTimestamp now provides a .DateTimeOffset property to get the absolute (clock) time for a timestamp.
  • Streaming Last Branch Record (LBR) events are now available via trace.UseStreaming().
  • Streaming ready thread events are now available via trace.UseStreaming().
  • Streaming syscall data as well as parsed events are now available via trace.UseStreaming().
  • Streaming context switch data as well as parsed events (both standard and compact) are now available via trace.UseStreaming().
  • Streaming scheduled task data as well as parsed events are now available via trace.UseStreaming().
  • IContextSwitchOut now contains Rank (only present for the non-legacy implementation).
  • IContextSwitchIn now contains WaitTime (only present for the non-legacy implementation).
  • IScheduledTask now provides user information.
  • NuGet packages for individual namespaces are now available in addition to the .All packages.
  • Streaming thread events are now available via trace.UseStreaming().
  • IThread now provides BasePriority, IOPriority PagePriority, ProcessorAffinity and ServiceId.

Bug Fixes

  • Thread IDs used for syscalls are now taken from a reliable data source.
  • An access violation that could occur on program exit has been fixed.

Other

  • TraceTimestamp now implements IComparable, IEquatable and multiple comparison operators.
  • An event consumer can cancel future event delivery by calling EventContext.Cancel().
  • Scheduled tasks now support the remaining trigger types.

The post TraceProcessor 0.3.0 appeared first on Windows Developer Blog.

MSC Mediterranean Shipping Company on Azure Site Recovery

$
0
0

Today’s Q&A post covers an interview between Siddharth Deekshit, Program Manager, Microsoft Azure Site Recovery engineering and Quentin Drion, IT Director of Infrastructure and Operations, MSC. MSC is a global shipping and logistics business, our conversation focused on their organization’s journey with Azure Site Recovery (ASR). To learn more about achieving resilience in Azure, refer to this whitepaper.

I wanted to start by understanding the transformation journey that MSC is going through, including consolidating on Azure. Can you talk about how Azure is helping you run your business today?

We are a shipping line, so we move containers worldwide. Over the years, we have developed our own software to manage our core business. We have a different set of software for small, medium, and large entities, which were running on-premises. That meant we had to maintain a lot of on-premises resources to support all these business applications. A decision was taken a few years ago to consolidate all these business workloads inside Azure regardless of the size of the entity. When we are migrating, we turn off what we have on-premises and then start using software hosted in Azure and provide it as a service for our subsidiaries. This new design is managed in a centralized manner by an internal IT team.

That’s fantastic. Consolidation is a big benefit of using Azure. Apart from that, what other benefits do you see of moving to Azure?

For us, automation is a big one that is a huge improvement, the capabilities in terms of API in the integration and automation that we can have with Azure allows us to deploy environments in a matter of hours where before that it took much, much longer as we had to order the hardware, set it up, and then configure. Now we no longer need to worry about the set up as well as hardware support, and warranties. The environment is all virtualized and we can, of course, provide the same level of recovery point objective (RPO), recovery time objective (RTO), and security to all the entities that we have worldwide.

Speaking of RTO and RPO, let’s talk a little bit about Site Recovery. Can you tell me what life was like before using Site Recovery?

Actually, when we started migrating workloads, we had a much more traditional approach, in the sense that we were doing primary production workloads in one Azure region, and we were setting up and managing a complete disaster recovery infrastructure in another region. So the traditional on-premises data center approach was really how we started with disaster recovery (DR) on Azure, but then we spent the time to study what Site Recovery could provide us. Based on the findings and some testing that we performed, we decided to change the implementation that we had in place for two to three years and switch to Site Recovery, ultimately to reduce our cost significantly, since we no longer have to keep our DR Azure Virtual Machines running in another region. In terms of management, it's also easier for us. For traditional workloads, we have better RPO and RTO than we saw with our previous approach. So we’ve seen great benefits across the board.

That’s great to know. What were you most skeptical about when it came to using Site Recovery? You mentioned that your team ran tests, so what convinced you that Site Recovery was the right choice?

It was really based on the tests that we did. Earlier, we were doing a lot of manual work to switch to the DR region, to ensure that domain name system (DNS) settings and other networking settings were appropriate, so there were a lot of constraints. When we tested it compared to this manual way of doing things, Site Recovery worked like magic. The fact that our primary region could fail and that didn’t require us to do a lot was amazing. Our applications could start again in the DR region and we just had to manage the upper layer of the app to ensure that it started correctly. We were cautious about this app restart, not because of the Virtual Machine(s), because we were confident that Site Recovery would work, but because of our database engine. We were positively surprised to see how well Site Recovery works. All our teams were very happy about the solution and they are seeing the added value of moving to this kind of technology for them as operational teams, but also for us in management to be able to save money, because we reduced the number of Virtual Machines that we had that were actually not being used.

Can you talk to me a little bit about your onboarding experience with Site Recovery?

I think we had six or seven major in house developed applications in Azure at that time. We picked one of these applications as a candidate for testing. The test was successful. We then extended to a different set of applications that were in production. There were again no major issues. The only drawback we had was with some large disks. Initially, some of our larger disks were not supported. This was solved quickly and since then it has been, I would say, really straightforward. Based on the success of our testing, we worked to switch all the applications we have on the platform to use Site Recovery for disaster recovery.

Can you give me a sense of what workloads you are running on your Azure Virtual Machines today? How many people leverage the applications running on those Virtual Machines for their day job?

So it's really core business apps. There is, of course, the main infrastructure underneath, but what we serve is business applications that we have written internally, presented to Citrix frontend in Azure. These applications do container bookings, customer registrations, etc. I mean, we have different workloads associated with the complete process of shipping. In terms of users, we have some applications that are being used by more than 5,000 people, and more and more it’s becoming their primary day-to-day application.

Wow, that’s a ton of usage and I’m glad you trust Site Recovery for your DR needs. Can you tell me a little bit about the architecture of those workloads?

Most of them are Windows-based workloads. The software that gets the most used worldwide is a 3-tier application. We have a database on SQL, a middle-tier server, application server, and also some web frontend servers. But for the new one that we have developed now, it's based on microservices. There are also some Linux servers being used for specific usage.

Tell me more about your experience with Linux.

Site Recovery works like a charm with Linux workloads. We only had a few mistakes in the beginning, made on our side. We wanted to use a product from Red Hat called Satellite for updates, but we did not realize that we cannot change the way that the Virtual Machines are being managed if you want to use Satellite. It needs to be defined at the beginning otherwise it's too late. But besides this, the ‘bring your own license’ story works very well and especially with Site Recovery.

Glad to hear that you found it to be a seamless experience. Was there any other aspect of Site Recovery that impressed you, or that you think other organizations should know about?

For me, it's the capability to be able to perform drills in an easy way. With the more traditional approach, each time that you want to do a complete disaster recovery test, it's always time and resource-consuming in terms of preparation. With Site Recovery, we did a test a few weeks back on the complete environment and it was really easy to prepare. It was fast to do the switch to the recovery region, and just as easy to bring back the workload to the primary region. So, I mean for me today, it's really the ease of using Site Recovery.

If you had to do it all over again, what would you do differently on your Site Recovery Journey?

I would start to use it earlier. If we hadn’t gone with the traditional active-passive approach, I think we could have saved time and money for the company. On the other hand, we were in this way confident in the journey. Other than that, I think we wouldn’t have changed much. But what we want to do now, is start looking at Azure Site Recovery services to be able to replicate workloads running on on-premises Virtual Machines in Hyper-V. For those applications that are still not migrated to Azure, we want to at least ensure proper disaster recovery. We also want to replicate some VMware Virtual Machines that we still have as part of our migration journey to Hyper-V. This is what we are looking at.

Do you have any advice for folks for other prospective or current customers of Site Recovery?

One piece of advice that I could share is to suggest starting sooner and if required, smaller. Start using Site Recovery even if it's on one small app. It will help you see the added value, and that will help you convince the operational teams that there is a lot of value and that they can trust the services that Site Recovery is providing instead of trying to do everything on their own.

That’s excellent advice. Those were all my questions, Quentin. Thanks for sharing your experiences.

Learn more about resilience with Azure. 

Trying out Container Tools in Visual Studio 2019

$
0
0

I've been doing more and more work in Docker containers (rather than on the metal) and I noticed recently that Visual Studio 2019 added updated support for containers within VS itself so gave it a try.

When you make a new ASP.NET Core web app, make sure to check "enable docker support" when you click create.

Enable docker support

You'll need Docker for Windows first, of course. I'm using the new Docker Desktop for Windows that uses WSL2 for its backend rather than a utility VM that's visible in Hyper-V.

Now, within Visual Studio 2019, go to the View Menu and click "Other Windows | Containers." I like to dock this new tool window at the bottom.

Container Tool Window in Visual Studio 2019

Note in my screenshot above I'm starting up SQL Server on Linux within a container. This window is fantastic and includes basically everything you'd want to know and see when developing within a container.

You can see the ports exposed, the container's local file system, the environment, and the logs as they happen.

Docker Environment Variables

You can even right-click on a container and get a Terminal Window into that running container if you like:

Terminal in a running Container

You can also see https://aka.ms/containerfastmode to understand how Visual Studio uses your multistage Dockerfile (like the one below) to build your images for faster debugging.

FROM mcr.microsoft.com/dotnet/core/aspnet:3.1-buster-slim AS base

WORKDIR /app
EXPOSE 80
EXPOSE 443

FROM mcr.microsoft.com/dotnet/core/sdk:3.1-buster AS build
WORKDIR /src
COPY ["WebApplication1/WebApplication1.csproj", "WebApplication1/"]
RUN dotnet restore "WebApplication1/WebApplication1.csproj"
COPY . .
WORKDIR "/src/WebApplication1"
RUN dotnet build "WebApplication1.csproj" -c Release -o /app/build

FROM build AS publish
RUN dotnet publish "WebApplication1.csproj" -c Release -o /app/publish

FROM base AS final
WORKDIR /app
COPY --from=publish /app/publish .
ENTRYPOINT ["dotnet", "WebApplication1.dll"]

Go read about the new Container Tools in Visual Studio. Chances are you have a dockerfile in your project but you haven't brought this Containers Tool Window out to play!


Sponsor: Organizations that scan their code more than 300 times a year have 5x less security debt than those with sporadic testing processes. The 2019 SOSS X report from Veracode digs into this data—and more.


© 2019 Scott Hanselman. All rights reserved.
     

MSVC Backend Updates in Visual Studio 2019 Versions 16.3 and 16.4

$
0
0

Versions 16.3 and 16.4 of Visual Studio 2019 brought many new improvements in code generation quality, build throughput, and security. If you still haven’t downloaded your copy, here is a brief overview of what you’ve been missing out on.

GIF of MSVC Build Insights

Demonstration of C++ Build Insights, a new set of build analysis tools in Visual Studio 2019 version 16.4.

Visual Studio 2019 version 16.3

  • AVX-512 auto vectorizer support under the /arch:AVX512 switch, enabling logical, arithmetic, memory, and reduction vector operations targeting the AVX-512 instruction set.
  • Enhancements to the general inliner by estimating the values of both variables and memory. Enabled under /Ob3.
  • Improvements to inlining of small functions for faster build times and smarter inlining.
  • Partial ability to inline through indirect function calls
  • Dataflow-driven alias package added to the SSA Optimizer, enabling more powerful SSA-based optimizations
  • Improvements to the common sub-expression (CSE) optimization focused on eliminating more memory loads.
  • Compile-time computation of spaceship operator comparisons on string literals.
  • Automatic conversion of fma, fmal, fmaf, and std::fma to the intrinsic FMA implementation, when supported.
  • Optimized code generation when returning register-sized structs by using bit manipulations on registers instead of memory operations.
  • __iso_volatile_loadxx and __iso_volatile_storexx functions, which allow direct atomic read and write of aligned integer values.
  • Intrinsic versions of most AVX-512 functions that were previously implemented as macros.
  • Improvements to instruction selection for mm_shuffle and _mm_setps intrinsics under /arch:AVX2.
  • Enabling of FrameHandler4 (FH4) by default for the AMD64 platform.

Visual Studio 2019 version 16.4

  • Support for AddressSanitizer (ASAN), allowing the detection of memory safety issues at runtime.
  • C++ Build Insights, a new collection of tools for understanding and improving build times.
  • Significant improvements to code generation time by using up to 24 threads instead of 4, depending on available CPU cores.
  • Further improvements to code generation time through better algorithms and data structures used by the compiler.
  • Introduction of a new /d2ReducedOptimizeHugeFunctions compiler option to improve the code generation time by omitting expensive optimizations for functions with more than 20,000 instructions. This threshold can be customized by using the /d2ReducedOptimizeThreshold:# switch.
  • Improvements to the AVX-512 auto vectorizer, supporting more instruction forms: variable width compares, int32 multiplication, int-to-fp floating point conversion. Available under /arch:AVX512.
  • Improved analysis of control flow to better determine when values are provably positive or negative.
  • Enabling of the enhanced inliner introduced in 16.3 by default, without the use of /Ob3.
  • Intrinsic support for the ENQCMD and ENQCMDS instructions, which write commands to enqueue registers.
  • Intrinsic support for the RDPKRU and WRPKRU instructions, which read and write the PKRU register available in some Intel processors.
  • Intrinsic support for the VP2INTERSECTD and VP2INTERSECTQ instructions, which generate a pair of masks indicating which elements of one vector match elements of another vector.

Do you want to benefit from all of these improvements? If so, download the latest Visual Studio 2019 and tell us what you think! We can be reached via the comments below, via email at visualcpp@microsoft.com, or via Twitter (@VisualC).

The post MSVC Backend Updates in Visual Studio 2019 Versions 16.3 and 16.4 appeared first on C++ Team Blog.

10 recommendations for cloud privacy and security with Ponemon research

$
0
0

Today we’re pleased to publish Data Protection and Privacy Compliance in the Cloud: Privacy Concerns Are Not Slowing the Adoption of Cloud Services, but Challenges Remain, original research sponsored by Microsoft and independently conducted by the Ponemon Institute. The report concludes with a list of 10 recommended steps that organizations can take to address cloud privacy and security concerns, and in this blog, we have provided information about Azure services such as Azure Active Directory and Azure Key Vault that help address all 10 recommendations.

The research was undertaken to better understand how organizations undergo digital transformation while wrestling with the organizational impact of complying with such significant privacy regulations as the European Union’s General Data Protection Regulation (GDPR). The research explored the reasons organizations are migrating to the cloud, the security and privacy challenges they encounter in the cloud, and the steps they have taken to protect sensitive data and achieve compliance.

The survey of over 1,000 IT professionals in the US and EU found that privacy concerns are not slowing cloud adoption and that most privacy-related activities are easier in the cloud, while at the same time, most organizations don’t feel they have control and visibility they need to manage online privacy.  The report lists ten steps organizations can take to improve security and privacy.
 

Download Data Protection and Privacy Compliance in the Cloud


Key takeaways from the research include:

  • Privacy concerns are not slowing the adoption of cloud services, as only one-third of US respondents and 38 percent of EU respondents say privacy issues have stopped or slowed their adoption of cloud services. The importance of the cloud in reducing costs and speeding time to market seem to override privacy concerns.
  • Most privacy-related activities are easier to deploy in the cloud. These include governance practices such as conducting privacy impact assessments, classifying or tagging personal data for sensitivity or confidentiality, and meeting legal obligations, such as those of the GDPR. However, other items such as managing incident response are considered easier to deploy on premises than in the cloud.
  • 53 percent of US and 60 percent of EU respondents are not confident that their organization currently meets their privacy and data protection requirements. This lack of confidence may be because most organizations are not vetting cloud-based software for privacy and data security requirements prior to deployment.
  • Organizations are reactive and not proactive in protecting sensitive data in the cloud. Specifically, just 44 percent of respondents are vetting cloud-based software or platforms for privacy and data security risks, and only 39 percent are identifying information that is too sensitive to be stored in the cloud.
  • Just 29 percent of respondents say their organizations have the necessary 360-degree visibility into the sensitive or confidential data collected, processed, or stored in the cloud. Organizations also lack confidence that they know all the cloud applications and platforms that they have deployed.

The Ponemon report closes with a list of recommended steps that organizations can take to address cloud privacy and security concerns, annotated below with relevant Azure services that can help you implement each of the recommendations:

  1. Improve visibility into the organization’s sensitive or confidential data collected, processed, or stored in the cloud environment. 
    Azure service: Azure Information Protection helps discover, classify, and control sensitive data. Learn more.
  2. Educate themselves about all the cloud applications and platforms already in use in the organization.
    Azure service: Microsoft Cloud App Security helps discover and control the use of shadow IT by identifying cloud apps, infrastructure as a service (IaaS), and platform as a service (PaaS) services. Learn more.
  3. Simplify the authentication of users in both on-premises and cloud environments.
    Azure service: Azure Active Directory provides tools to manage and deploy single sign-on authentication for both cloud and on-prem services. Learn more.
  4. Ensure the cloud provider offers event monitoring of suspicious and anomalous traffic in the cloud environment.
    Azure service: Azure Monitor enables customers to collect, analyze, and act on telemetry data from both Azure and on-premises environments. Learn more.
  5. Implement the capability to encrypt sensitive and confidential data in motion and at rest.
    Azure service: Azure offers a variety of options for encrypting both data at rest and in transit. Learn more.
  6. Make sure that the organization uses and manages its own encryption keys (BYOK).
    Azure service: Azure Key Vault allow you to import or generate keys in hardware security modules (HSMs) that never leave the HSM boundary. Learn more.
  7. Implement multifactor authentication before allowing access to the organization’s data and applications in the cloud environment.
    Azure service: Azure Active Directory offers multiple options for deploying multifactor authentication for both cloud and on-prem services. Learn more.
  8. Assign responsibility for ensuring compliance with privacy and data protection regulations and security safeguards in the cloud to those most knowledgeable: the compliance and IT security teams. Privacy and data protection teams should also be involved in evaluating any cloud applications or platforms under consideration.
    Azure service: Role-based access control (RBAC) helps manage who has access to Azure resources, what they can do with those resources, and what areas they have access to. Learn more.
  9. Identify information that is too sensitive to be stored in the cloud and assess the impact that cloud services may have on the ability to protect and secure confidential or sensitive information.
    Azure service: Azure Information Protection helps discover, classify, and control sensitive data. Learn more.
  10. Thoroughly evaluate cloud-based software and platforms for privacy and security risks.
    Azure service: Microsoft Cloud App Security Assess the risk levels and business readiness of over 16,000 apps. Learn more.

Read the full report to learn more.

Improve Parallelism in MSBuild

$
0
0

Starting in Visual Studio 2019 16.3 we have been adding features to improve build parallelism. These features are still experimental, so they are off by default. When developing tools for Android, we introduced clang/gcc to the MSBuild platform. Clang/gcc relied on the parallelism model of the build system but MSBuild only parallelizes at the project level. This led to the creation of Multi-ToolTask (MTT) as a MSBuild Task. It forgoes MSBuild batching system and works around the typical single task limitations. This allows tasks to execution in parallel and engage other scheduling features not present in MSBuild. In this release, we leveraging MTT to the some of the existing Vcxproj build tasks, making existing tasks more parallel and in return improving build throughput.

Getting Started

MTT can be “opt-in” by setting the MSBuild property or environment variable UseMultiToolTask to true. Its usage should be transparent during day-to-day-developer workflow and it fully supports incremental builds in the IDE and on the command line, even when toggling MTT on and off. To set properties, you can set them as environment variables or follow the instructions in Customize your build. For the best effect, apply these properties to all projects within a solution.

Why Use MTT?

When enabled, the MTT uses its built-in scheduler, which enables some features to control its throughput. By setting property EnforceProcessCountAcrossBuilds to true, this will limit the max number of process used by MTT across multiple projects and MSBuild instances. This feature should help to combat slowdown and memory bounds brought on by over-subscription. For extra control, use the MultiProcMaxCount or CL_MPCount properties to define the max number of jobs. CL_MPCount property is set by the IDE (Tools > Options > Projects and Solutions > Maximum Concurrent C++ Compilations). By default, MultiProcMaxCount and CL_MPCount value are equal to the number of CPU logical processors.

Lastly, setting the metadata MultiToolTaskDependency on an item will create a dependency on another item in the same MTT instance. For example, in our project system, we build .cpp source files to generate PCH first and then build their consumer. In MTT, it is possible to describe this dependency and the scheduler will handle the order. With the dependency description, it allows .cpp without dependency on the PCH to run without waiting, opening more parallelism opportunities.

Performance gains will vary between sources base. Kevin wrote this blog to use xperf to measure your performence.  In this release, MTT is only coded to parallelize MIDL, CL, Clang, and FXC (hlsl).  If your project is using Custom Build Tools, then enable Parallel Custom Build Tools with a few clicks.  If there are other tools that you think could benefit, send us feedback.

Send Us Feedback

The feature is still experimental, and so we are still looking for ways to improve it. Tell us what your experience was or suggest ways to improve the system. Our focus is correctness, incrementality, and scalability. Leave your comments below or email us visualcpp@microsoft.com.


The post Improve Parallelism in MSBuild appeared first on C++ Team Blog.


Blazor WebAssembly 3.2.0 Preview 1 release now available

$
0
0

Today we released a new preview update for Blazor WebAssembly with a bunch of great new features and improvements.

Here’s what’s new in this release:

  • Version updated to 3.2
  • Simplified startup
  • Download size improvements
  • Support for .NET SignalR client

Get started

To get started with Blazor WebAssembly 3.2.0 Preview 1 install the .NET Core 3.1 SDK and then run the following command:

dotnet new -i Microsoft.AspNetCore.Blazor.Templates::3.2.0-preview1.20073.1

That’s it! You can find additional docs and samples on https://blazor.net.

Upgrade an existing project

To upgrade an existing Blazor WebAssembly app from 3.1.0 Preview 4 to 3.2.0 Preview 1:

  • Update all Microsoft.AspNetCore.Blazor.* package references to 3.2.0-preview1.20073.1.
  • In Program.cs in the Blazor WebAssembly client project replace BlazorWebAssemblyHost.CreateDefaultBuilder() with WebAssemblyHostBuilder.CreateDefault().
  • Move the root component registrations in the Blazor WebAssembly client project from Startup.Configure to Program.cs by calling builder.RootComponents.Add<TComponent>(string selector).
  • Move the configured services in the Blazor WebAssembly client project from Startup.ConfigureServices to Program.cs by adding services to the builder.Services collection.
  • Remove Startup.cs from the Blazor WebAssembly client project.
  • If you’re hosting Blazor WebAssembly with ASP.NET Core, in your Server project replace the call to app.UseClientSideBlazorFiles<Client.Startup>(...) with app.UseClientSideBlazorFiles<Client.Program>(...).

Version updated to 3.2

In this release we updated the versions of the Blazor WebAssembly packages to 3.2 to distinguish them from the recent .NET Core 3.1 Long Term Support (LTS) release. There is no corresponding .NET Core 3.2 release – the new 3.2 version applies only to Blazor WebAssembly. Blazor WebAssembly is currently based on .NET Core 3.1, but it doesn’t inherit the .NET Core 3.1 LTS status. Instead, the initial release of Blazor WebAssembly scheduled for May of this year will be a Current release, which “are supported for three months after a subsequent Current or LTS release” as described in the .NET Core support policy. The next planned release for Blazor WebAssembly after the 3.2 release in May will be with .NET 5. This means that once .NET 5 ships you’ll need to update your Blazor WebAssembly apps to .NET 5 to stay in support.

Simplified startup

We’ve simplified the startup and hosting APIs for Blazor WebAssembly in this release. Originally the startup and hosting APIs for Blazor WebAssembly were designed to mirror the patterns used by ASP.NET Core, but not all of the concepts were relevant. The updated APIs also enable some new scenarios.

Here’s what the new startup code in Program.cs looks like:

public class Program
{
    public static async Task Main(string[] args)
    {
        var builder = WebAssemblyHostBuilder.CreateDefault(args);
        builder.RootComponents.Add<App>("app");

        await builder.Build().RunAsync();
    }
}

Blazor WebAssembly apps now support async Main methods for the app entry point.

To a create a default host builder, call WebAssemblyHostBuilder.CreateDefault(). Root components and services are configured using the builder; a separate Startup class is no longer needed.

The following example adds a WeatherService so it’s available through dependency injection (DI):

public class Program
{
    public static async Task Main(string[] args)
    {
        var builder = WebAssemblyHostBuilder.CreateDefault(args);
        builder.Services.AddSingleton<WeatherService>();
        builder.RootComponents.Add<App>("app");

        await builder.Build().RunAsync();
    }
}

Once the host is built, you can access services from the root DI scope before any components have been rendered. This can be useful if you need to run some initialization logic before anything is rendered:

public class Program
{
    public static async Task Main(string[] args)
    {
        var builder = WebAssemblyHostBuilder.CreateDefault(args);
        builder.Services.AddSingleton<WeatherService>();
        builder.RootComponents.Add<App>("app");

        var host = builder.Build();

        var weatherService = host.Services.GetRequiredService<WeatherService>();
        await weatherService.InitializeWeatherAsync();

        await host.RunAsync();
    }
}

The host also now provides a central configuration instance for the app. The configuration isn’t populated with any data by default, but you can populate it as required in your app.

public class Program
{
    public static async Task Main(string[] args)
    {
        var builder = WebAssemblyHostBuilder.CreateDefault(args);
        builder.Services.AddSingleton<WeatherService>();
        builder.RootComponents.Add<App>("app");

        var host = builder.Build();

        var weatherService = host.Services.GetRequiredService<WeatherService>();
        await weatherService.InitializeWeatherAsync(host.Configuration["WeatherServiceUrl"]);

        await host.RunAsync();
    }
}

Download size improvements

Blazor WebAssembly apps run the .NET IL linker on every build to trim unused code from the app. In previous releases only the core framework libraries were trimmed. Starting with this release the Blazor framework assemblies are trimmed as well resulting in a modest size reduction of about 100 KB transferred. As before, if you ever need to turn off linking, add the <BlazorLinkOnBuild>false</BlazorLinkOnBuild> property to your project file.

Support for the .NET SignalR client

You can now use SignalR from your Blazor WebAssembly apps using the .NET SignalR client.

To give SignalR a try from your Blazor WebAssembly app:

  1. Create an ASP.NET Core hosted Blazor WebAssembly app.

    dotnet new blazorwasm -ho -o BlazorSignalRApp
    
  2. Add the ASP.NET Core SignalR Client package to the Client project.

    cd BlazorSignalRApp
    dotnet add Client package Microsoft.AspNetCore.SignalR.Client
    
  3. In the Server project, add the following Hub/ChatHub.cs class.

    using System.Threading.Tasks;
    using Microsoft.AspNetCore.SignalR;
    
    namespace BlazorSignalRApp.Server.Hubs
    {
        public class ChatHub : Hub
        {
            public async Task SendMessage(string user, string message)
            {
                await Clients.All.SendAsync("ReceiveMessage", user, message);
            }
        }
    }
    
  4. In the Server project, add the SignalR services in the Startup.ConfigureServices method.

    services.AddSignalR();
    
  5. Also add an endpoint for the ChatHub in Startup.Configure.

    .UseEndpoints(endpoints =>
    {
        endpoints.MapDefaultControllerRoute();
        endpoints.MapHub<ChatHub>("/chatHub");
        endpoints.MapFallbackToClientSideBlazor<Client.Program>("index.html");
    });
    
  6. Update Pages/Index.razor in the Client project with the following markup.

    @using Microsoft.AspNetCore.SignalR.Client
    @page "/"
    @inject NavigationManager NavigationManager
    
    <div>
        <label for="userInput">User:</label>
        <input id="userInput" @bind="userInput" />
    </div>
    <div class="form-group">
        <label for="messageInput">Message:</label>
        <input id="messageInput" @bind="messageInput" />
    </div>
    <button @onclick="Send" disabled="@(!IsConnected)">Send Message</button>
    
    <hr />
    
    <ul id="messagesList">
        @foreach (var message in messages)
        {
            <li>@message</li>
        }
    </ul>
    
    @code {
        HubConnection hubConnection;
        List<string> messages = new List<string>();
        string userInput;
        string messageInput;
    
        protected override async Task OnInitializedAsync()
        {
            hubConnection = new HubConnectionBuilder()
                .WithUrl(NavigationManager.ToAbsoluteUri("/chatHub"))
                .Build();
    
            hubConnection.On<string, string>("ReceiveMessage", (user, message) =>
            {
                var encodedMsg = user + " says " + message;
                messages.Add(encodedMsg);
                StateHasChanged();
            });
    
            await hubConnection.StartAsync();
        }
    
        Task Send() => hubConnection.SendAsync("SendMessage", userInput, messageInput);
    
        public bool IsConnected => hubConnection.State == HubConnectionState.Connected;
    }
    
  7. Build and run the Server project

    cd Server
    dotnet run
    
  8. Open the app in two separate browser tabs to chat in real time over SignalR.

Known issues

Below is the list of known issues with this release that will get addressed in a future update.

  • Running a new ASP.NET Core hosted Blazor WebAssembly app from the command-line results in the warning: CSC : warning CS8034: Unable to load Analyzer assembly C:Usersuser.nugetpackagesmicrosoft.aspnetcore.components.analyzers3.1.0analyzersdotnetcsMicrosoft.AspNetCore.Components.Analyzers.dll : Assembly with same name is already loaded.

    • Workaround: This warning can be ignored or suppressed using the <DisableImplicitComponentsAnalyzers>true</DisableImplicitComponentsAnalyzers> MSBuild property.

Feedback

We hope you enjoy the new features in this preview release of Blazor WebAssembly! Please let us know what you think by filing issues on GitHub.

Thanks for trying out Blazor!

The post Blazor WebAssembly 3.2.0 Preview 1 release now available appeared first on ASP.NET Blog.

Visual Studio 2019 for Mac version 8.5 Preview 2 is available

$
0
0

Visual Studio 2019 for Mac 8.5 Preview 2 is ready to download today! The latest preview of Visual Studio for Mac adds a handful of neat features and fixes that were direct requests from our users such as:

  • Authentication templates for ASP.NET Core projects
  • Enhancements in Xamarin for Android and XAML
  • Refinements to accessibility that include a new color palette, refreshed icons, and high contrast mode support

Add authentication to your ASP.NET Core projects

One of the most requested features from our ASP.NET Core developers has been the ability to create ASP.NET Core projects with authentication. With this release of Visual Studio for Mac, you can now create ASP.NET Core projects with either No Authentication or Individual Authentication that uses an In-App store (which is the most used auth option). When you create a new ASP.NET Core project that supports one of these auth methods, you’ll find an additional dropdown in the project creation flow. Whether you’re a seasoned ASP.NET Core developer or developing your first app, we encourage you to try out this newly added feature. As always, please reach out to us if you have any feedback using this new feature.

A screenshot of a cell phone Description automatically generated

Develop mobile apps more efficiently with improvements to Xamarin

Visual Studio 2019 for Mac version 8.5 Preview 2 is full of improvements for mobile developers that help you build better mobile apps, faster including:

  • Android Apply Changes: Quickly see changes made to your Android resource files, such as layouts, drawables, etc., on an Android device or emulator without requiring the application to be restarted.
  • Multi-Target Reload for XAML Hot Reload: Reload changes made to your XAML instantly on multiple targets (such as an iOS Simulator and Android emulator) at the same time for rapid UI iteration.
  • XAML Document Outline: See the hierarchy of your Xamarin.Forms UI in the “Document Outline” pane.
  • Improved Xcode Storyboard Designer Integration: Add the ability to set your default iOS designer in Visual Studio for Mac, enabling you to use the tools that make you most productive for authoring iOS UIs.

For a complete overview of what’s new for mobile developers in this release, check out the Xamarin blog.


Experience a more accessible user interface

We’ve continued to improve the overall accessibility of Visual Studio for Mac. We updated the color palette and icons, as well as warning and error status messages, have been refreshed. We’ve also increased color contrast ratios for text and icons to enhance clarity. We made these changes to make it easier for users with visual impairments to receive feedback from the user interface. We know that improving the accessibility of Visual Studio for Mac is a long journey and that we still have much work ahead of us. We’d appreciate any feedback on any of the changes we’ve made here, or recently with regards to accessibility.

Visual Studio for Mac supports macOS High Contrast Mode

On macOS, you can increase the color contrast of the entire system by turning on High Contrast Mode via the Increase Contrast checkbox in System Preferences > Accessibility Preferences. Visual Studio 2019 for Mac version 8.5 Preview 2 fully supports High Contrast Mode.

An updated color palette increases visibility

We replaced the previous color palette with a new palette to fix several issues with color contrast. The difference between the old and new color palette is illustrated below:

A picture containing building, computer, indoor, table Description automatically generated

The new palette improves upon the old one, fixes the issues, and brings with it better semantic meaning.

Icons have been reviewed, redrawn, and adjusted for additional clarity

Visual Studio for Mac has always contained many icons in different flavors for color theme and selected states. Every icon has been individually verified for accessibility issues, converted to the new palette, duplicated, and repainted using the new high contrast palette. We’ve improved all our existing icons in addition to introducing new high contrast icons. Some of these icons needed to be redrawn or modified in other ways as they had previously used color alone to show differences in state.

Warning and error colors have been refreshed

We also changed the colors of warning and error related messages shown by Visual Studio for Mac to enhance readability.

A screenshot of a cell phone Description automatically generated

We now have new colors for error popovers, with better appearance when in high contrast mode, too.

A screenshot of a cell phone Description automatically generated

In the next few days, we’ll publishing another article with more details on these changes. Stay tuned!


Try the latest preview today!

If you’ve made it this far, you’ve probably read about all the improvements in Visual Studio for Mac version 8.5 Preview 2. Now it’s time to install it on your Mac! To try the latest preview of Visual Studio for Mac, make sure you’ve downloaded and installed Visual Studio 2019 for Mac, then switch to the Preview channel.

As always, if you have any feedback on this, or any, version of Visual Studio for Mac, we invite you to leave them in the comments below this post or to reach out to us on Twitter at @VisualStudioMac. If you run into issues while using Visual Studio for Mac, you can use Report a Problem to notify the team. In addition to product issues, we also welcome your feature suggestions on the Visual Studio Developer Community website.

We hope you enjoy using Visual Studio 2019 for Mac Preview 2 as much as we enjoyed working on it!


The post Visual Studio 2019 for Mac version 8.5 Preview 2 is available appeared first on Visual Studio Blog.

Hyperledger Fabric on Azure Kubernetes Service Marketplace template

$
0
0

Customers exploring blockchain for their applications and solutions typically start with a prototype or proof of concept effort with a blockchain technology before they get to build, pilot, and production rollout. During the latter stages, apart from the ease of deployment, there is an expectation of flexibility in the configuration in terms of the number of blockchain members in the consortium, size and number of nodes and ease in management post-deployment.

We are sharing the release of a new Hyperledger Fabric on Azure Kubernetes Service marketplace template in preview. Any user with minimal knowledge of Azure or Hyperledger Fabric can now set up a blockchain consortium on Azure using this solution template by providing few basic input parameters.

This template helps the customers to deploy Hyperledger Fabric (HLF) network on Azure Kubernetes Service (AKS) clusters in a modular manner, that meets the much-required customization with regard to the choice of Microsoft Azure Virtual Machine series, number of nodes, fault-tolerance, etc. Azure Kubernetes Service provides enterprise-grade security and governance, making the deployment and management of containerized application easy. Customers anticipate leveraging the native Kubernetes tools for the management plane operations of the infrastructure and call Hyperledger Fabric APIs or Hyperledger Fabric client software development kit for the data plane workflows.

The template has various configurable parameters that make it suitable for production-grade deployment of Hyperledger Fabric network components.

Top features of Hyperledger Fabric on Azure Kubernetes Service template are:

  • Supports deployment of Hyperledger Fabric version 1.4.4 (LTS).
  • Supports deployment of orderer organization and peer nodes with the option to configure the number of nodes.
  • Supports Fabric Certificate Authority (CA) with self-signed certificates by default, and an option to upload organization-specific root certificates to initialize the Fabric CA.
  • Supports running of LevelDb and CouchDB for world state database on peer nodes.
  • Ordering service runs highly available RAFT based consensus algorithm, with an option to choose 3,5, or 7 nodes.  
  • Supports ways to configure in terms of number and size of the nodes of Azure Kubernetes Clusters.
  • Public IP exposed for each AKS cluster deployed for networking with other organizations
  • Enables you to jump start with building your network sample scripts to help post-deployment steps such as create workflows of consortiums and channels, adding peer nodes to the channel, etc.
  • Node.js application sample to support running a few native Hyperledger Fabric APIs such as new user identity generation, running custom chain code, etc.

To know more about how to get started with deploying Hyperledger Fabric network components, refer to the documentation.

What's coming next

  • Microsoft Visual Studio code extension support for Azure Hyperledger Fabric instances

What more do we have for you? The template and consortium sample scripts are open-sourced in the GitHub repo, so the community can leverage to build their customized versions.

What’s New in Visual Studio 2019 version 16.5 Preview 2 for C++, Xamarin, and Azure Tooling Experiences

$
0
0

Last week, Visual Studio 2019 version 16.5 Preview 2 was released, bringing many new features and improvements for developers in Visual Studio to help you build better software faster. Please read some highlights of new features and improved developer experiences in this page.

Install this preview side-by-side with your Visual Studio release and try these highlighted features without replacing your current development environment.

C++ CMake Development

This preview comes with several improvements specific to CMake development, including CMake language services and the ability to easily add, remove, and rename files in CMake projects. Our in-box support for Clang/LLVM in Visual Studio has also been updated to ship Clang 9.0.0.

There are also improvements specific to Linux CMake development in this preview. Ability to leverage our native support for WSL when separating your build system from your remote deploy system. A command line utility to interact with the Connection Manager, and as well as performance improvements. For a full list of new CMake features in Visual Studio 2019 version 16.5 Preview 2, check out our post on CMake, Linux targeting, and IntelliSense improvements in Visual Studio 2019 version 16.5 Preview 2.

Xamarin Development

This preview brings new features and improvements for Xamarin developers to help you build better mobile apps, faster. Xamarin Hot Restart enables you to test changes made to your app, including multi-file code edits, resources, and references using a much faster build and deploy cycle. With Hot Restart, you can debug your iOS app built with Xamarin.Forms on a device connected to your Windows machine for a much faster inner development loop.

This release also adds support for Android Apply Changes. You can now apply Android resource changes at runtime. This allows you to quickly see changes made to your Android resource files (XML layouts, drawable, etc.) on an Android device or emulator without requiring the application to be restarted.

Azure Tooling Development

Azure Functions 3.0 is now generally available, so it’s now possible to build and deploy functions with the 3.0 runtime version in production. This new version of the Functions runtime brings new capabilities including the ability to target .NET Core 3.1 and Node 12. It’s also highly backwards compatible, so most existing apps running on older language versions should be able to upgrade to the 3.0 version and run on it without any code changes. Running on this new version of the runtime in production will receive support for those apps. For details on creating or migrating to this production-ready 3.0 version, read the Azure Functions documentation.

Applications running on earlier versions of the Azure Functions runtime will continue to be supported and we’re not deprecating either 1.0 or 2.0 at this time. Customers running Azure Functions targeting 1.0 or 2.0 will also continue to receive security updates and patches moving forward—to both the Azure Functions runtime and the underlying .NET runtime—for apps running in Azure. Whenever there’s a major version deprecation, we plan to provide notice at least a year in advance for users to migrate their apps to a newer version.

In order to get the latest tooling for Azure functions VS, please install Visual Studio 2019 version 16.5 Preview 2.

C++ Unreal Engine Development

In this preview, there have been many significant improvements to IDE productivity, as well as build throughput and code generation quality. Please see our team posts on Quick fixes, quick info, peek header, goto document, Enhanced Syntax Colorization, Template Argument Filtering, and IntelliCode, and C++ Toolset Game performance improvements.
We would like your feedback on your C++ Unreal Engine development experience in Visual Studio 2019 version 16.5 Preview 2.

Microsoft is directly driven by your feedback, which means Visual Studio 2019 is full of features that were inspired by YOU! Make your voice heard by filing bug reports or sharing feature suggestions on Developer Community.

The post What’s New in Visual Studio 2019 version 16.5 Preview 2 for C++, Xamarin, and Azure Tooling Experiences appeared first on Visual Studio Blog.

Empower Firstline Workers and supercharge search—here’s what’s new to Microsoft 365

Viewing all 5971 articles
Browse latest View live


<script src="https://jsc.adskeeper.com/r/s/rssing.com.1596347.js" async> </script>