XLOOKUP in Excel is generally available to all users on Windows, Mac, and Excel on the web today!
The post Find what you need faster with XLOOKUP—now generally available appeared first on Microsoft 365 Blog.
XLOOKUP in Excel is generally available to all users on Windows, Mac, and Excel on the web today!
The post Find what you need faster with XLOOKUP—now generally available appeared first on Microsoft 365 Blog.
I’m delighted to share an update of Experimental Mobile Blazor Bindings with several new features and fixes. On January 14th we announced the first experimental release of Mobile Blazor Bindings, which enables developers to use familiar web programming patterns to build native mobile apps using C# and .NET for iOS and Android.
Here’s what’s new in this release:
To get started with Experimental Mobile Blazor Bindings preview 2, install the .NET Core 3.1 SDK and then run the following command:
dotnet new -i Microsoft.MobileBlazorBindings.Templates::0.2.42-preview
And then create your first project by running this command:
dotnet new mobileblazorbindings -o MyApp
That’s it! You can find additional docs and tutorials on https://docs.microsoft.com/mobile-blazor-bindings/.
To update an existing Mobile Blazor Bindings Preview 1 project to Preview 2 you’ll need to update the Mobile Blazor Bindings NuGet packages to 0.2.42-preview. In each project file (.csproj) update the Microsoft.MobileBlazorBindings package reference’s Version attribute to 0.2.42-preview.
Refer to the Migrate Mobile Blazor Bindings From Preview 1 to Preview 2 topic for full details.
New BoxView, CheckBox, ImageButton, ProgressBar, and Slider components have been added. A picture is worth a thousand words, so here are the new components in action:
And instead of a thousand words, here’s the code for that UI page:
<Frame CornerRadius="10" BackgroundColor="Color.LightBlue">

    <StackLayout>

        <Label Text="How much progress have you made?" />
        <Slider @bind-Value="progress" />

        <Label Text="Your impact:" />
        <ProgressBar Progress="EffectiveProgress" />

        <StackLayout Orientation="StackOrientation.Horizontal">
            <CheckBox @bind-IsChecked="isTwoXProgress" VerticalOptions="LayoutOptions.Center" />
            <Label Text="Use 2x impact?" VerticalOptions="LayoutOptions.Center" />
        </StackLayout>

        <BoxView HeightRequest="20" CornerRadius="5" Color="Color.Purple" />

        <StackLayout Orientation="StackOrientation.Horizontal" VerticalOptions="LayoutOptions.Center">
            <Label Text="Instant completion" VerticalOptions="LayoutOptions.Center" />
            <ImageButton Source="@(new FileImageSource { File="CompleteButton.png" })"
                         HeightRequest="64" WidthRequest="64"
                         OnClick="CompleteProgress"
                         VerticalOptions="LayoutOptions.Center"
                         BorderColor="Color.SaddleBrown" BorderWidth="3" />
        </StackLayout>

    </StackLayout>

</Frame>

@code
{
    double progress;
    bool isTwoXProgress;
    double EffectiveProgress => isTwoXProgress ? 2d * progress : progress;

    void CompleteProgress()
    {
        progress = 1d;
    }
}
Xamarin.Essentials provides developers with cross-platform APIs for their mobile applications. With these APIs you can make cross-platform calls to get geolocation info, get device status and capabilities, access the clipboard, and much more.
Here’s how to get battery status and location information:
<StackLayout>
    <StackLayout Orientation="StackOrientation.Horizontal">
        <ProgressBar Progress="Battery.ChargeLevel" HeightRequest="20" HorizontalOptions="LayoutOptions.FillAndExpand" />
        <Label Text="@($"{Battery.ChargeLevel.ToString("P")}")" />
    </StackLayout>

    <Label Text="@($"🔋 state: {Battery.State.ToString()}")" />
    <Label Text="@($"🔋 source: {Battery.PowerSource.ToString()}")" />

    <Button Text="Where am I?" OnClick="@WhereAmI" />
</StackLayout>

@code
{
    async Task WhereAmI()
    {
        var location = await Geolocation.GetLocationAsync(new GeolocationRequest(GeolocationAccuracy.Medium));

        var locationMessage = $"Lat: {location.Latitude}, Long: {location.Longitude}, Alt: {location.Altitude}";
        await Application.Current.MainPage.DisplayAlert("Found me!", locationMessage, "OK");
    }
}
More information:
The set of properties available on the default components in Mobile Blazor Bindings now match the Xamarin.Forms UI controls more closely.
For example:
While most UI work is done directly with the Blazor components, some UI functionality is performed by accessing the Xamarin.Forms control. For example, Xamarin.Forms controls have rich animation capabilities that can be accessed via the control itself, such as rotation, fading, scaling, and translation.
To access the Xamarin.Forms element you need to:
Microsoft.MobileBlazorBindings.Elements.Label counterLabel;<label @ref="counterLabel" …></label>NativeControl property. For example: await counterLabel.NativeControl.RelRotateTo(360);Here’s a full example of how to do a rotation animation every time a button is clicked:
<StackLayout Orientation="StackOrientation.Horizontal" HorizontalOptions="LayoutOptions.Center">

    <Button Text="Increment" OnClick="IncrementCount" />

    <Label @ref="counterLabel"
            Text="@("The button was clicked " + count + " times")"
            FontAttributes="FontAttributes.Bold"
            VerticalTextAlignment="TextAlignment.Center" />

</StackLayout>

@code
{
    Microsoft.MobileBlazorBindings.Elements.Label counterLabel;

    int count;

    async Task IncrementCount()
    {
        count++;
        var degreesToRotate = ((double)(60 * count));
        await counterLabel.NativeControl.RelRotateTo(degreesToRotate);
    }
}
Learn more in the Xamarin.Forms animation topic.
This release incorporates several bug fixes, including fixing an iOS startup issue. You can see the full list of fixes in this GitHub query.
In case you’ve missed some content on Mobile Blazor Bindings, please check out these recent happenings:
I also want to extend a huge thank you to the community members who came over to the GitHub repo and logged issues and sent some wonderful pull requests (several of which are merged and in this release).
This release includes these community code contributions:
Thank you!
We’re listening to your feedback, which has been both plentiful and helpful! We’re also fixing bugs and adding new features. Improved CSS support and inline text are two things we’d love to make available soon.
This project will continue to take shape in large part due to your feedback, so please let us know your thoughts at the GitHub repo or fill out the feedback survey.
The post Announcing Experimental Mobile Blazor Bindings February update appeared first on ASP.NET Blog.
At Spark + AI Summit in May 2019, we released .NET for Apache Spark. .NET for Apache Spark is aimed at making Apache® Spark , and thus the exciting world of big data analytics, accessible to .NET developers.
.NET for Spark can be used for processing batches of data, real-time streams, machine learning, and ad-hoc query. In this blog post, we’ll explore how to use .NET for Spark to perform a very popular big data task known as log analysis.
The remainder of this post describes the following topics:
Log analysis, also known as log processing, is the process of analyzing computer-generated records called logs. Logs tell us what’s happening on a tool like a computer or web server, such as what applications are being used or the top websites users visit.
The goal of log analysis is to gain meaningful insights from these logs about activity and performance of our tools or services. .NET for Spark enables us to analyze anywhere from megabytes to petabytes of log data with blazing fast and efficient processing!
In this blog post, we’ll be analyzing a set of Apache log entries that express how users are interacting with content on a web server. You can view a sample of Apache log entries here.
Log analysis is an example of batch processing with Spark. Batch processing is the transformation of data at rest, meaning that the source data has already been loaded into data storage. In our case, the input text file is already populated with logs and won’t be receiving new or updated logs as we process it.
When creating a new .NET for Spark application, there are just a few steps we need to follow to start getting those interesting insights from our data:
In any Spark application, we start off by establishing a new SparkSession, which is the entry point to programming with Spark:
SparkSession spark = SparkSession
    .Builder()
    .AppName("Apache User Log Processing")
    .GetOrCreate();
By calling on the spark object created above, we can now access Spark and DataFrame functionality throughout our program – great! But what is a DataFrame? Let’s learn about it in the next step.
Now that we have access to Spark functionality, we can read in the log data we’ll be analyzing. We store input data in a DataFrame, which is a distributed collection of data organized into named columns:
DataFrame generalDf = spark.Read().Text("<path to input data set>");
When our input is contained in a .txt file, we use the .Text() method, as shown above. There are other methods to read in data from other sources, such as .Csv() to read in comma-separated values files.
With our input logs stored in a DataFrame, we can start analyzing them – now things are getting exciting!
An important first step is data preparation. Data prep involves cleaning up our data in some way. This could include removing incomplete entries to avoid error in later calculations or removing irrelevant input to improve performance.
In our example, we should first ensure all of our entries are complete logs. We can do this by comparing each log entry to a regular expression (AKA a regex), which is a sequence of characters that defines a pattern.
Let’s define a regex expressing a pattern all valid Apache log entries should follow:
string s_apacheRx = "^(S+) (S+) (S+) [([w:/]+s[+-]d{4})] "(S+) (S+) (S+)" (d{3}) (d+)";
How do we perform a calculation on each row of a DataFrame, like comparing each log entry to the above regex? The answer is Spark SQL.
Spark SQL provides many great functions for working with the structured data stored in a DataFrame. One of the most popular features of Spark SQL is UDFs, or user-defined functions. We define the type of input they take and the type of output they produce, and then the actual calculation or filtering they perform.
Let’s define a new UDF GeneralReg to compare each log entry to the s_apacheRx regex. Our UDF requires an Apache log entry, which is a string, and will return a true or false depending upon if the log matches the regex:
spark.Udf().Register<string, bool>("GeneralReg", log => Regex.IsMatch(log, s_apacheRx));
So how do we call GeneralReg?
In addition to UDFs, Spark SQL provides the ability to write SQL calls to analyze our data – how convenient! It’s common to write a SQL call to apply a UDF to each row of data.
To call GeneralReg from above, let’s use the following SQL call:
DataFrame generalDf = spark.Sql("SELECT logs.value, GeneralReg(logs.value) FROM Logs");
This SQL call tests each row of generalDf to determine if it’s a valid and complete log.
We can use .Filter() to only keep the complete log entries in our data, and then .Show() to display our newly filtered DataFrame:
generalDf = generalDf.Filter(generalDf["GeneralReg(value)"]);
generalDf.Show();
Now that we’ve performed some initial data prep, we can continue filtering and analyzing our data. Let’s find log entries from IP addresses starting with 10 and related to spam in some way:
// Choose valid log entries that start with 10
spark.Udf().Register<string, bool>(
    "IPReg",
    log => Regex.IsMatch(log, "^(?=10)"));

generalDf.CreateOrReplaceTempView("IPLogs");

// Apply UDF to get valid log entries starting with 10
DataFrame ipDf = spark.Sql(
    "SELECT iplogs.value FROM IPLogs WHERE IPReg(iplogs.value)");
ipDf.Show();

// Choose valid log entries that start with 10 and deal with spam
spark.Udf().Register<string, bool>(
    "SpamRegEx",
    log => Regex.IsMatch(log, "\b(?=spam)\b"));

ipDf.CreateOrReplaceTempView("SpamLogs");

// Apply UDF to get valid, start with 10, spam entries
DataFrame spamDF = spark.Sql(
    "SELECT spamlogs.value FROM SpamLogs WHERE SpamRegEx(spamlogs.value)");
Finally, let’s count the number of GET requests in our final cleaned dataset. The magic of .NET for Spark is that we can combine it with other popular .NET features to write our apps. We’ll use LINQ to analyze the data in our Spark app one last time:
int numGetRequests = spamDF
    .Collect()
    .Where(r => ContainsGet(r.GetAs<string>("value")))
    .Count();
In the above code, ContainsGet() checks for GET requests using regex matching:
// Use regex matching to group data
// Each group matches a column in our log schema
// i.e. first group = first column = IP
public static bool ContainsGet(string logLine)
{
    Match match = Regex.Match(logLine, s_apacheRx);

    // Determine if valid log entry is a GET request
    if (match.Success)
    {
        Console.WriteLine("Full log entry: '{0}'", match.Groups[0].Value);

        // 5th column/group in schema is "method"
        if (match.Groups[5].Value == "GET")
        {
            return true;
        }
    }

    return false;

}
As a final step in our Spark apps, we call spark.Stop() to shut down the underlying Spark Session and Spark Context.
You can view the complete log processing example in our GitHub repo.
To run a .NET for Apache Spark app, you need to use the spark-submit command, which will submit your application to run on Apache Spark.
The main parts of spark-submit include:
You’ll also need to download and setup some dependencies before running a .NET for Spark app locally, such as Java and Apache Spark.
A sample Windows command for running your app is as follows:
spark-submit --class org.apache.spark.deploy.dotnet.DotnetRunner --master local /path/to/microsoft-spark-<version>.jar dotnet /path/to/netcoreapp<version>/LoggingApp.dll
We’d love to help you get started with .NET for Apache Spark and hear your feedback.
You can Request a Demo from our landing page and check out the .NET for Spark GitHub repo to learn more about how you can apply .NET for Spark in your apps and get involved with our effort to make .NET a great tech stack for building big data applications!
The post Using .NET for Apache® Spark™ to Analyze Log Data appeared first on .NET Blog.
This post was co-authored by the extended Azure Mobility Team.
The past year has been eventful for a lot of reasons. At Microsoft, we’ve expanded our partnerships, including Volkswagen, LG Electronics, Faurecia, TomTom, and more, and taken the wraps off new thinking such as at CES, where we recently demonstrated our approach to in-vehicle compute and software architecture.
Looking ahead, areas that were once nominally related now come into sharper focus as the supporting technologies are deployed and the various industry verticals mature. The welcoming of a new year is a good time to pause and take in what is happening in our industry and in related ones with an aim to developing a view on where it’s all heading.
In this blog, we will talk about the trends that we see in connected vehicles and smart cities and describe how we see ourselves fitting in and contributing.
MaaS (sometimes referred to as Transportation as a Service, or TaaS) is about people getting to goods and services and getting those goods and services to people. Ride-hailing and ride-sharing come to mind, but so do many other forms of MaaS offerings such as air taxis, autonomous drone fleets, and last-mile delivery services. We inherently believe that completing a single trip—of a person or goods—will soon require a combination of passenger-owned vehicles, ride-sharing, ride-hailing, autonomous taxis, bicycle-and scooter-sharing services transporting people on land, sea, and in the air (what we refer to as “multi-modal routing”). Service offerings that link these different modes of transportation will be key to making this natural for users.
With Ford, we are exploring how quantum algorithms can help improve urban traffic congestion and develop a more balanced routing system. We’ve also built strong partnerships with TomTom for traffic-based routing as well as with AccuWeather for current and forecast weather reports to increase awareness of weather events that will occur along the route. In 2020, we will be integrating these routing methods together and making them available as part of the Azure Maps service and API. Because mobility constitutes experiences throughout the day across various modes of transportation, finding pickup locations, planning trips from home and work, and doing errands along the way, Azure Maps ties the mobility journey with cloud APIs and iOS and Android SDKs to deliver in-app mobility and mapping experiences. Coupled with the connected vehicle architecture of integration with federated user authentication, integration with the Microsoft Graph, and secure provisioning of vehicles, digital assistants can support mobility end-to-end. The same technologies can be used in moving goods and retail delivery systems.
The pressure to become profitable will force changes and consolidation among the MaaS providers and will keep their focus on approaches to reducing costs such as through autonomous driving. Incumbent original equipment manufacturers (OEMs) are expanding their businesses to include elements of car-sharing to continue evolving their businesses as private car ownership is likely to decline over time.
We refer holistically to these various signals that can inform vehicle routing (traffic, weather, available modalities, municipal infrastructure, and more) as “navigation intelligence.” Taking advantage of this navigation intelligence will require connected vehicles to become more sophisticated than just logging telematics to the cloud.
The reporting of basic telematics (car-to-cloud) is barely table-stakes; over-the-air updates (OTA, or cloud-to-car) will become key to delivering a market-competitive vehicle, as will command-and-control (more cloud-to-car, via phone apps). Forward-thinking car manufacturers deserve a lot of credit here for showing what’s possible and for creating in consumers the expectation that the appearance of new features in the car after it is purchased isn’t just cool, but normal.
Future steps include the integration of in-vehicle infotainment (IVI) with voice assistants that blend the in- and out-of-vehicle experiences, updating AI models for in-market vehicles for automated driving levels one through five, and of course pre-processing the telemetry at the edge in order to better enable reinforcement learning in the cloud as well as just generally improving services.
As vehicles become more richly connected and deliver experiences that overlap with what we’ve come to expect from our phones, an emerging question is, what is the right way to make these work together? Projecting to the IVI system of the vehicle is one approach, but most agree that vehicles should have a great experience without a phone present.
Separately, phones are a great proxy for “a vehicle” in some contexts, such as bicycle sharing, providing speed, location, and various other probe data, as well as providing connectivity (as well as subsidizing the associated costs) for low-powered electronics on the vehicle.
This is probably a good time to mention 5G. The opportunity 5G brings will have a ripple effect across industries. It will be a critical foundation for the continued rise of smart devices, machines, and things. They can speak, listen, see, feel, and act using sensitive sensor technology as well as data analytics and machine learning algorithms without requiring “always on” connectivity. This is what we call the intelligent edge. Our strategy is to enable 5G at the edge through cloud partnerships, with a focus on security and developer experience.
Connecting things to the cloud, getting data into the cloud, and then bringing the insights gained through cloud-enabled analytics back to the things is how optimizations in one area can be brought to bear in another area. This is the essence of digital transformation. Vehicles gathering high-resolution imagery for improving HD maps can also inform municipalities about maintenance issues. Accident information coupled with vehicle telemetry data can inform better PHYD (pay how you drive) insurance plans as well as the deployment of first responder infrastructure to reduce incident response time.
As the vehicle fleet electrifies, the demand for charging stations will grow. The way in-car routing works for an electric car is based only on knowledge of existing charging stations along the route—regardless of the current or predicted wait-times at those stations. But what if that route could also be informed by historical use patterns and live use data of individual charging stations in order to avoid arriving and having three cars ahead of you? Suddenly, your 20-minute charge time is actually a 60-minute stop, and an alternate route would have made more sense, even if, on paper, it’s more miles driven.
Realizing these kinds of scenarios means tying together knowledge about the electrical grid, traffic patterns, vehicle types, and incident data. The opportunities here for brokering the relationships among these systems are immense, as are the challenges to do so in a way that encourages the interconnection and sharing while maintaining privacy, compliance, and security.
The past several years of data breaches and elections are evidence of a continuously evolving nature of the security threats that we face. That kind of environment requires platforms that continuously invest in security as a fundamental cost of doing business.
Laws, regulatory compliance, and ethics must figure into the design and implementation of our technologies to as great a degree as goals like performance and scalability do. Smart city initiatives, where having visibility into the movement of people, goods, and vehicles is key to doing the kinds of optimizations that increase the quality of life in these cities, will confront these issues head-on.
Routing today is informed by traffic conditions but is still fairly “selfish:” routing for “me” rather than for “we.” Cities would like a hand in shaping traffic, especially if they can factor in deeper insights such as the types of vehicles on the road (sending freight one way versus passenger traffic another way), whether or not there is an upcoming sporting event or road closure, weather, and so on.
Doing this in a way that is cognizant of local infrastructure and the environment is what smart cities initiatives are all about.
For these reasons, we have joined the Open Mobility Foundation. We are also involved with Stanford’s Digital Cities Program, the Smart Transportation Council, the Alliance to Save Energy by the 50x50 Transportation Initiative, and the World Business Council for Sustainable Development.
With the Microsoft Connected Vehicle Platform (MCVP) and an ecosystem of partners across the industry, Microsoft offers a consistent horizontal platform on top of which customer-facing solutions can be built. MCVP helps mobility companies accelerate the delivery of digital services across vehicle provisioning, two-way network connectivity, and continuous over-the-air updates of containerized functionality. MCVP provides support for command-and-control, hot/warm/cold path for telematics, and extension hooks for customer/third-party differentiation. Being built on Azure, MCVP then includes the hyperscale, global availability, and regulatory compliance that comes as part of Azure. OEMs and fleet operators leverage MCVP as a way to “move up the stack” and focus on their customers rather than spend resources on non-differentiating infrastructure.
At Microsoft, and within the Azure IoT organization specifically, we have a front-row seat on the transformative work that is being done in many different industries, using sensors to gather data and develop insights that inform better decision-making. We are excited to see these industries on paths that are trending to converging, mutually beneficial paths. Our colleague Sanjay Ravi shares his thoughts from an automotive industry perspective in this great article.
Turning our attention to our customer and partner ecosystem, the traction we’ve gotten across the industry has been overwhelming:
The Volkswagen Automotive Cloud will be one of the largest dedicated clouds of its kind in the automotive industry and will provide all future digital services and mobility offerings across its entire fleet. More than 5 million new Volkswagen-specific brand vehicles are to be fully connected on Microsoft’s Azure cloud and edge platform each year. The Automotive Cloud subsequently will be rolled out on all Group brands and models.
Cerence is working with us to integrate Cerence Drive products with MCVP. This new integration is part of Cerence’s ongoing commitment to delivering a superior user experience in the car through interoperability across voice-powered platforms and operating systems. Automakers developing their connected vehicle solutions on MCVP can now benefit from Cerence’s industry-leading conversational AI, in turn delivering a seamless, connected, voice-powered experience to their drivers.
Ericsson, whose Connected Vehicle Cloud connects more than 4 million vehicles across 180 countries, is integrating their Connected Vehicle Cloud with Microsoft’s Connected Vehicle Platform to accelerate the delivery of safe, comfortable, and personalized connected driving experiences with our cloud, AI, and IoT technologies.
LG Electronics is working with Microsoft to build its automotive infotainment systems, building management systems and other business-to-business collaborations. LG will leverage Microsoft Azure cloud and AI services to accelerate the digital transformation of LG’s B2B business growth engines, as well as Automotive Intelligent Edge, the in-vehicle runtime environment provided as part of MCVP.
Global technology company ZF Friedrichshafen is transforming into a provider of software-driven mobility solutions, leveraging Azure cloud services and developer tools to promote faster development and validation of connected vehicle functions on a global scale.
Faurecia is collaborating with Microsoft to develop services that improve comfort, wellness, and infotainment as well as bring digital continuity from home or the office to the car. At CES, Faurecia demonstrated how its cockpit integration will enable Microsoft Teams video conferencing. Using Microsoft Connected Vehicle Platform, Faurecia also showcased its vision of playing games on the go, using Microsoft’s new Project xCloud streaming game preview.
Bell has revealed AerOS, a digital mobility platform that will give operators a 360° view into their aircraft fleet. By leveraging technologies like artificial intelligence and IoT, AerOS provides powerful capabilities like fleet master scheduling and real-time aircraft monitoring, enhancing Bell’s Mobility-as-a-Service (MaaS) experience. Bell chose Microsoft Azure as the technology platform to manage fleet information, observe aircraft health, and manage the throughput of goods, products, predictive data, and maintenance.
Luxoft is expanding its collaboration with Microsoft to accelerate the delivery of connected vehicle solutions and mobility experiences. By leveraging MCVP, Luxoft will enable and accelerate the delivery of vehicle-centric solutions and services that will allow automakers to deliver unique features such as advanced vehicle diagnostics, remote access and repair, and preventive maintenance. Collecting real usage data will also support vehicle engineering to improve manufacturing quality.
We are incredibly excited to be a part of the connected vehicle space. With MCVP, our ecosystem partners and our partnerships with leading automotive players, both vehicle OEMs and automotive technology suppliers, we believe we have a uniquely capable offering enabling at global scale the next wave of innovation in the automotive industry as well as related verticals such as smart cities, smart infrastructure, insurance, transportation, and beyond.
Today at Microsoft 365 Developer Day: Dual-screen experiences, we showed you our vision for dual screens. We shared how dual-screen devices are optimized for the way you naturally work and want to get things done. We created a device experience that gives you the option to benefit from a larger screen and have two defined screens so you can do more on a single device.
We shared how your apps work and how you can optimize for three dual-screen patterns whether you are building apps for Windows, Android, or the Web.
Your code is important, and our goal is to make going on this journey with us as easy as possible. This starts by maintaining app compatibility and ensuring your existing websites and apps work well on dual-screen devices. Windows 10X is an expression of Windows 10 and for the first-time apps will run in containers to deliver non-intrusive updates and improved system resources for extended battery life.
Starting today, you can download and install the Microsoft Emulator and tools to start developing apps and testing your apps for Windows 10X. We focused on creating an emulator experience that behaves naturally and adapts to the different device postures. This is an early preview of the experience and you will see updates regularly that follow the same standard Insider builds process.
We’ve also updated the preview SDK for Surface Duo to include all our Java native samples as Kotlin samples, drag-and-drop to help you capture the value of moving data between two apps on dual-screen devices, and to support users on MacOS, Linux (Ubuntu), and Windows with Android Studio, Visual Studio, and VS code integration.
Dual-screen devices create an opportunity for your apps to engage with people in a new and innovative way. Today, we showed you three dual-screen patterns: expansive workspaces, focused screens, and connected apps and how to enhance your app using one technology – however you can create these patterns using all the technologies and frameworks below.
One of the most-used apps on any device is the browser, and many other popular apps are powered by HTML, CSS, and JavaScript, either as PWAs or WebViews. We want to empower web developers to build a great dual-screen experience, whether you are building a website or web app.
To accomplish this, we’ve proposed a new JavaScript API and a CSS media query with a set of pre-defined env() variables. We’re working with the Second-screen and CSS Working Groups at the W3C, and as the standards process progresses, we intend to contribute our implementation to Chromium. The goal is to enable you to build interoperable dual-screen experiences across browsers and operating systems. You can learn more about these proposals on GitHub.
We also introduced new features in the Microsoft Edge DevTools which allows you to simulate and remotely debug dual-screen devices from Microsoft Edge on your desktop. We expect to add these to the DevTools in preview builds of Microsoft Edge soon.
You can also start using our refreshed WinUI 3.0 Alpha that comes with a chromium-based Edge WebView2. The WebView2 API is still early and more details and features will be added to our upcoming WinUI 3 Preview.
To help you utilize all the possibilities for dual-screen devices we built the TwoPaneView control. This control automatically optimizes and adjusts your app so that you can focus on your content and see how your app will respond when spanned or rotated.
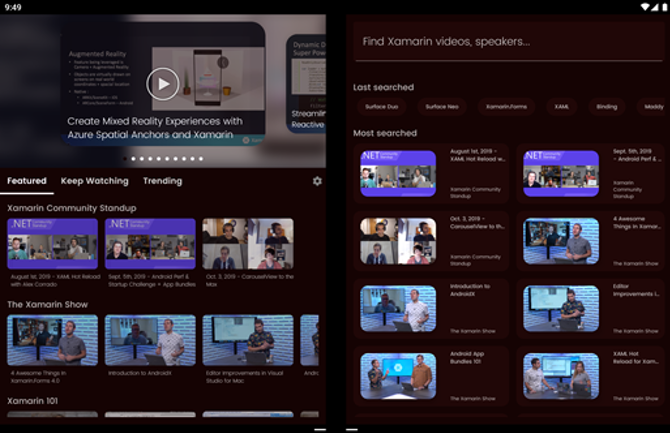
With the WinUI library you can use the TwoPaneView control that provides you two panes – pane 1 and pane 2 for content. This allows you to determine how much content can be shown on each screen and support scrolling of the content independently in each pane.
On Windows 10X, the OS has been designed to respond to the keyboard and posture to reveal what we call the Wonder Bar. This feature enables the familiarity of a laptop while increasing productivity by hosting system-provided input accelerators, and a virtual trackpad for precision mouse input. Apps using CompactOverlayView for always-on-top mini views like picture-in-picture, or MediaTransportControl for background audio playback, will automatically be placed into the Wonder Bar, for seamless and natural peripheral multitasking.
This is just the beginning for creating enhanced experiences for dual-screen devices. We are excited to work with you to idealize and innovate great dual-screen experiences. Please continue to reach out to us at dualscreendev@microsoft.com so we can learn and build together.
The post Microsoft 365 Developer Day: Dual-screen experiences appeared first on Windows Developer Blog.
by Hong Ooi, Senior Data Scientist at Microsoft and maintainer of the foreach package
This post is to announce some new and upcoming changes in the foreach package.
First, foreach can now be found on GitHub! The repository is at https://github.com/RevolutionAnalytics/foreach, replacing its old home on R-Forge. Right now the repo hosts both the foreach and iterators packages, but that may change later.
The latest 1.4.8 version of foreach, which is now live on CRAN, adds preliminary support for evaluating %dopar% expressions in a local environment when a sequential backend is used. This addresses a long-standing inconsistency in the behaviour of %dopar% with parallel and sequential backends, where the latter would evaluate the loop body in the global environment by default. This is a common source of bugs: code that works when prototyped with a sequential backend, mysteriously fails with a “real” parallel backend.
From version 1.4.8, the behaviour of %dopar% can be controlled with
options(foreachDoparLocal=TRUE|FALSE)or equivalently via the system environment variable
R_FOREACH_DOPAR_LOCAL=TRUE|FALSEwith the R option taking its value from the environment variable. The current default value is FALSE, which retains the pre-existing behaviour. It is intended that over time this will be changed to TRUE.
A side-effect of this change is that %do% and %dopar% will (eventually) behave differently for a sequential backend. See this Github issue for more discussion on this topic.
In the background, the repo has also been updated to use modern tooling such as Roxygen, RMarkdown and testthat. None of these should affect how the package works, although there are some minor changes to documentation formats (in particular, the vignettes are now in HTML format rather than PDF).
Some further changes are also planned down the road, to better integrate foreach with the future package by Henrik Bengtsson. See this Github issue for further details.
Please feel free to leave comments, bug reports and pull requests at the foreach repo, or you can contact me directly at hongooi@microsoft.com.
Today, we are announcing the limited preview of Azure Shared Disks, the industry’s first shared cloud block storage. Azure Shared Disks enables the next wave of block storage workloads migrating to the cloud including the most demanding enterprise applications, currently running on-premises on Storage Area Networks (SANs). These include clustered databases, parallel file systems, persistent containers, and machine learning applications. This unique capability enables customers to run latency-sensitive workloads, without compromising on well-known deployment patterns for fast failover and high availability. This includes applications built for Windows or Linux-based clustered filesystems like Global File System 2 (GFS2).
With Azure Shared Disks, customers now have the flexibility to migrate clustered environments running on Windows Server, including Windows Server 2008 (which has reached End-of-Support), to Azure. This capability is designed to support SQL Server Failover Cluster Instances (FCI), Scale-out File Servers (SoFS), Remote Desktop Servers (RDS), and SAP ASCS/SCS running on Windows Server.
We encourage you to get started and request access by filling out this form.
Azure Shared Disks provides a consistent experience for applications running on clustered environments today. This means that any application that currently leverages SCSI Persistent Reservations (PR) can use this well-known set of commands to register nodes in the cluster to the disk. The application can then choose from a range of supported access modes for one or more nodes to read or write to the disk. These applications can deploy in highly available configurations while also leveraging Azure Disk durability guarantees.
The below diagram illustrates a sample two-node clustered database application orchestrating failover from one node to the other.

The flow is as follows:
The below diagram illustrates another common workload consists of multiple nodes reading data from the disk to run parallel jobs, for example, training of Machine Learning models.

The flow is as follows:
Azure Shared Disks are available on Premium SSDs and supports disk sizes including and greater than P15 (i.e. 256 GB). Support for Azure Ultra Disk will be available soon. Azure Shared Disks can be enabled as data disks only (not OS Disks). Each additional mount to an Azure Shared Disk (Premium SSDs) will be charged based on disk size. Please refer to the Azure Disks pricing page for details on limited preview pricing.
Azure Shared Disks provides shared access to block storage which can be leveraged by multiple virtual machines. You will need to use a common Windows and Linux-based cluster manager like Windows Server Failover Cluster (WSFC), Pacemaker, or Corosync for node-to-node communication and to enable write locking. If you are looking for a fully-managed files service on Azure that can be accessed using Server Message Block (SMB) or Network File System (NFS) protocol, check out Azure Premium Files or Azure NetApp Files.
You can create Azure Shared Disks using Azure Resource Manager templates. For details on how to get started and use Azure Shared Disks in preview, please refer to the documentation page. For updates on regional availability and Ultra Disk availability, please refer to the Azure Disks FAQ. Here is a video of Mark Russinovich from Microsoft Ignite 2019 covering Azure Shared Disks.
In the coming weeks, we will be enabling Portal and SDK support. Support for Azure Backup and Azure Site Recovery is currently not available. Refer to the Managed Disks documentation for detailed instructions on all disk operations.
If you are interested in participating in the preview, you can now get started by requesting access.
SQL Server customers migrating their databases to the cloud have multiple choices for their cloud destination. To thoroughly assess which cloud is best for SQL Server workloads, two key factors to consider are:
As you consider your options for running SQL Server in the cloud, it's important to understand what the cloud provider can offer both today and tomorrow. Can they provide you with the capabilities to maximize the performance of your modern applications? Can they automatically protect you against vulnerabilities and ensure availability for your mission-critical workloads?
SQL Server customers benefit from our continued expertise developed over the past 25 years, delivering performance, security, and innovation. This includes deploying SQL Server on Azure, where we provide customers with innovations that aren’t available anywhere else. One great example of this is Azure BlobCache, which provides fast, free reads for customers. This feature alone provides tremendous value to our customers that is simply unmatched in the market today.
Additionally, we offer preconfigured, built-in security and management capabilities that automate tasks like patching, high availability, and backups. Azure also offers advanced data security that enables both vulnerability assessments and advanced threat protection. Customers benefit from all of these capabilities both when using our Azure Marketplace images and when self-installing SQL Server on Azure virtual machines.
Only Azure offers these innovations.
Benchmarks can often be useful tools for assessing your cloud options. It's important, though, to ask if those benchmarks were conducted by independent third parties and whether they used today’s industry-standard methods.

The images above show performance and price-performance comparisons from the February 2020 GigaOm performance benchmark blog post.
In December, an independent study by GigaOm compared SQL Server on Azure Virtual Machines to AWS EC2 using a field test derived from the industry standard TPC-E benchmark. GigaOm found Azure was up to 3.4x faster and 87 percent cheaper than AWS. Today, we are pleased to announce that in GigaOm’s second benchmark analysis, using the latest virtual machine comparisons and disk striping, Azure was up to 3.6x faster and 84 percent cheaper than AWS.1
These results continue to demonstrate that SQL Server runs best on Azure.
Learn more about how you can start taking advantage of these benefits today with SQL Server on Azure.
1Price-performance claims based on data from a study commissioned by Microsoft and conducted by GigaOm in February 2020. The study compared price performance between SQL Server 2019 Enterprise Edition on Windows Server 2019 Datacenter edition in Azure E32as_v4 instance type with P30 Premium SSD Disks and the SQL Server 2019 Enterprise Edition on Windows Server 2019 Datacenter edition in AWS EC2 r5a.8xlarge instance type with General Purpose (gp2) volumes. Benchmark data is taken from a GigaOm Analytic Field Test derived from a recognized industry standard, TPC Benchmark™ E (TPC-E). The Field Test does not implement the full TPC-E benchmark and as such is not comparable to any published TPC-E benchmarks. Prices are based on publicly available US pricing in West US for SQL Server on Azure Virtual Machines and Northern California for AWS EC2 as of January 2020. The pricing incorporates three-year reservations for Azure and AWS compute pricing, and Azure Hybrid Benefit for SQL Server and Azure Hybrid Benefit for Windows Server and License Mobility for SQL Server in AWS, excluding Software Assurance costs. Actual results and prices may vary based on configuration and region.
Starting with Microsoft Edge build 81.0.389.0 on 64-bit Windows 10, we’ve enabled new toolchain optimizations that should provide a substantial performance improvement in general browsing workloads.
We’ve measured an up to 13% performance improvement in the Speedometer 2.0 benchmark when compared to Microsoft Edge 79. Speedometer measures performance by simulating user interactions in a sample web app across a number of DOM APIs and popular JavaScript frameworks used by top sites, and is generally regarded as a good proxy for real-world performance across a number of different subsystems including the DOM, JavaScript engine, layout, and more.
We’d like your help validating these improvements in your real-world browsing as we approach our next Beta release later this month. You can try out these improvements by comparing performance in the latest Dev or Canary builds to Microsoft Edge 80 or earlier.
We measured Speedometer 2.0 in ten consecutive runs on Microsoft Edge 79, where the optimizations are not yet implemented. The results are below.
| Microsoft Edge v. 79.0.309.71 |
|
| 1 | 84.6 |
| 2 | 85.4 |
| 3 | 85.3 |
| 4 | 85.3 |
| 5 | 84.6 |
| 6 | 84.9 |
| 7 | 85.8 |
| 8 | 84.7 |
| 9 | 84.8 |
| 10 | 84.3 |
| Median | 84.85 |
Benchmarked on Windows 10 1909 (OS Build 18363.592) on a Microsoft Surface Pro 5 (Intel(R) i5-8250U CPU 1.60GHz and 8 GB RAM), with no other applications running and no additional browser tabs open.
We then ran Speedometer 2.0 on recent versions of Microsoft Edge 81 which include the new optimizations, with the following results.
| Microsoft Edge v. 81.0.410.0 |
Microsoft Edge v. 81.0.403.1 |
|
| 1 | 96.3 | 96.7 |
| 2 | 91.1 | 95.7 |
| 3 | 91.7 | 95.2 |
| 4 | 96 | 95.5 |
| 5 | 97.6 | 95.5 |
| 6 | 97.4 | 95.9 |
| 7 | 96.8 | 96.2 |
| 8 | 94.4 | 96.2 |
| 9 | 96.4 | 95.5 |
| 10 | 94.4 | 95.4 |
| Median | 96.15 | 95.6 |
Benchmarked on Windows 10 1909 (OS Build 18363.592) on a Microsoft Surface Pro 5 (Intel(R) i5-8250U CPU 1.60GHz and 8 GB RAM), with no other applications running and no additional browser tabs open.
We would love for you to try the new optimizations in Dev or Canary and let us know if you notice these improvements in your real-world experience. Please join us on the Microsoft Edge Insider forums or Twitter to discuss your experience and let us know what you think! We hope you enjoy the changes and look forward to your feedback!
The post New optimizations boost performance in preview builds of Microsoft Edge appeared first on Microsoft Edge Blog.
Here at the Visual Studio Tools for Unity team our mission is to improve the productivity of Unity developers. In Visual Studio 2019 we’ve introduced our Unity Analyzers, a collection of Unity specific code diagnostics and code fixes. Today we’re excited to make our Unity Analyzers Open-Source.
Visual Studio and Visual Studio for Mac rely on Roslyn, our compiler infrastructure, to deliver a fantastic C# programming experience. One of my favorite features of Roslyn is the ability to programmatically guide developers when using an API. At the core of this experience, an analyzer detects a code pattern, and can offer to replace it with a more recommended pattern.
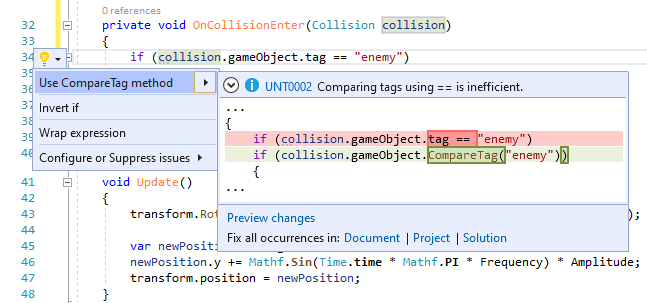
A common example that is specific to the Unity API is how you compare tags on your game objects. You could write
collision.gameObject.tag == "enemy";
to compare tags

But Unity offers a CompareTag method that is more efficient, so we implemented a CompareTag diagnostic that will detect this pattern and offer to use the more optimized method instead. On Windows just press (CTRL+.) or press (Alt-Enter) on Visual Studio for Mac to trigger the Quick Fixes, and you’ll be prompted by a preview of the change:
We currently have a dozen analyzers that are shipping in the Tools for Unity, with more being written right now.
Recently the Roslyn team introduced analyzer suppressors. This feature allows us to programmatically suppress the default set of analyzers that Roslyn ships.
This is great for Unity developers, because it allows the Tools for Unity team to remove warnings or code fix suggestions that do not apply to Unity development.
A common example is for fields decorated with Unity’s SerializeField attributes to light-up the fields in the Unity Inspector. For instance, without the Unity Analyzers, Visual Studio would offer to make a serialized field readonly while we know the Unity engine is setting the value of this field. If you were to accept that code fix, Unity would remove any association you set in the Inspector for this field, which could break things. By writing a suppressor, we can programmatically suppress this behavior while keeping it enabled for standard C# fields.
Today, the Unity Analyzers are being shipped as part of the Tools for Unity and are enabled on Visual Studio and Visual Studio for Mac. The analyzers are running inside Visual Studio, meaning that if you suppress a warning you might still see it in Unity’s error list. We’re working on improving this for a future release.
The Tools for Unity team has a backlog of analyzers, code fixes and suppressors that we’re working on, but we’re always on the lookout for new analyzers that would improve the C# programming experience of Unity developers. The project is easy to get started with. Just head to our README and suggest a new analyzer or even submit a PR to the repository.
See you on GitHub!
The post Making our Unity Analyzers Open-Source appeared first on Visual Studio Blog.
Today, we are releasing the February 2020 Security and Quality Rollup Updates for .NET Framework.
The February Security and Quality Rollup Update does not contain any new security fixes. See January 2020 Security and Quality Rollup for the latest security updates.
This release contains the following quality and reliability improvements. Some improvements included in the Security and Quality Rollup and were previously released in the Security and Quality Rollup that was dated January 23, 2020.
1 Common Language Runtime (CLR)
2 Windows Communication Foundation (WCF) 3 Windows Presentation Foundation (WPF)
The Security and Quality Rollup is available via Windows Update, Windows Server Update Services, and Microsoft Update Catalog.
You can get the update via the Microsoft Update Catalog. For Windows 10, NET Framework 4.8 updates are available via Windows Update, Windows Server Update Services, Microsoft Update Catalog. Updates for other versions of .NET Framework are part of the Windows 10 Monthly Cumulative Update.
Note: Customers that rely on Windows Update and Windows Server Update Services will automatically receive the .NET Framework version-specific updates. Advanced system administrators can also take use of the below direct Microsoft Update Catalog download links to .NET Framework-specific updates. Before applying these updates, please ensure that you carefully review the .NET Framework version applicability, to ensure that you only install updates on systems where they apply.
The following table is for Windows 10 and Windows Server 2016+ versions.
| Product Version | Cumulative Update | |
|---|---|---|
| Windows 10 1909 and Windows Server, version 1909 | ||
| .NET Framework 3.5, 4.8 | Catalog | 4534132 |
| Windows 10 1903 and Windows Server, version 1903 | ||
| .NET Framework 3.5, 4.8 | Catalog | 4534132 |
| Windows 10 1809 (October 2018 Update) and Windows Server 2019 | 4538122 | |
| .NET Framework 3.5, 4.7.2 | Catalog | 4534119 |
| .NET Framework 3.5, 4.8 | Catalog | 4534131 |
| Windows 10 1803 (April 2018 Update) | ||
| .NET Framework 3.5, 4.7.2 | Catalog | 4537762 |
| .NET Framework 4.8 | Catalog | 4534130 |
| Windows 10 1709 (Fall Creators Update) | ||
| .NET Framework 3.5, 4.7.1, 4.7.2 | Catalog | 4537789 |
| .NET Framework 4.8 | Catalog | 4534129 |
| Windows 10 1703 (Creators Update) | ||
| .NET Framework 3.5, 4.7, 4.7.1, 4.7.2 | Catalog | 4537765 |
| .NET Framework 4.8 | Catalog | 4537557 |
| Windows 10 1607 (Anniversary Update) and Windows Server 2016 | ||
| .NET Framework 3.5, 4.6.2, 4.7, 4.7.1, 4.7.2 | Catalog | 4537764 |
| .NET Framework 4.8 | Catalog | 4534126 |
| Windows 10 1507 | ||
| .NET Framework 3.5, 4.6, 4.6.1, 4.6.2 | Catalog | 4537776 |
The following table is for earlier Windows and Windows Server versions.
| Product Version | Security and Quality Rollup | |
|---|---|---|
| Windows 8.1, Windows RT 8.1 and Windows Server 2012 R2 | 4538124 | |
| .NET Framework 3.5 | Catalog | 4532946 |
| .NET Framework 4.5.2 | Catalog | 4534120 |
| .NET Framework 4.6, 4.6.1, 4.6.2, 4.7, 4.7.1, 4.7.2 | Catalog | 4534117 |
| .NET Framework 4.8 | Catalog | 4534134 |
| Windows Server 2012 | 4538123 | |
| .NET Framework 3.5 | Catalog | 4532943 |
| .NET Framework 4.5.2 | Catalog | 4534121 |
| .NET Framework 4.6, 4.6.1, 4.6.2, 4.7, 4.7.1, 4.7.2 | Catalog | 4534116 |
| .NET Framework 4.8 | Catalog | 4534133 |
The last few .NET Framework Monthly updates are listed below for your convenience:
The post .NET Framework February 2020 Security and Quality Rollup appeared first on .NET Blog.
We are happy to announce that the February 2020 release of the Python Extension for Visual Studio Code is now available. You can download the Python extension from the Marketplace, or install it directly from the extension gallery in Visual Studio Code. If you already have the Python extension installed, you can also get the latest update by restarting Visual Studio Code or updating it directly in the Extensions view. You can learn more about Python support in Visual Studio Code in the documentation.
In this release we made improvements that are listed in our changelog, closing a total of 66 issues, including a much faster startup of Jupyter Notebook editor and scaling back of configuration notifications. Keep on reading to learn more!
In the January release of the Python extension, we made tremendous improvements towards the performance of the Notebook editor. In this release, we continued that effort to take it even further. In our testing benchmarks, we see an additional 2-3X improvement in speed when starting up the Jupyter server and when opening the Notebook editor. First cell execution is also faster as the Jupyter server now spins up in the background automatically when notebooks are opened.
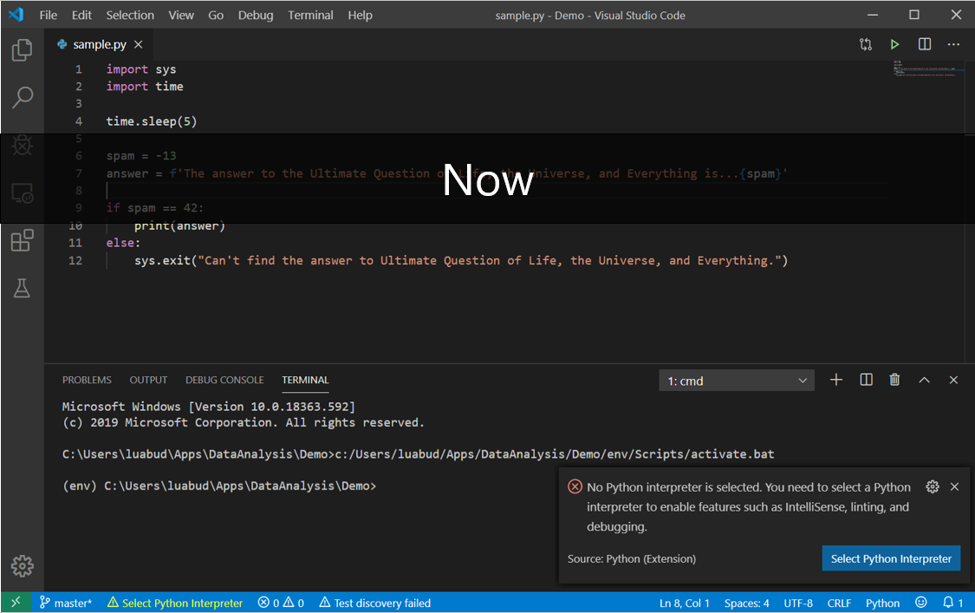
Another feedback we often receive is that when opening a workspace that is already configured for Visual Studio Code without having an interpreter selected, the Python extension was throwing a lot of notifications for installation of tools. Previously, the installation would fail because no interpreter was selected in the workspace.
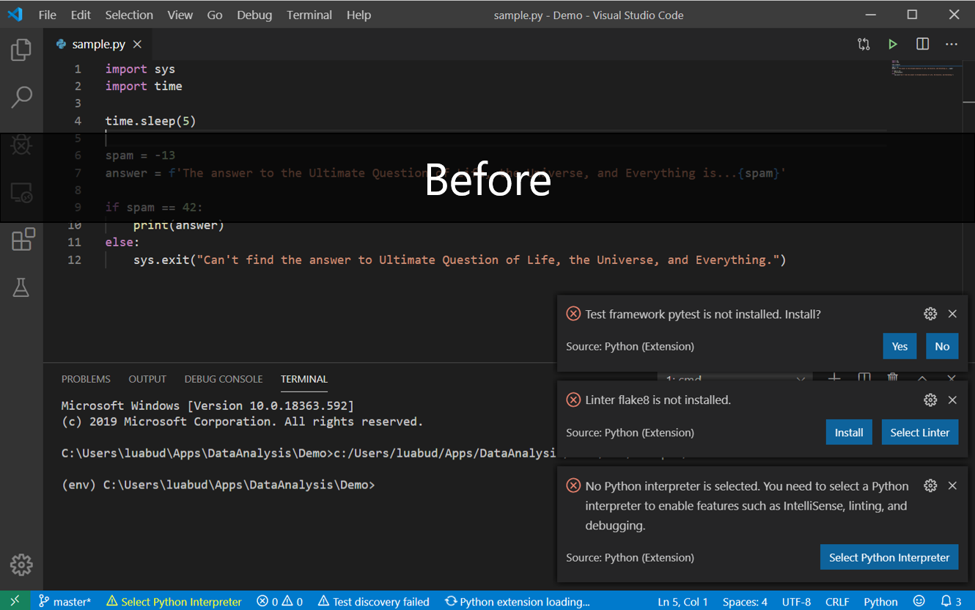
In this release, we scaled back the notification prompts for tools installation. They are now only displayed if an interpreter is selected.
Although it’s not part of the new improvements included in this release, the Python debugger supports a feature that doesn’t seem to be widely known: Jump to Cursor.
When you start a debug session and the debugger hits a breakpoint, you can right click on any part of your code – before or after the point where the breakpoint was hit, and select “Jump to Cursor”. This will make the debugger continue its execution from that selected line onward:

So if you want to execute pieces of code that the debugger had already passed through, you don’t need to restart the debug session and wait for the execution to reach that point again. You can simply set it to jump to the line you wish to execute.
We’d love to hear your feedback! Did you know about this feature before this blog post? Do you think its name can be improved to better indicate its behaviour? Let us know on the following GitHub issue: https://github.com/microsoft/vscode-python/issues/9947.
In this release we have also added small enhancements and fixed issues requested by users that should improve your experience working with Python in Visual Studio Code. Some notable changes include:
We’re constantly A/B testing new features. If you see something different that was not announced by the team, you may be part of the experiment! To see if you are part of an experiment, you can check the first lines in the Python extension output channel. If you wish to opt-out of A/B testing, you can open the user settings.json file (View > Command Palette… and run Preferences: Open Settings (JSON)) and set the “python.experiments.optOutFrom” setting to [“All”], or to specific experiments you wish to opt out from.
Be sure to download the Python extension for Visual Studio Code now to try out the features above. If you run into any problems, please file an issue on the Python VS Code GitHub page.
The post Python in Visual Studio Code – February 2020 Release appeared first on Python.
At Microsoft Ignite 2019, we were happy to announce that the "Try .NET global tool" added support for C# and F# Jupyter notebooks. Last week, the same team that brought you .NET Notebooks announced Preview 2 of the .NET Notebook.
As the scenarios for what was "Try .NET" continued to grow, the team wanted to a name that encompassed all the experiences they have as well as all the experiences they will have in the future. What was the Try .NET family of projects is now .NET interactive.
The F# community has enjoyed F# in Juypter Notebooks from years with the pioneering functional work of Rick Minerich, Colin Gravill and many other contributors! .NET Interactive is a family of tools and kernels that offer support across a variety of experiences as a 1st party Microsoft-supported offering.
.NET interactive is a group of CLI (command line interface) tools and APIs that enable users to create interactive experiences across the web, markdown, and notebooks.
Here is what the command line looks like using the dotnet CLI.
dotnet interactive global tool: dotnet try global tool: trydotnet.js API You can start playing with it today, locally or in the cloud! Seriously. Just click and start using it.
Before you install the .NET interactive global tool, please make sure you have the following:
conda or pip. > jupyter kernelspec list python3 ~jupyterkernelspython3
> dotnet tool install --global Microsoft.dotnet-interactive
> dotnet interactive jupyter install
[InstallKernelSpec] Installed kernelspec .net-csharp in ~jupyterkernels.net-csharp
.NET kernel installation succeeded
[InstallKernelSpec] Installed kernelspec .net-fsharp in ~jupyterkernels.net-fsharp
.NET kernel installation succeeded
[InstallKernelSpec] Installed kernelspec .net-powershell in ~jupyterkernels.net-powershell
.NET kernel installation succeeded
> jupyter kernelspec list
  .net-csharp     ~jupyterkernels.net-csharp
  .net-fsharp     ~jupyterkernels.net-fsharp
  .net-powershell ~jupyterkernels.net-powershell
  python3         ~jupyterkernelspython3
Now you can just run "jupyter lab" at the command line and you're ready to go!
The .NET kernel now comes PowerShell support too! In Preview 2, the .NET interactive team partnered with PowerShell to enable this scenario. You can read more about the announcement of the PowerShell blog.

The .NET interactive team is looking forward to hearing your thoughts. You can talk to them at https://github.com/dotnet/interactive
I wanted to highlight one of the hidden gems .NET interactive has had since Preview 1 - multi-language notebooks. That means that users can switch languages in a single notebook. Here is an example of a C#, F#, and PowerShell in a single .ipynb file.

Using one of the language magic commands (#!csharp, #!fsharp,#pwsh) tells the .NET Interactive kernel to run the cell in a specific language. To see a complete list of the available magic commands, enter the #!lsmagic command into a new cell and run it.
Additionally, you can now write .NET Code in nteract.io. Nteract is an open-source organization that builds SDKs, applications, and libraries that helps people make the most of interactive notebooks and REPLs. We are excited to have our .NET users take advantage of the rich REPL experience nteract provides, including the nteract desktop app.

To get started with .NET Interactive in nteract please download the nteract desktop app and install the .NET kernels.
The team is looking forward to seeing what you build. Moving forward, the team has split dotnet try and dotnet interactive tools into separate repos.
Sponsor: Have you tried developing in Rider yet? This fast and feature-rich cross-platform IDE improves your code for .NET, ASP.NET, .NET Core, Xamarin, and Unity applications on Windows, Mac, and Linux.
One of the really cool aspects about .NET Core is the support for global tools. You can use global tools to simplify common tasks during your development workflow. For example, you can create tools to minify image assets, simplify working with source control, or perform any other task that you can automate with the command line. After developing your tool, you can distribute it on NuGet.org, or any other NuGet repository, to share the tool with others. Since .NET Core is cross platform, your global tools will also work cross platform, assuming your code doesn’t contain any platform specific code. You can find existing global tools here. You can also create local tools, those that are associated with specific projects and not available globally. For more info on local tools see the .NET Core Tools — local installation section in Announcing .NET Core 3.0.
In this post we will discuss how you can create global tools when developing on macOS as well as how to prepare them to distribute using NuGet. Let’s get started with our first global tool. Today, we will be using Visual Studio for Mac, but you can follow similar steps if you are using a different IDE or editor. To ensure you have everything you need to follow this tutorial, download Visual Studio for Mac. The code we will be reviewing in this post is available on GitHub, a link is at the end of this post.
Let’s create a very basic global tool that will print “Hello World” to the user. To create our tool, we will work through the following steps:
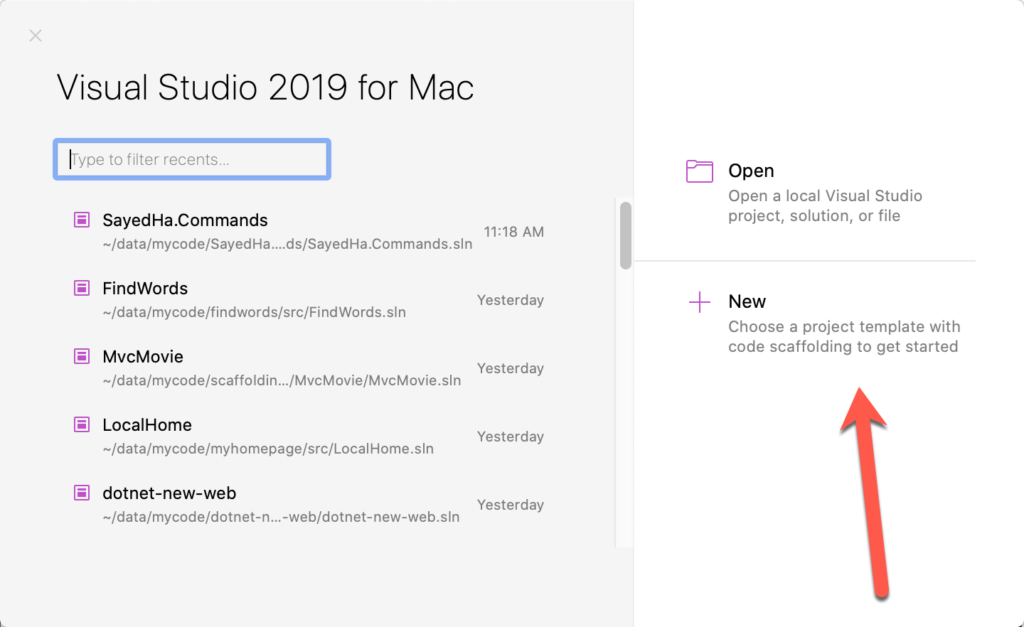
The first thing you’ll want to do when creating a global tool is to create a project. Since global tools are console applications, we will use the console project template to get started. After launching Visual Studio for Mac you’ll see the dialog below, click New to begin creating the project. If you already have Visual Studio open, you could also use the ⇧⌘N shortcut to open the new project dialog.
From here we will create a .NET Core Console project by going to .NET Core > App > Console Application.
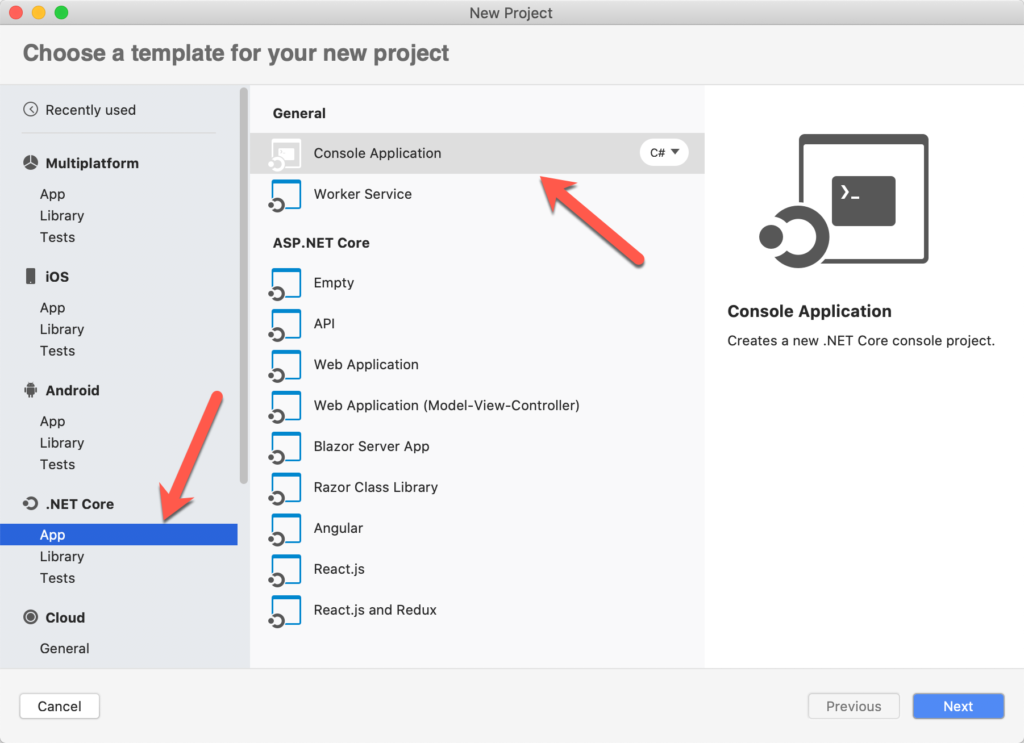
After selecting Console Application, click Next to select the version of .NET Core. I have selected .NET Core 3.1. Click Next after selecting that, and then provide the name and location for the project. I have named the project HelloTool.
Now that we’ve created the project, the first thing to do is to customize the project file to add properties that will make this a global tool. To edit the project file, right click on the project in the Solution Pad and select Tools > Edit File. This is demonstrated in the following image.
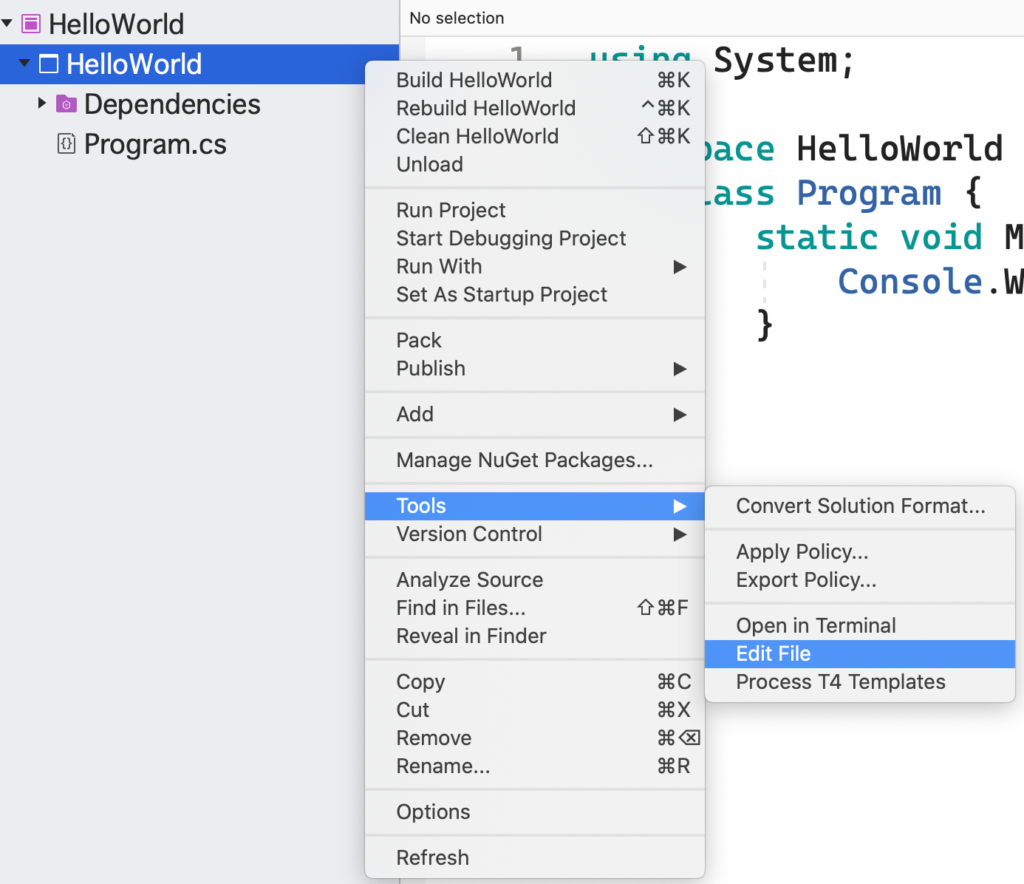
Note: the menu option to edit the project file is moving to the top level in the context menu as Edit Project File soon.
The .csproj file, an MSBuild file that defines the project, will be opened in the editor. To make the project into a global tool, we must enable the project to be packed into a NuGet package. You can do this by adding a property named PackAsTool and setting it to true in the .csproj file. If you are planning to publish the package to NuGet.org you will also want to specify some additional properties that NuGet.org will surface to users. You can see the full list of NuGet related properties that can be set over at NuGet metadata properties. Let’s look at the properties I typically set when creating a global tool. I’ve pasted the .csproj file below.
<Project Sdk="Microsoft.NET.Sdk">
  <PropertyGroup>
    <OutputType>Exe</OutputType>
    <TargetFramework>netcoreapp3.1</TargetFramework>

    <!-- global tool related properties -->
    <PackAsTool>true</PackAsTool>
    <ToolCommandName>hellotool</ToolCommandName>
    <PackageOutputPath>./nupkg</PackageOutputPath>

    <!-- nuget related properties -->
    <Authors>Sayed Ibrahim Hashimi</Authors>
    <Description>My hello world global tool</Description>
    <Version>1.0.0</Version>
    <Copyright>Copyright 2020 © Sayed Ibrahim Hashimi. All rights reserved.</Copyright>
    <PackageLicenseExpression>Apache-2.0</PackageLicenseExpression>
    <RepositoryUrl>https://github.com/sayedihashimi/global-tool-sample</RepositoryUrl>
    <RepositoryType>git</RepositoryType>
    <PackageType>DotNetCliTool</PackageType>
  </PropertyGroup>
</Project>
There are two sections of properties that I have added here. Below you’ll find a description of each of these properties.
| Property Name | Description |
| PackAsTool | Set this to true for all global tools, this will enable packing the project into a NuGet package. |
| ToolCommandName | Optional name for the tool. |
| PackageOutputPath | Path to where the .nupkg file should be placed. |
| Authors | Name of the author(s) of the project. |
| Description | Description that will be shown in nuget.org and other places. |
| Version | Version of the NuGet package. For each release to nuget.org this must be unique. |
| Copyright | Copyright declaration. |
| PackageLicenseExpression | An SPDX license identifier or expression. |
| RepositoryUrl | Specifies the URL for the repository where the source code for the package resides and/or from which it’s being built. |
| RepositoryType | Repository type. Examples: git, tfs. |
| PackageType | For tools specify this as DotNetCliTool. |
It’s a good idea to specify these properties now, so that you can focus on the code for the global tool. If you’re just creating a tool to play around, or for personal use, I recommend just setting PackAsTool, ToolCommandName and PackageOutputPath. Now let’s take a closer look at the code.
In the Program.cs file you’ll find that the following code was added when we created the project.
using System;

namespace HelloWorld {
    class Program {
        static void Main(string[] args) {
            Console.WriteLine("Hello World!");
       }
    }
}
Since the code is already printing “Hello World!”, we can use this as is with no modifications for now. Let’s move on to try executing this as a global tool at the command line. We will first need to package this as a NuGet package.
To create a NuGet package from this project you can use the built in Pack command offered by Visual Studio for Mac. To get there, right-click your project and then select Pack as seen in the next image.
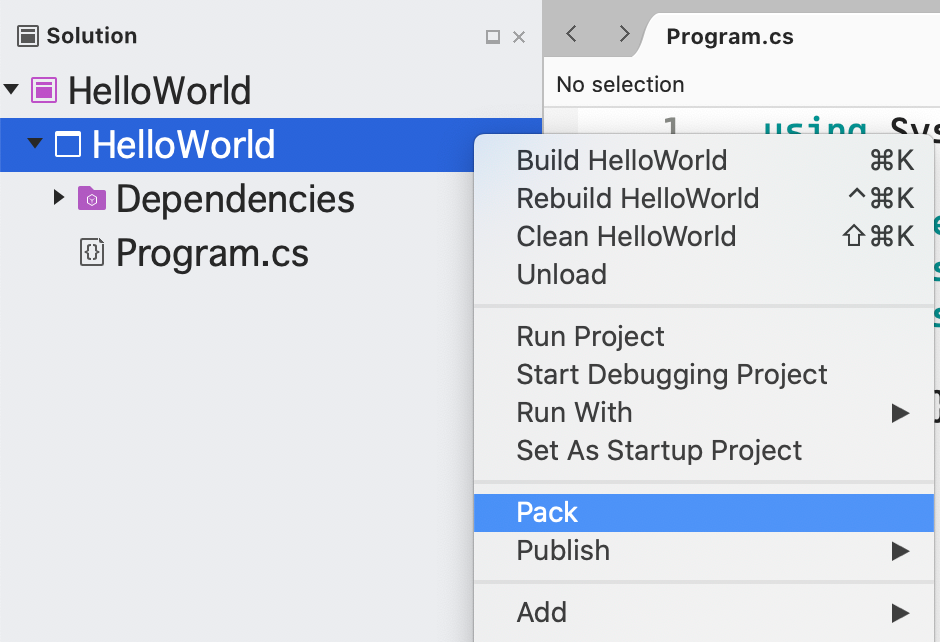
After you invoke the Pack command, the NuGet package (.nupkg file) will be created in the directory we specified in the PackageOutputPath property. In our case it will go into a folder named nupkg in the project folder. Now that we have created a NuGet package from the project, we will register the global tool and try it from the command line.
To install and test the global tool, first open the Terminal app, or your favorite alternative. You’ll want to change directory into the project directory and run the commands from there. You will need to register the package as a tool using the following command.
dotnet tool install --global --add-source ./nupkg HelloTool
Here we are calling dotnet tool with the install command to install the tool. By passing –global, the tool will be available from any folder on your machine. We passed –add-source with the location to the folder where the .nupkg file is located so that our new tool can be located and installed. After executing this command, you should see output like the following:
You can invoke the tool using the following command: hellotool

Tool 'hellotool' (version '1.0.0') was successfully installed.
Let’s try to invoke the tool with hellotool to see if it’s working.
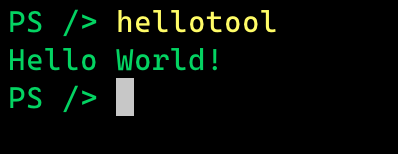
If you run into a command not found error, you may need to modify your PATH variable. You should ensure that the full path to ~/.dotnet/tools is include in the PATH variable. By full path, I mean the ~ should be expanded, for example /Users/sayedhashimi/.dotnet/tools in my case. Now that we have seen how to get started with a tool, let’s do something more interesting by adding some code to the project.
To make this more realistic we want to add some features like; adding support for parameters, displaying help and more. We could implement all of this directly by using System.CommandLine, but the .NET Core team is working on a layer that will simplify it for us called DragonFruit. We will use the DragonFruit to help us create this command quickly.
Note: DragonFruit is currently an experimental app model for System.CommandLine. This information is subject to change as it is being developed.
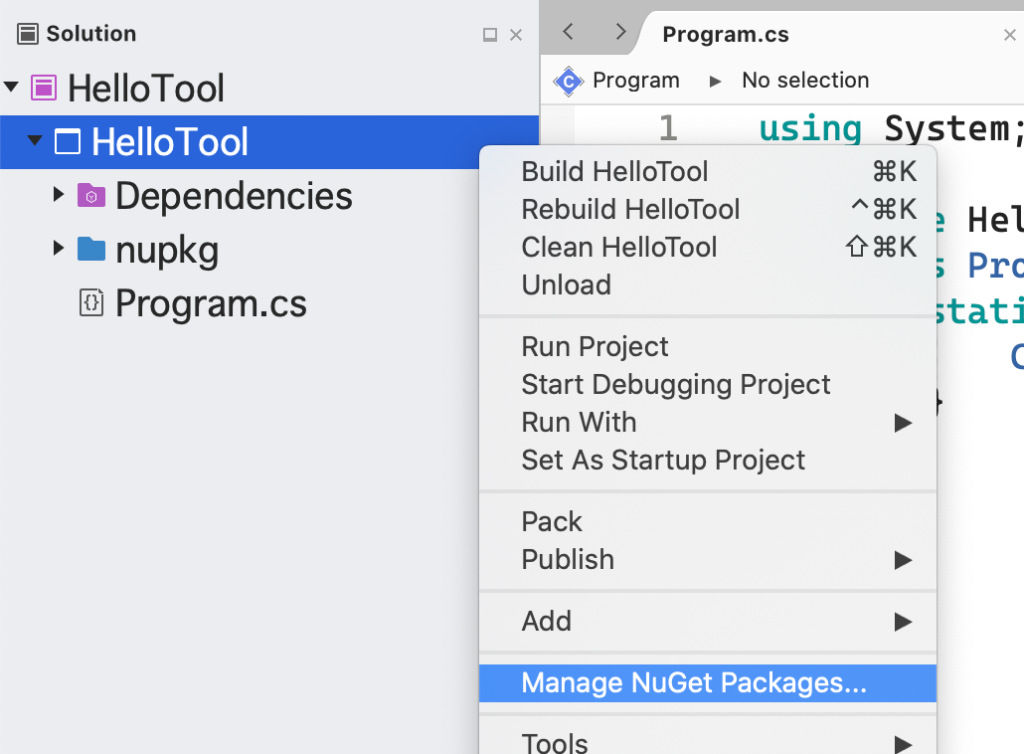
Now we want to add a couple of parameters to the app to make it more realistic. Before we do that, let’s first add the DragonFruit NuGet package to the project and then go from there. To add the NuGet package right click on your app and select Manage NuGet Packages.
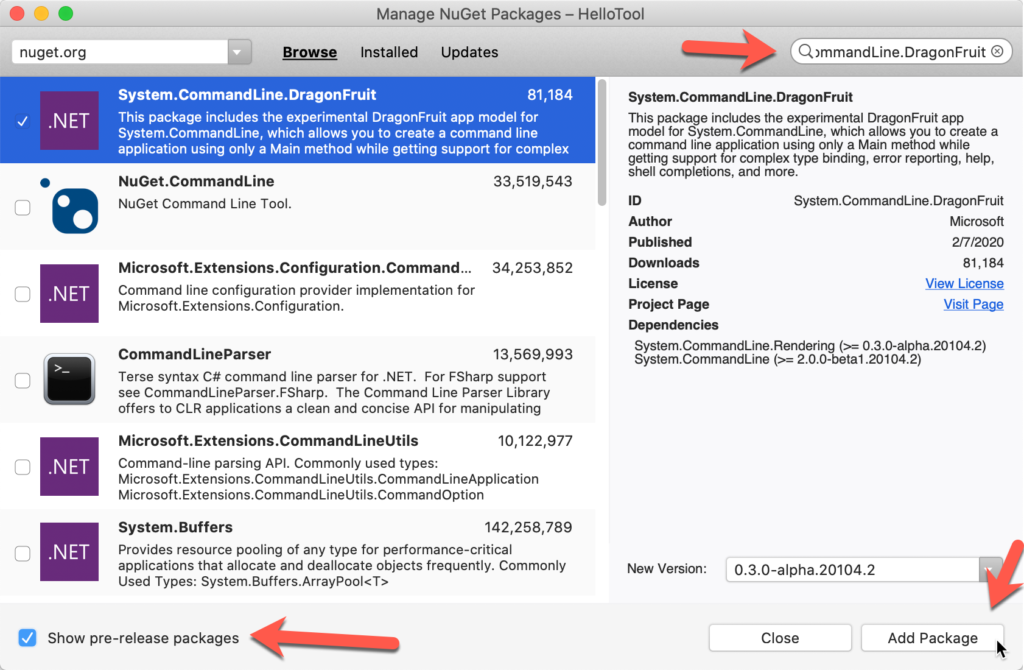
When the Manage NuGet Packages dialog appears, first check the checkbox to Show pre-release packages in the lower left, and the search for System.CommandLine.DragonFruit. After that click on the Add Package button to add the package to your project. See the following image.
Now that we have added the package, we are ready to add some parameters to the global tool. With DragonFruit it’s really easy to add parameters to your tools, you just declare the parameters as arguments in the main method itself. Let’s add a name and age parameter to this global tool. The updated code for Program.cs is shown below.
using System;

namespace HelloTool {
    class Program {
        static void Main(string name = "World", int age = 0) {
            string message = age <= 0 ? $"Hello there {name}!" : $"Hello there {name}, who is {age} years old";
            Console.WriteLine(message);

        }
    }
}
In the code above we have added the parameters as arguments in the Main method, and then we craft a new message using those values. Now we want to test that the changes that we have made are working correctly before making further changes. If you want to just run the app you can use Run > Start without Debugging, or Run > Start Debugging from the menu bar to run it as a vanilla console app. What we want to do is to test it as a .NET Core global tool as well. To do that we will follow the steps below.
Since we will need to install/uninstall the tool often, we can simplify that by creating a new Custom Tool in Visual Studio for Mac to facilitate this. To get started go to Tools > Add Custom Tool.
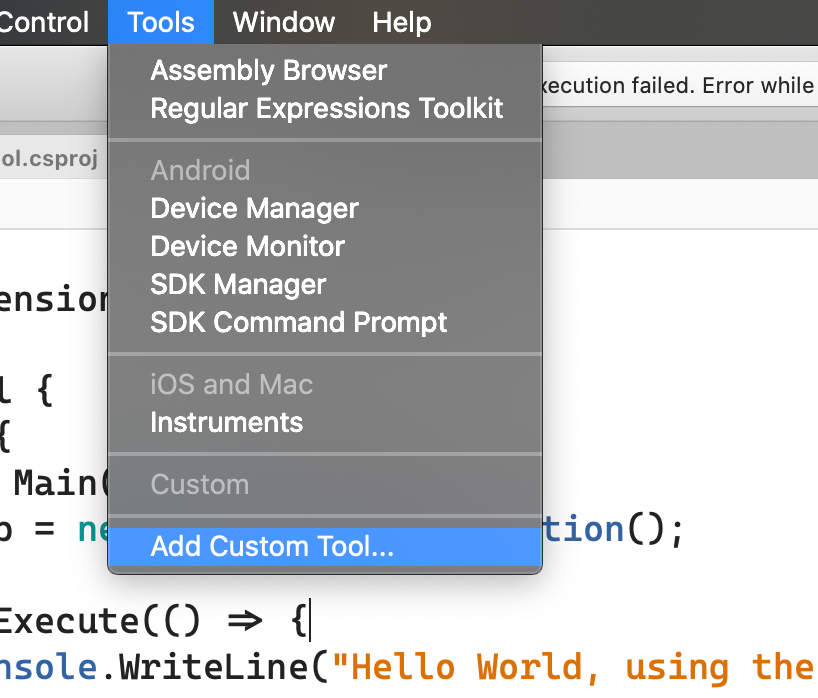
This will bring up a new dialog where we can create the two custom tools to handle install/uninstall. To start, click the Add button and then configure each tool.
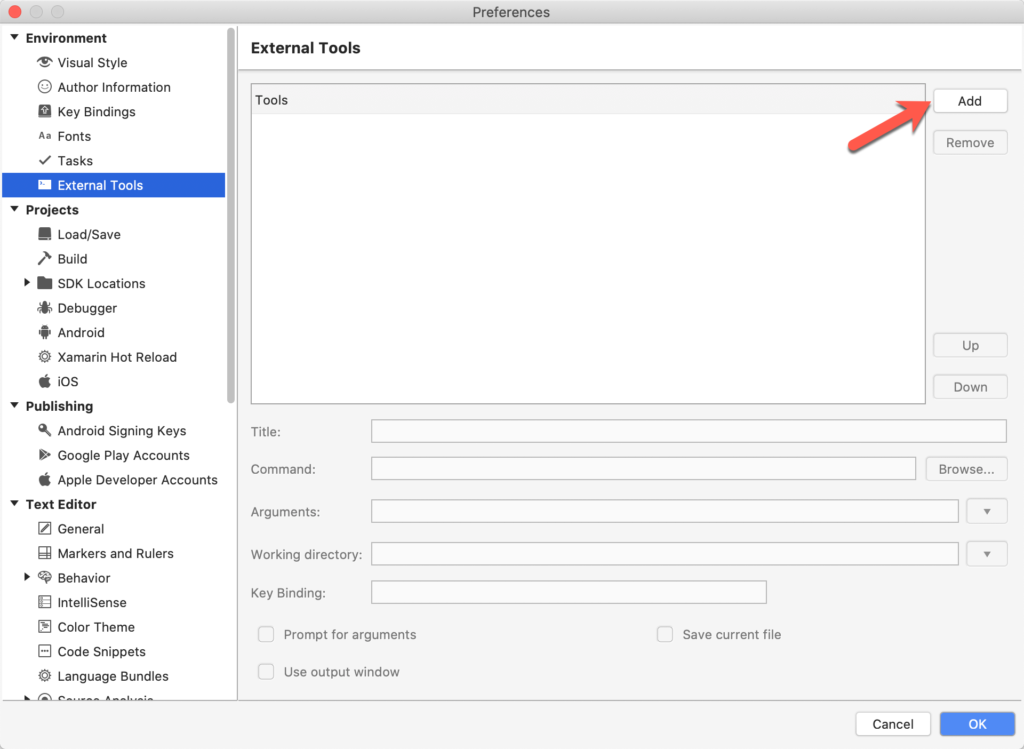
We want to create two tools with the following values:
Install Tool
Uninstall Tool
The Uninstall tool, for example, should look like the following:
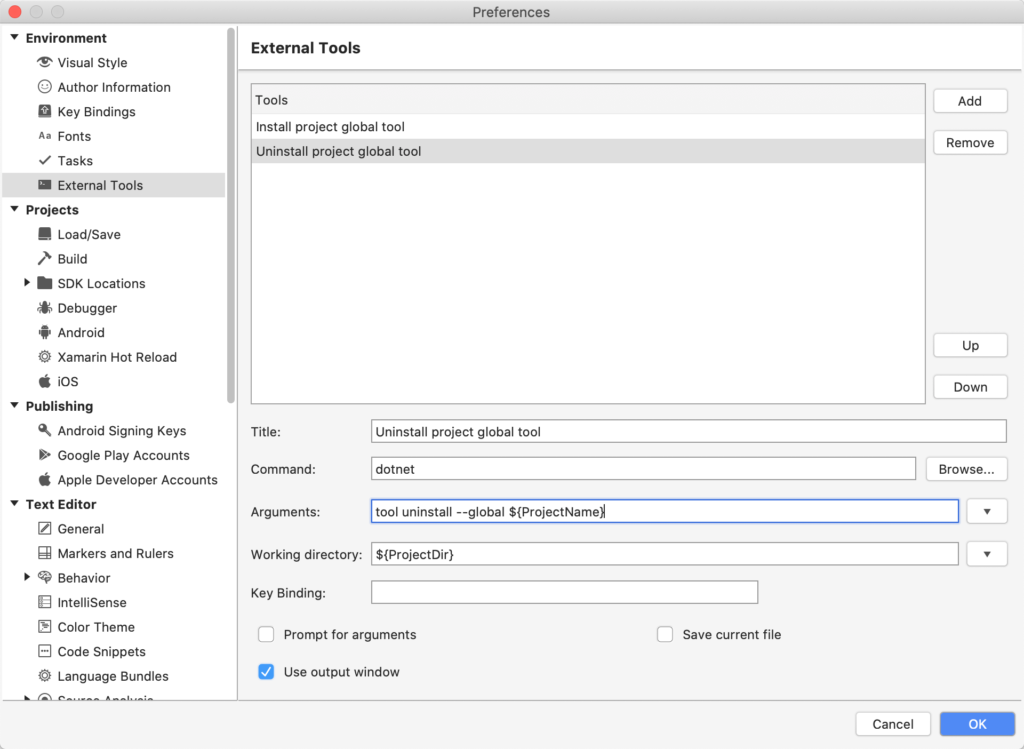
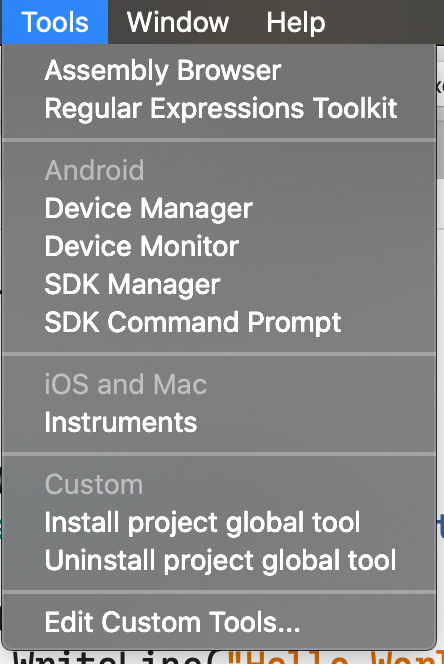
After adding these tools you’ll see them appear in the Tools menu as shown below.
To invoke these newly added tools, you can simply click on the command. Since we authored these tools using the parameter ${ProjectName} these commands should work on your other global tool projects assuming the tool name is the same as the project name. Let’s try the uninstall command. Take a look at the experience in the animate gif below, which shows the tool being invoked and the output being displayed in the Application Output Pad.
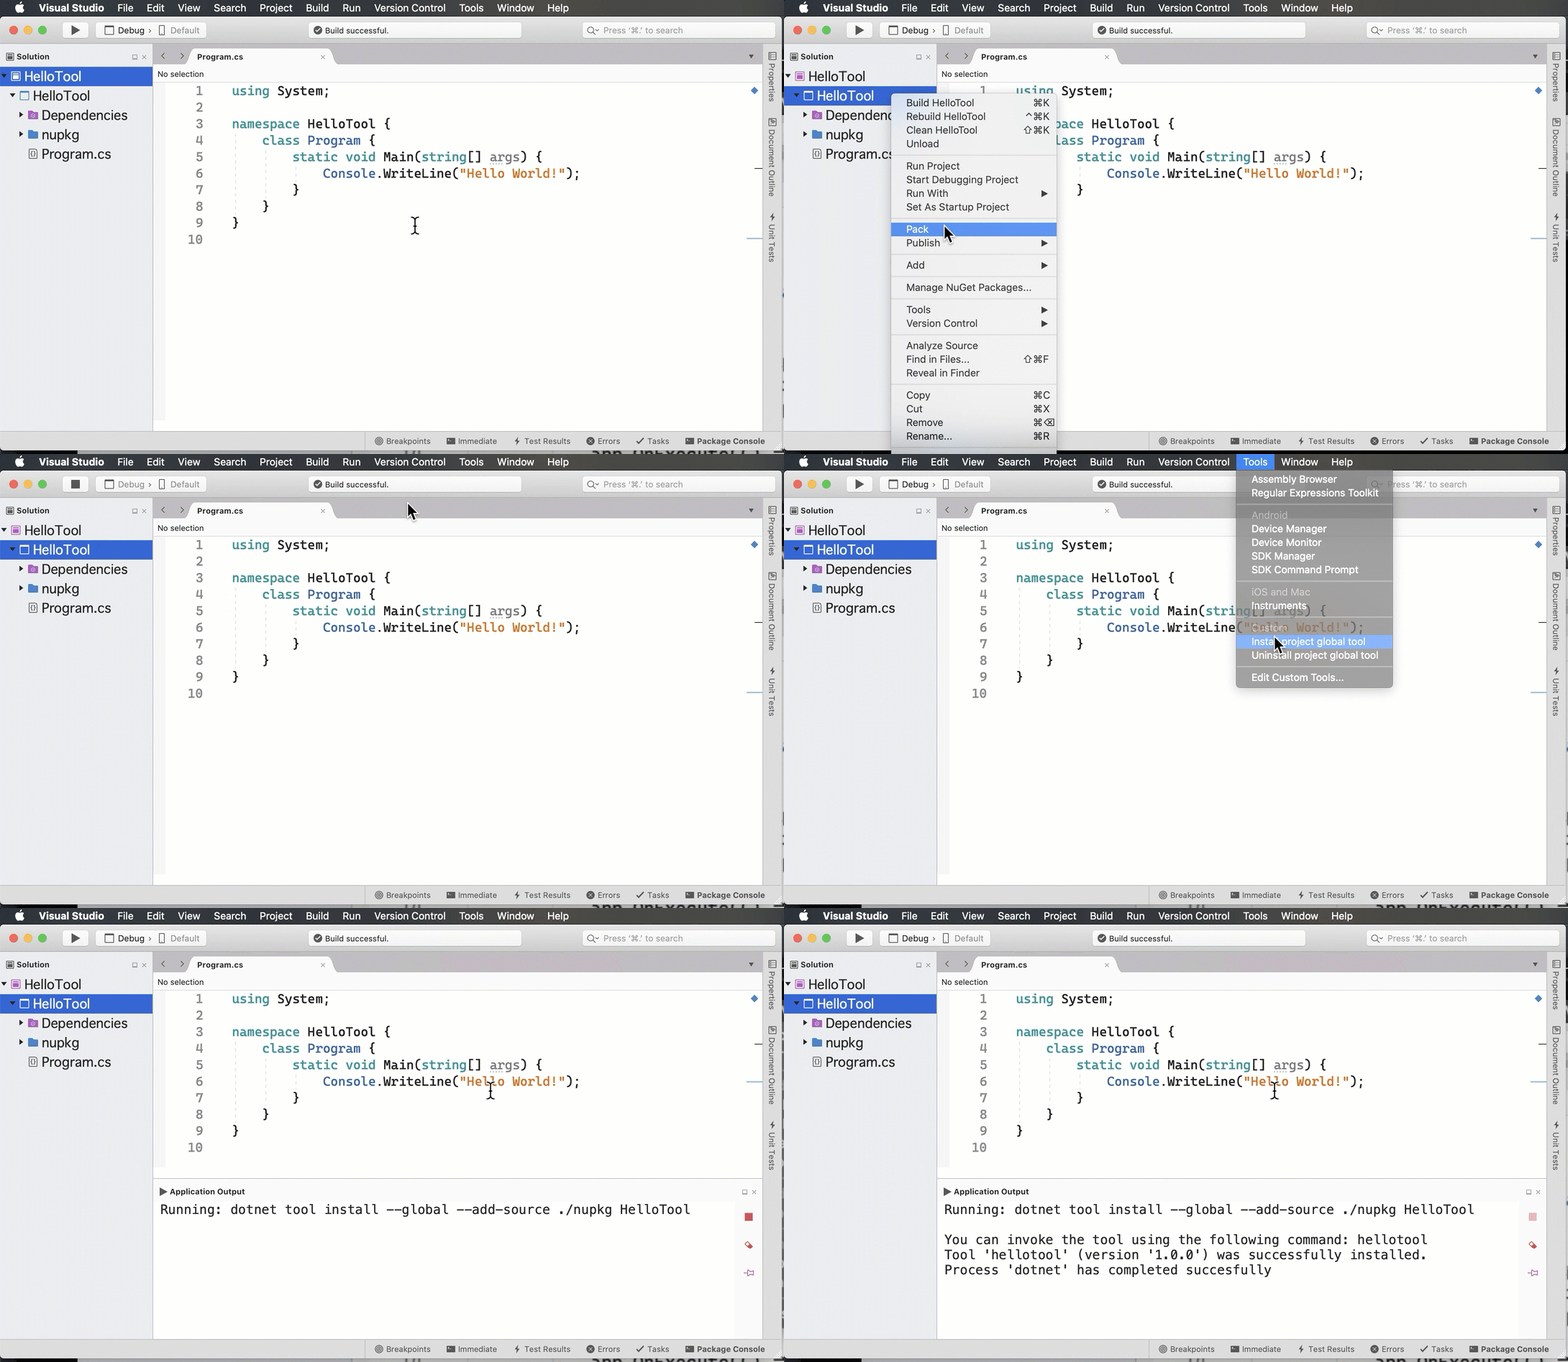
We can see that the tool was successfully installed. Now we can go back to the terminal to test the global tool itself. Go back to the terminal and execute hellotool, and verify that you see the message Hello there World!

The drawback to this approach is that you have to perform three separate steps in the IDE; pack, uninstall and install. You can simplify this by modifying the project file, the .csproj file. Add the following target to your .csproj file immediately before </Project>.
<Target Name="InstallTool" DependsOnTargets="Pack">
    <Exec Command="dotnet tool uninstall --global $(ToolCommandName)" IgnoreExitCode="true"/>
    <Exec Command="dotnet tool install --global --add-source $(PackageOutputPath) $(ToolCommandName)"/>
    <Exec Command="$(ToolCommandName) --help" />
</Target>
This is an MSBuld target that we can call to take care of all three steps for us. It will also call the tool to display its help output after it’s installed. After adding this target to your .cspoj file, you can execute it with dotnet build -t:InstallTool. In Visual Studio for Mac you can create a new Custom Tool with the following properties to invoke this target.
Then you can invoke this new custom tool instead of the three steps we outlined. Since it’s not always feasible to edit the project file, this doc will continue using the previous approach.
Now let’s take a look at the default help output that we get when the DragonFruit package is in the project. Let’s execute hellotool -h, the output is shown below.
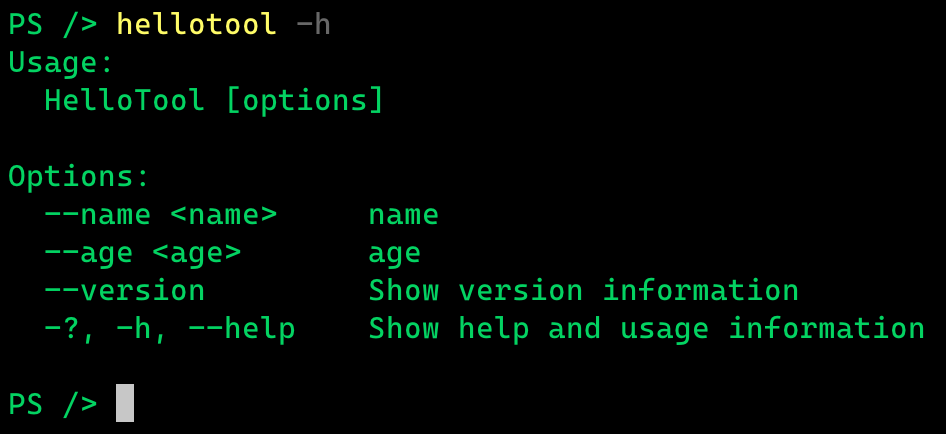
With the default help output, the names of the parameters are shown as the description. This is helpful, but not ideal. Let’s improve it. To do that all we need to do is to add some /// comments to the main method, with the descriptions. The updated code is shown in the following code block.
using System;

namespace HelloTool {
    class Program {
        /// <summary>
        /// A simple global tool with parameters.
        /// </summary>
        /// <param name="name">Your name (required)</param>
        /// <param name="age">Your age</param>
        static void Main(string name = "World", int age = 0) {
            string message = age <= 0 ? $"Hello there {name}!" : $"Hello there {name}, who is {age} years old";
            Console.WriteLine(message);
        }
    }
}
All we have done is add some descriptive comments to the Main method for each parameter. DragonFruit will take care of wiring up for us. Now let’s go through the flow of pack, install, uninstall and test one more time. After going through that when you invoke hellotool -h the output should be as shown below. If you are still seeing the old output, ensure you’ve used the Pack command for the project before install.
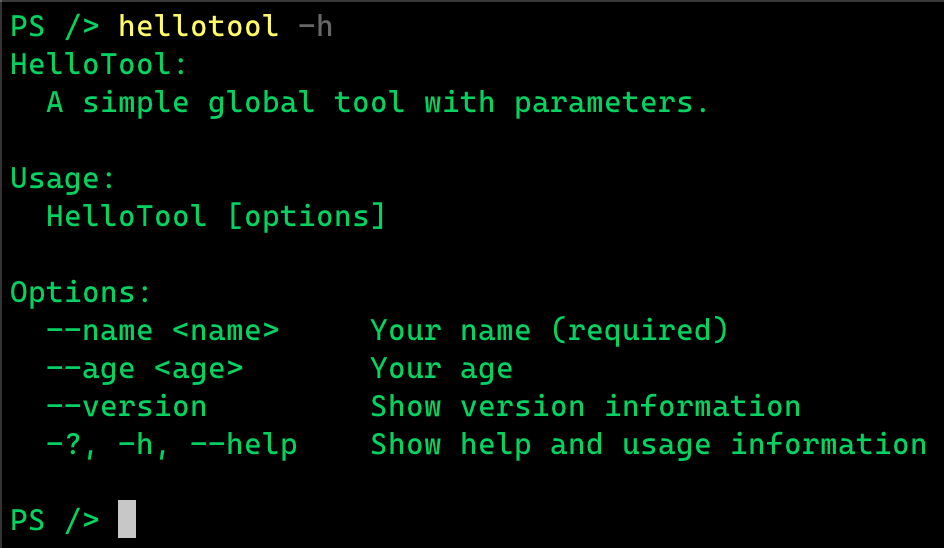
Now we can see that the help output contains some descriptive text. This is looking much better now! Let’s invoke the tool and pass in some parameters. Let’s invoke hellotool –name dotnet-bot –age 5 and examine the output.

It looks like the tool is behaving as expected. From here you can continue developing your command line tool and then publish it to NuGet.org, or another NuGet repository, to share it with others. Since we have already configured the NuGet properties in the project we can upload the .nupkg that is created after invoking the Pack menu option. After you have published the NuGet package, users can install it with the following command.
dotnet tool install --global <packagename>
This will download the package from the NuGet repository and then install the tool globally for that user. The uninstall command that users will use is the same as what you’ve been using during development. When you make changes to your tool and republish to NuGet.org, remember to change the version number in the .csproj file. Each package published to a NuGet repository needs to have a unique version for that package.
In this post we covered a lot of material on how to create a .NET Core global tool. If you’d like to learn more about creating global tools, take a look at the additional resources section below. If you have any questions or feedback, please leave a comment on this post.
Join us for our upcoming Visual Studio for Mac: Refresh() event on February 24 for deep dive sessions into .NET development using Visual Studio for Mac, including a full session on developing Blazor applications.
Make sure to follow us on Twitter at @VisualStudioMac and reach out to the team. Customer feedback is important to us and we would love to hear your thoughts. Alternatively, you can head over to Visual Studio Developer Community to track your issues, suggest a feature, ask questions, and find answers from others. We use your feedback to continue to improve Visual Studio 2019 for Mac, so thank you again on behalf of our entire team.
Documentation links
The post Creating .NET Core global tools on macOS appeared first on Visual Studio Blog.
Have you ever found yourself debugging a .NET project or memory dump only to be confronted with a No Symbols Loaded page? Or maybe experienced an exception occurring in a 3rd party .NET assembly but had no source code to figure out why? You can now use Visual Studio to decompile managed code even if you don’t have the symbols, allowing you to look at code, inspect variables and set breakpoints.
We have recently released a new decompilation and symbol creation experience in the latest preview of Visual Studio 2019 version 16.5 that will aid debugging in situations where you might be missing symbol files or source code. As we launch this feature, we want to ensure that we are creating the most intuitive workflows so please provide feedback.
Decompilation is the process used to produce source code from compiled code. In order to accomplish this we are partnering with ILSpy, a popular open source project, which provides first class, cross platform symbol generation and decompliation. Our engineering team is working to integrate ILSpy technology into valuable debugging scenarios.
Symbol files represent a record of how the compiler translates your source code into Common Intermediate Language (CIL), the CIL is compiled by the Common Language Runtime and executed by the processor. The .NET compiler symbol files are represented by program database files (.pdb), and these files are created as part of the build. The symbol file maps statements in the source code to the CIL instructions in the executable.
Debuggers are able to use the information in the symbol file to determine the source file and line number that should be displayed, and the location in the executable to stop at when you set a breakpoint. Debugging without a symbol file would make it difficult to set breakpoints on a specific line of code or even step through code.
Visual Studio currently provides the option to debug code outside your project source code, such as .NET or third-party code your project calls by specifying the location of the .pdb (and optionally, the source files of the external code). However, in many cases finding the correct symbol files or source code may not be feasible.
By integrating decompilation directly into your debugging experiences we hope to provide developers with the most direct route to troubleshooting issues in 3rd party managed code. We are initially integrating the decompilation experiences into the Module Window, No Symbols Loaded, and Source Not Found page.
There are a several ways in which Visual Studio will try to step into code for which it does not have symbols or source files available:
Under these circumstances, the debugger displays the No Symbols Loaded or Source Not Found page and provides an opportunity to load the necessary symbols or source.
In the following example I have opened a crash dump in Visual Studio and have hit an exception in framework code. I do not have the original source code so If I try to switch to the main thread, I see the No Symbols Loaded page. However, it is now possible to decompile the code directly on this page and see the origins of the exception.
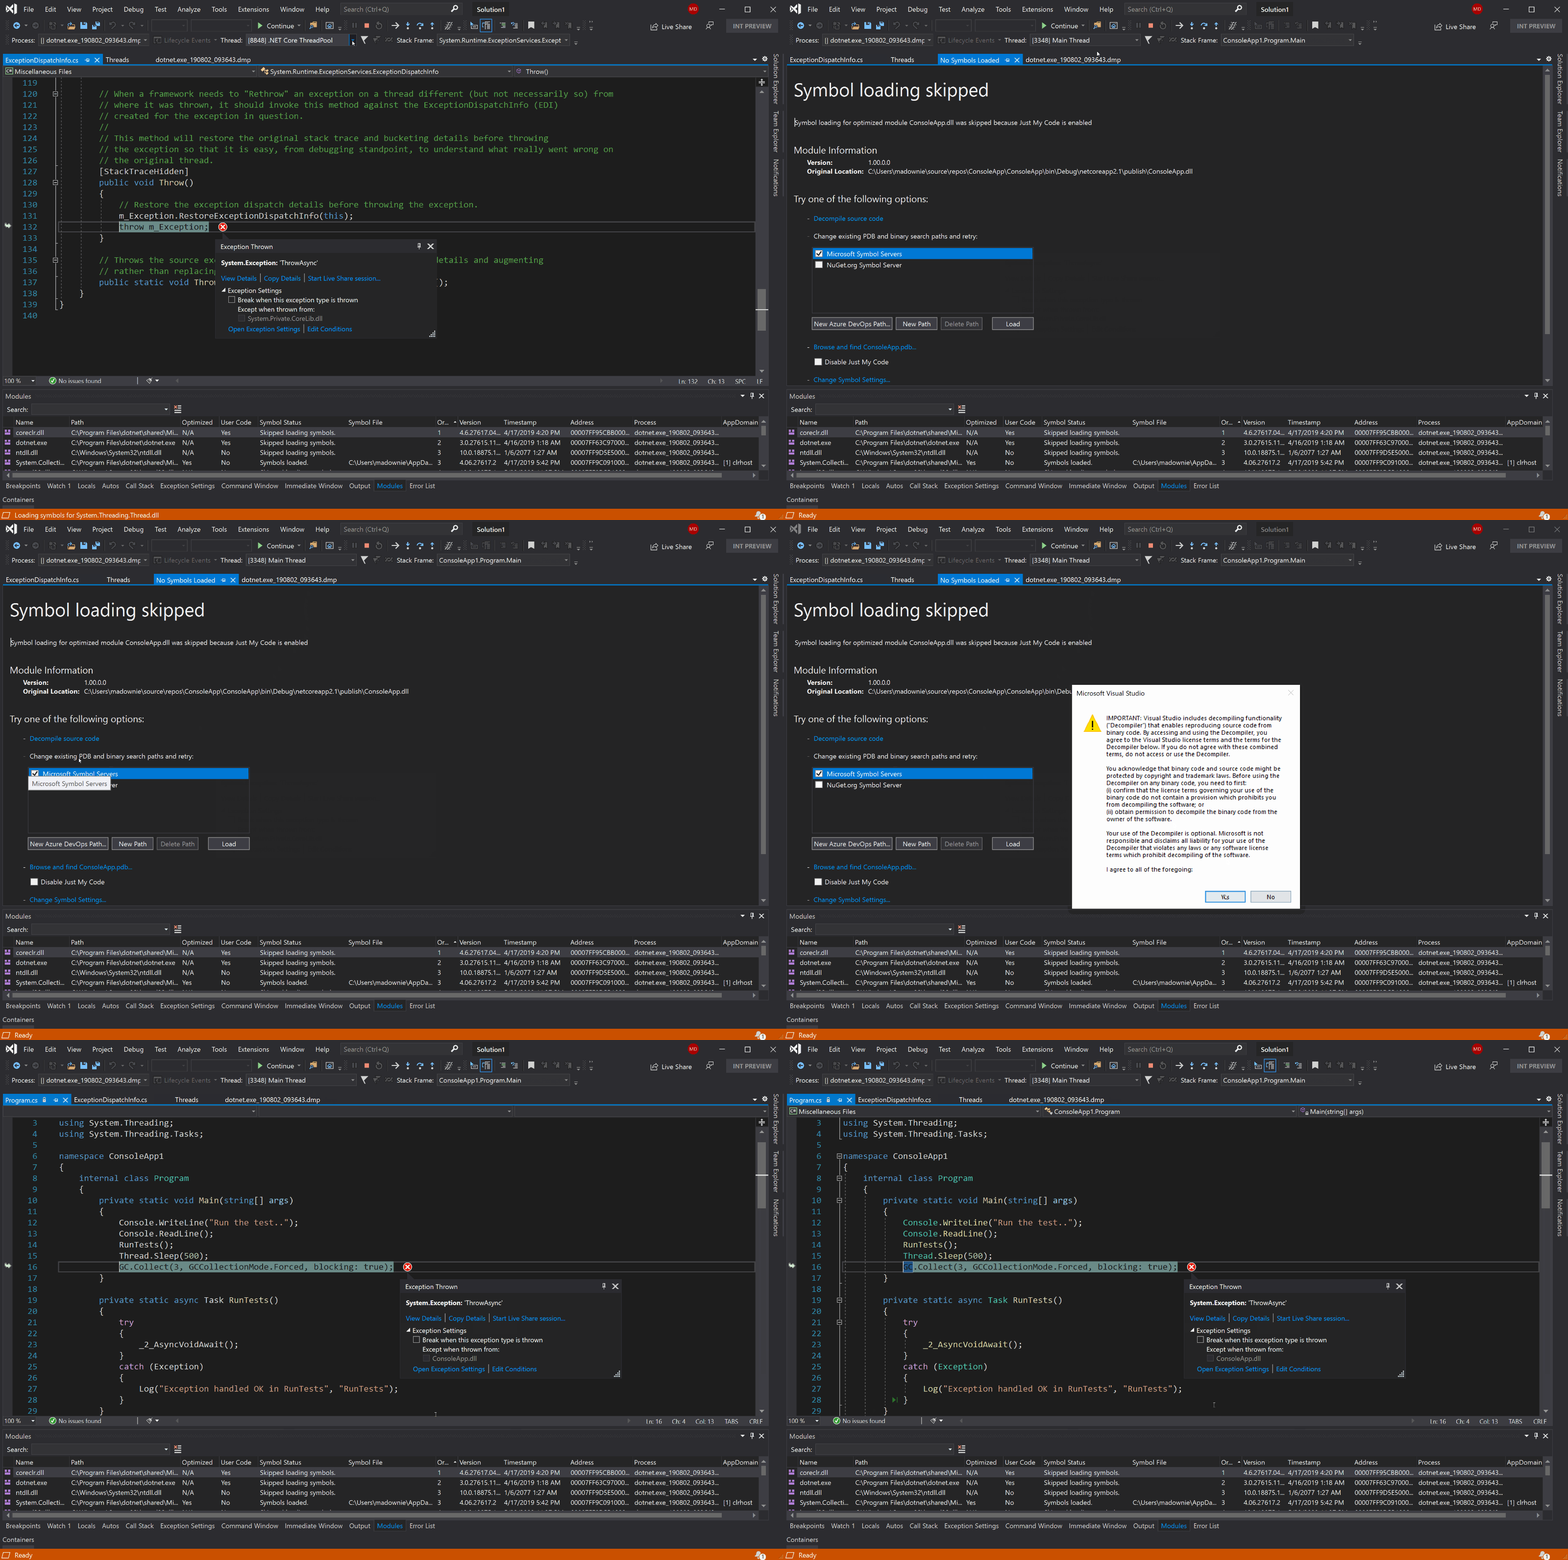
During debugging the Modules window is a great place to get information related to the assemblies and executables currently in memory. To open the Modules window, select Debug > Windows > Modules.
Once you have identified a module that requires decompilation, you can right-click on the module and select “Decompile Source to Symbol File”. This action creates a symbol file containing decompiled source which in turn permits you to step into 3rd party code directly from your source code.
It will also be possible to extract source code to disk by right clicking on a module with embedded source and clicking “Extract Embedded Source”. This process exports source files to a Miscellaneous files folder for further analysis. In the following example I open an extracted .cs file and set a break point to better understand the 3rd party code I am using.
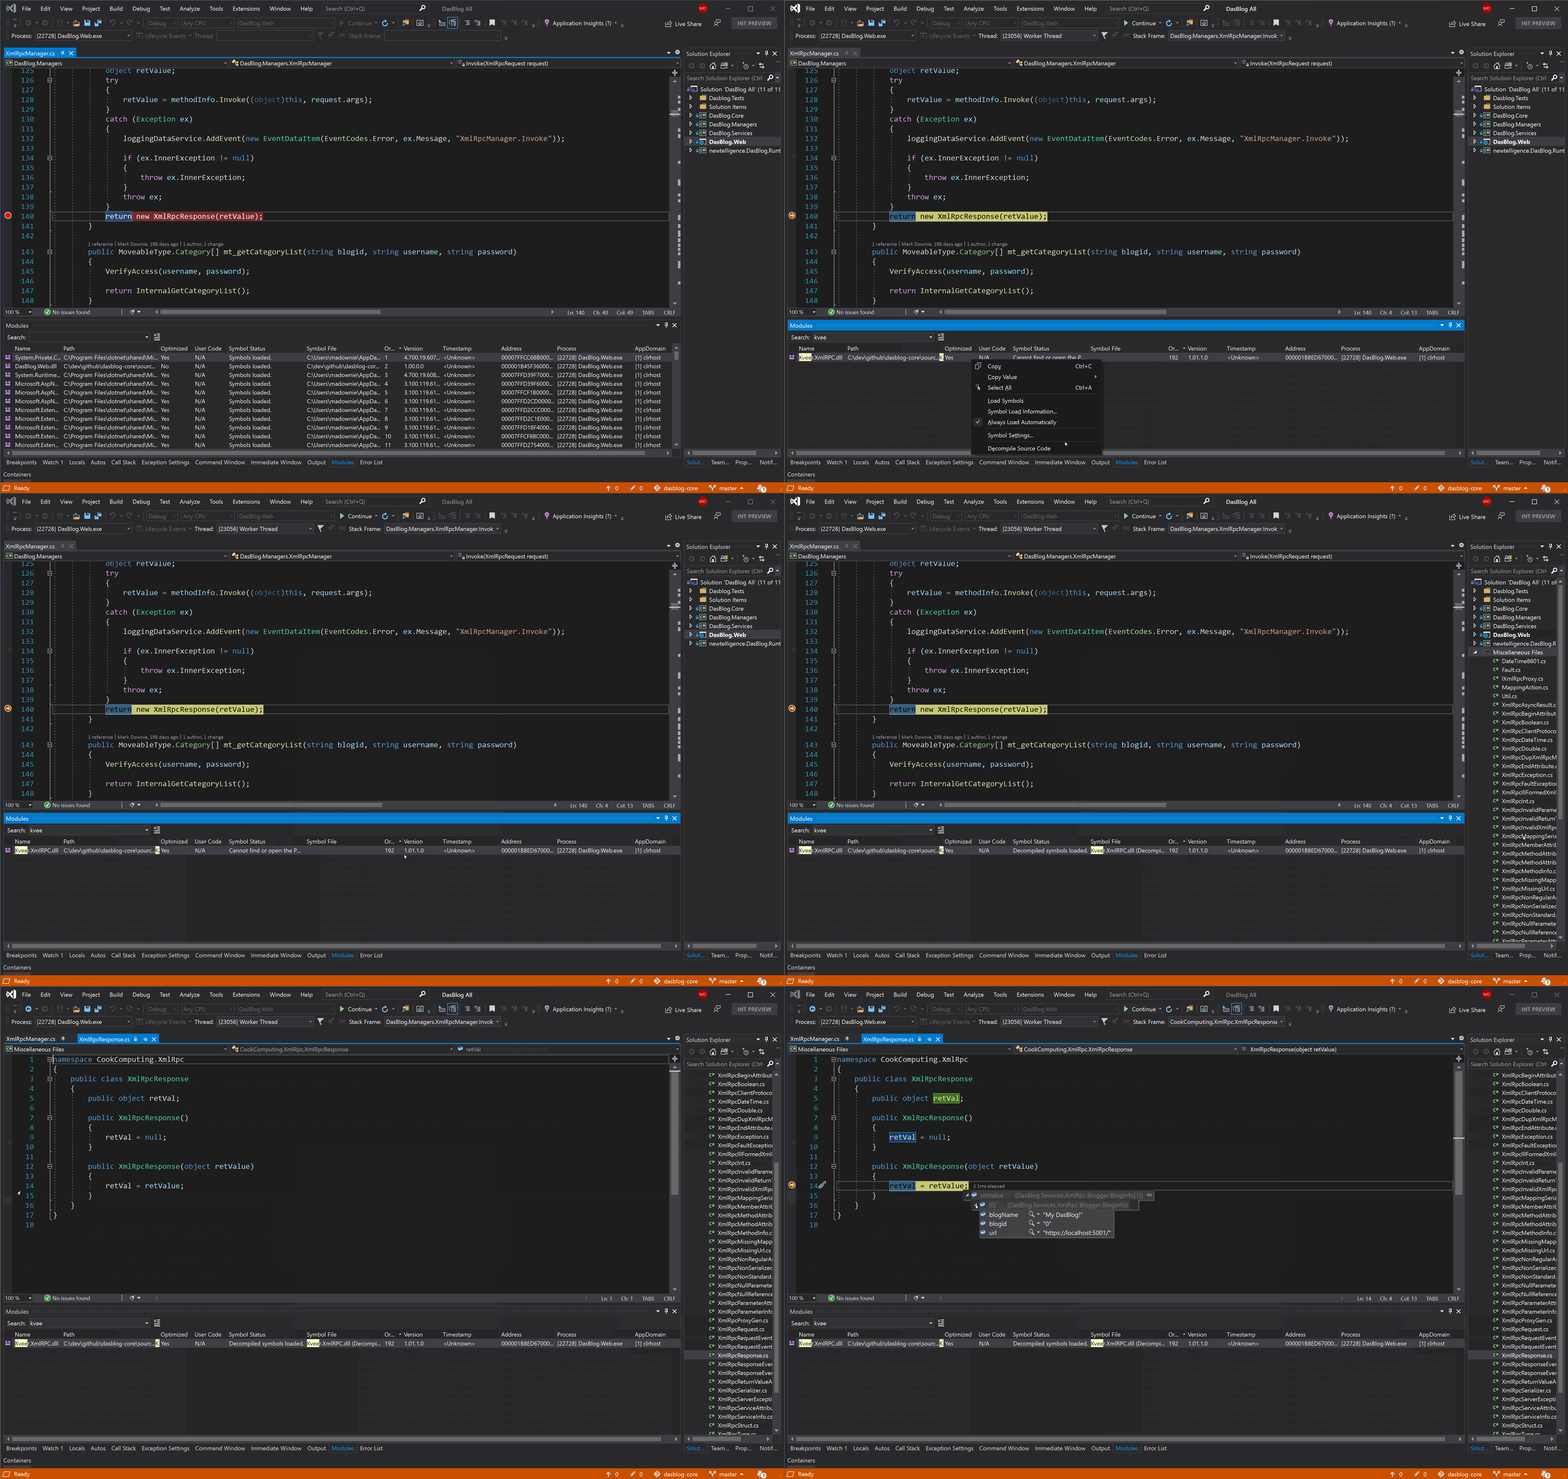
Decompilation of the CIL format, used in .NET assemblies, back into a higher-level language like C# has some inherent limitations:
Download the preview and try out decompilation and let us how it works for you! Please reach out and give us feedback over at Developer Community. Finally, we also have a survey for collecting feedback on the new experiences here. We look forward to hearing from you.
The post Decompilation of C# code made easy with Visual Studio appeared first on Visual Studio Blog.
It's time. It's the feature complete release of the Windows Terminal. Stop reading, and go install it. I'll wait here. You done? OK.
You can download the Windows Terminal from the Microsoft Store or from the GitHub releases page. There's also an unofficial Chocolatey release. I recommend the Store version if possible.
NOTE: Have you already downloaded the Terminal, maybe a while back? Enough has changed that you should delete your profiles.json and start over.
BIG NOTE: Educate yourself about the difference between a console, a terminal, and a shell. This isn't a new "DOS Prompt." Windows Terminal is the view into whatever shell makes you happy.
What's new? A lot. At this point this is the end of the new features before 1.0 though, and now it's all about bug fixes and rock solid stability.
You might initially be underwhelmed. This is a Terminal, it's not going to hold your hand.
The Documentation is just getting started but you can start here! This would be a great way for you to get involved in Open Source, by the way!
Here's the big new change that is very exciting!
You may know you can run Windows Terminal with "wt.exe" and this version now supports Command line arguments! Here's an examples to give you a taste:
wt ; split-pane -p "Windows PowerShell" ; split-pane -H wsl.exe wt -d . wt -d c:githubAt this point you can get as advanced as you want. Make other icons, pin them to the taskbar, have a blast. There's subcommands like new-tab, split-pane, and focus-tab.ter
Please share YOUR blogs, YOUR profiles, YOUR favorite themes and terminal hacks as well!
Sponsor: Have you tried developing in Rider yet? This fast and feature-rich cross-platform IDE improves your code for .NET, ASP.NET, .NET Core, Xamarin, and Unity applications on Windows, Mac, and Linux.
An ever-increasing number of enterprises, even as they adopt a hybrid IT strategy, continue to retain mission-critical data on-premises and look towards the public cloud as an effective offsite for their backups. Azure Backup—Azure’s built-in data-protection solution, provides a simple, secure, and cost-effective mechanism to backup these data-assets over the network to Azure, while eliminating on-premises backup infrastructure. After the initial full backup of data, Azure Backup transfers only incremental changes in the data, thereby delivering continued savings on both network and storage.
With the exponential growth in critical enterprise data, the initial full backups are reaching terabyte scale. Transferring these large full-backups over the network, especially in high-latency network environments or remote offices, may take weeks or even months. Our customers are looking for more efficient ways beyond fast networks to transfer these large initial backups to Azure. Microsoft Azure Data Box solves the problem of transferring large data sets to Azure by enabling the “offline” transfer of data using secure, portable, and easy-to-get Microsoft appliances.
Today, we are thrilled to add the power of Azure Data Box to Azure Backup, and announce the preview program for offline initial backup of large datasets using Azure Data Box! With this preview, customers will be able to use Azure Data Box with Azure Backup to seed large initial backups (up to 80 TB per server) offline to an Azure Recovery Services Vault. Subsequent backups will take place over the network.
This preview is currently available to the customers of Microsoft Azure Recovery Services agent and is a much-awaited addition to the existing support for offline backup using Azure Import/Export Services.
The Azure Data Box addition to Azure Backup delivers core benefits of the Azure Data Box service while offering key advantages over the Azure Import/Export based offline backup.
Seeding your large initial backups using Azure Backup and Azure Data Box involves the following high-level steps.
Azure Data Box and Azure Backup will automatically upload the data to the Azure Recovery Services Vault. Refer to this article for a detailed overview of pre-requisites and steps to take advantage of Azure Data Box when seeding your initial backup offline with Azure Backup.
If you are using System Center Data Protection Manager or Microsoft Azure Backup Server and are interested in seeding large initial backups using Azure Data Box, drop us a line at systemcenterfeedback@microsoft.com for access to early previews.
This post was co-authored by Yair Tor, Principal Program Manager, Azure Networking.
Last November we introduced Microsoft Azure Firewall Manager preview for Azure Firewall policy and route management in secured virtual hubs. This also included integration with key Security as a Service partners, Zscaler, iboss, and soon Check Point. These partners support branch to internet and virtual network to internet scenarios.
Today, we are extending Azure Firewall Manager preview to include automatic deployment and central security policy management for Azure Firewall in hub virtual networks.
Azure Firewall Manager preview is a network security management service that provides central security policy and route management for cloud-based security perimeters. It makes it easy for enterprise IT teams to centrally define network and application-level rules for traffic filtering across multiple Azure Firewall instances that spans different Azure regions and subscriptions in hub-and-spoke architectures for traffic governance and protection. In addition, it empowers DevOps for better agility with derived local firewall security policies that are implemented across organizations.
For more information see Azure Firewall Manager documentation.
Figure one – Azure Firewall Manger Getting Started page
The following comparison table in Figure 2 can assist in making an informed decision:
| Hub virtual network | Secured virtual hub | |
| Underlying resource | Virtual network | Virtual WAN hub |
| Hub-and-Spoke | Using virtual network peering | Automated using hub virtual network connection |
| On-prem connectivity |
VPN Gateway up to 10 Gbps and 30 S2S connections; ExpressRoute |
More scalable VPN Gateway up to 20 Gbps and 1000 S2S connections; ExpressRoute |
| Automated branch connectivity using SDWAN | Not supported | Supported |
| Hubs per region | Multiple virtual networks per region |
Single virtual hub per region. Multiple hubs possible with multiple Virtual WANs |
| Azure Firewall – multiple public IP addresses | Customer provided | Auto-generated (to be available by general availability) |
| Azure Firewall Availability Zones | Supported | Not available in preview. To be available availabilityavailablity |
|
Advanced internet security with 3rd party Security as a service partners |
Customer established and managed VPN connectivity to partner service of choice |
Automated via Trusted Security Partner flow and partner management experience |
|
Centralized route management to attract traffic to the hub |
Customer managed UDR; Roadmap: UDR default route automation for spokes |
Supported using BGP |
| Web Application Firewall on Application Gateway | Supported in virtual network | Roadmap: can be used in spoke |
| Network Virtual Appliance | Supported in virtual network | Roadmap: can be used in spoke |
Figure 2 – Hub virtual network vs. secured virtual hub
Firewall policy is an Azure resource that contains network address translation (NAT), network, and application rule collections as well as threat intelligence settings. It's a global resource that can be used across multiple Azure Firewall instances in secured virtual hubs and hub virtual networks. New policies can be created from scratch or inherited from existing policies. Inheritance allows DevOps to create local firewall policies on top of organization mandated base policy. Policies work across regions and subscriptions.
Azure Firewall Manager orchestrates Firewall policy creation and association. However, a policy can also be created and managed via REST API, templates, Azure PowerShell, and CLI.
Once a policy is created, it can be associated with a firewall in a Virtual WAN Hub (aka secured virtual hub) or a firewall in a virtual network (aka hub virtual network).
Firewall Policies are billed based on firewall associations. A policy with zero or one firewall association is free of charge. A policy with multiple firewall associations is billed at a fixed rate.
For more information, see Azure Firewall Manager pricing.
The following table compares the new firewall policies with the existing firewall rules:
|
Policy |
Rules |
|
|
Contains |
NAT, Network, Application rules, and Threat Intelligence settings |
NAT, Network, and Application rules |
|
Protects |
Virtual hubs and virtual networks |
Virtual networks only |
|
Portal experience |
Central management using Firewall Manager |
Standalone firewall experience |
|
Multiple firewall support |
Firewall Policy is a separate resource that can be used across firewalls |
Manually export and import rules or using 3rd party management solutions |
|
Pricing |
Free |
|
|
Supported deployment mechanisms |
Portal, REST API, templates, PowerShell, and CLI |
Portal, REST API, templates, PowerShell, and CLI |
|
Release Status |
Preview |
General Availability |
Figure 3 – Firewall Policy vs. Firewall Rules
For more information on topics covered here, see the following blogs, documentation, and videos:
Azure Firewall central management partners: