Quantcast
Channel: Category Name
Viewing all 5971 articles
Browse latest View live

AVX2 floating point improvements in Visual Studio 2019 version 16.5

$
0
0

In Visual Studio 2019 We’ve been working hard on optimizing floating point operations with AVX2 instructions. This post will outline work done so far and recent improvements made in version 16.5.

The speed of floating point operations directly impacts the frame rate of video games. Newer x86 and x64 chips have added special vector Fused Multiply Add instructions to improve and parallelize the performance of floating point operations. Starting with Visual Studio 2019, the compiler will aggressively identify opportunities to use the new floating point instructions and perform constant propagation for such instructions when the /fp:fast flag is passed. 

With Visual Studio 2019 version 16.2, the heuristics for vectorizing floating point operations improved and some floating point operations could be reduced down to a constant. Natalia Glagoleva described these and a number of game performance improvements last summer. 

With Visual Studio 2019 version 16.5, we improved the SSA optimizer to recognize more opportunities to use AVX2 instructions and improved constant propagation for vector operations involving shuffle. 

All of the following samples are compiled for x64 with these switches: /arch:AVX2 /O2 /fp:fast /c /Fa 

Constant Propagation for Multiply 

Starting with Visual Studio 2019 version 16.2, some floating point vector operations could be reduced to a constant if the initial vectors were known at compile time. A good example is the inverse square root function. 

#include 
#include 
float InvSqrt(float F)
{
    const __m128 fOneHalf = _mm_set_ss(0.5f);
    __m128 Y0, X0, X1, X2, FOver2;
    float temp;
    Y0 = _mm_set_ss(F);
    X0 = _mm_rsqrt_ss(Y0);
    FOver2 = _mm_mul_ss(Y0, fOneHalf);
    X1 = _mm_mul_ss(X0, X0);
    X1 = _mm_sub_ss(fOneHalf, _mm_mul_ss(FOver2, X1));
    X1 = _mm_add_ss(X0, _mm_mul_ss(X0, X1));
    X2 = _mm_mul_ss(X1, X1);
    X2 = _mm_sub_ss(fOneHalf, _mm_mul_ss(FOver2, X2));
    X2 = _mm_add_ss(X1, _mm_mul_ss(X1, X2));
    _mm_store_ss(&temp, X2);
    return temp;
} 

float ReturnInvSqrt()
{
    return InvSqrt(4.0);
}

Starting with Visual Studio 16.2, ReturnInvSqrt could be reduced to a single constant: 

17 instructions reduced to a single move instruction

Constant Propagation for Shuffle 

Another common vector operation is to create a normalized form of the vector, so that it has a length of one. The length of a vector is the square root of its dot product. The easiest way to calculate the dot product involves a shuffle operation. 

__m128  VectorDot4(const __m128 Vec1, const __m128 Vec2)
{
    __m128 Temp1, Temp2;
    Temp1 = _mm_mul_ps(Vec1, Vec2);
    Temp2 = _mm_shuffle_ps(Temp1, Temp1, 0x4E);
    Temp1 = _mm_add_ps(Temp1, Temp2);
    Temp2 = _mm_shuffle_ps(Temp1, Temp1, 0x39);
    return _mm_add_ps(Temp1, Temp2); 
} 

__m128  VectorNormalize_InvSqrt(const __m128 V)
{
    const __m128 Len = VectorDot4(V, V);
    const float LenComponent = ((float*) &Len)[0];
    const float rlen = InvSqrt(LenComponent);
    return _mm_mul_ps(V, _mm_load1_ps(&rlen));
}

Even in Visual Studio version 16.0 the optimizer could propagate constants through shuffle operations. However, due to some ordering issues with the original implementation of fused multiply add constant propagation, constant propagation for shuffle prevented constant propagation for fused multiply add.

Starting with Visual Studio 16.5, constant propagation can handle cases that involve both shuffle and fused multiply add. This means normalizing the inverse square root of a vector known at compile time can be completely reduced down to a constant if the input is known at compile time. 

__m128 ReturnVectorNormalize_InvSqrt() {
    __m128 V0 = _mm_setr_ps(2.0f, -2.0f, 2.0f, -2.0f);
    return VectorNormalize_InvSqrt(V0);
}

 24 vector instructions reduced to a single move instruction.

We’d love for you to download the latest version of Visual Studio 2019 and give these new improvements a try. As always, we welcome your feedback. We can be reached via the comments below or via email (visualcpp@microsoft.com). If you encounter problems with Visual Studio or MSVC, or have a suggestion for us, please let us know through Help > Send Feedback > Report A Problem / Provide a Suggestion in the product, or via Developer Community. You can also find us on Twitter (@VisualC). 

The post AVX2 floating point improvements in Visual Studio 2019 version 16.5 appeared first on C++ Team Blog.


.NET Core 3.0 will reach End of Life on March 3, 2020

$
0
0

.NET Core 3.0 will reach end of life on March 3, 2020. It is a “Current” release and is superseded by .NET Core 3.1, which was released on December 3, 2019. After that time, .NET Core patch updates will no longer include updated packages .NET Core 3.0. .NET Core 3.1 is a long-term supported (LTS) release (supported for at least 3 years). We recommend that you move any .NET Core 3.0 applications and environments to .NET Core 3.1 now. It’ll be an easy upgrade in most cases.

Upgrade to .NET Core 3.1

  • Open the project file (the *.csproj, *.vbproj, or *.fsproj file).
  • Change the target framework value from netcoreapp3.0 to netcoreapp3.1. The target framework is defined by the <TargetFramework> or <TargetFrameworks> element.
  • For example, change <TargetFramework>netcoreapp3.0</TargetFramework> to <TargetFramework>netcoreapp3.1</TargetFramework>.

Microsoft Support Policy

Microsoft has a published support policy for .NET Core. It includes policies for two release types: LTS and Current.

  • LTS releases include features and components that have been stabilized, requiring few updates over a longer support release lifetime. These releases are a good choice for hosting applications that you do not intend to update often.
  • Current releases include features and components that are new and may undergo future change based on feedback. These releases are a good choice for applications in active development, giving you access to the latest features and improvements. You need to upgrade to later .NET Core releases more often to stay in support.

Both types of releases receive critical fixes throughout their lifecycle, for security, reliability, or to add support for new operating system versions. You must stay up-to-date with the latest patches to qualify for support.

See .NET Core Supported OS Lifecycle Policy to learn about Windows, macOS and Linux versions that are supported for each .NET Core release.

The post .NET Core 3.0 will reach End of Life on March 3, 2020 appeared first on .NET Blog.

The Performance Benefits of Final Classes

$
0
0

The final specifier in C++ marks a class or virtual member function as one which cannot be derived from or overriden. For example, consider the following code: 

 struct base { 
  virtual void f() const = 0; 
}; 
 
struct derived final : base { 
  void f() const override {} 
};

If we attempt to write a new class which derives from derived then we get a compiler error: 

struct oh_no : derived { 
};

<source>(9): error C3246: 'oh_no': cannot inherit from 'derived' as it has been declared as 'final'
<source>(5): note: see declaration of 'derived'

The final specifier is useful for expressing to readers of the code that a class is not to be derived from and having the compiler enforce this, but it can also improve performance through aiding devirtualization. 

Devirtualization 

Virtual functions require an indirect call through the vtable, which is more expensive than a direct call due to interactions with branch prediction and the instruction cache, and also the prevention of further optimizations which could be carried out after inlining the call.  

Devirtualization is a compiler optimization which attempts to resolve virtual function calls at compile time rather than runtime. This eliminates all the issues noted above, so it can greatly improve the performance of code which uses many virtual calls1. 

Here is a minimal example of devirtualization: 

struct dog { 
  virtual void speak() { 
    std::cout << "woof"; 
  } 
}; 


int main() { 
  dog fido; 
  fido.speak(); 
}

In this code, even though dog::speak is a virtual function, the only possible result of main is to output ”woof”. If you look at the compiler output you’ll see that MSVC, GCC, and Clang all recognize this and inline the definition of dog::speak into main, avoiding the need for an indirect call. 

The Benefit of final 

The final specifier can provide the compiler with more opportunities for devirtualization by helping it identify more cases where virtual calls can be resolved at compile time. Coming back to our original example: 

struct base { 
  virtual void f() const = 0; 
}; 
 
struct derived final : base { 
  void f() const override {} 
};

Consider this function: 

void call_f(derived const& d) { 
  d.f(); 
}

Since derived is marked final the compiler knows it cannot be derived from further. This means that the call to f will only ever call derived::f, so the call can be resolved at compile time. As proof, here is the compiler output for call_f on MSVC when derived or derived::f are marked as final: 

ret 0 

You can see that the derived::f has been inlined into the definition of call_f. If we were to take the final specifier off the definition, the assembly would look like this: 

mov rax, QWORD PTR [rcx] 
rex_jmp QWORD PTR [rax]

This code loads the vtable from d, then makes an indirect call to derived::f through the function pointer stored at the relevant location. 

The cost of a pointer load and jump may not look like much since it’s just two instructions, but remember that this may involve a branch misprediction and/or instruction cache miss, which would result in a pipeline stall. Furthermore, if there was more code in call_f or functions which call it, the compiler may be able to optimize it much more aggressively given the full visibility of the code which will be executed and the additional analysis which this enables. 

Conclusion 

Marking your classes or member functions as final can improve the performance of your code by giving the compiler more opportunities to resolve virtual calls at compile time. 

Consider if there are any places in your codebases which would benefit from this and measure the impact!  


1 http://assemblyrequired.crashworks.org/how-slow-are-virtual-functions-really/ 

  https://sites.cs.ucsb.edu/~urs/oocsb/papers/oopsla96.pdf 

  https://stackoverflow.com/questions/449827/virtual-functions-and-performance-c 

The post The Performance Benefits of Final Classes appeared first on C++ Team Blog.

February ML.NET Model Builder Updates

$
0
0

ML.NET is a cross-platform, machine learning framework for .NET developers. Model Builder is the UI tooling in Visual Studio that uses Automated Machine Learning (AutoML) to train and consume custom ML.NET models in your .NET apps. Together, you can now create custom machine learning models for scenarios like sentiment analysis, price prediction, and more. All this without any machine learning experience or even leaving the .NET development environment!

ML.NET Model Builder

This release of Model Builder comes with bug fixes and several exciting new features:

  • Azure training (image classification) – harness the power of Azure to scale out training for image classification.
  • Recommendation scenario – locally train recommendation models (e.g. to recommend products).

Azure Training (Image Classification)

We added the image classification scenario to ML.NET Model Builder late last year. Which enabled you to locally train image classification models with your own images. However, you may have noticed the limitations of training on images when using your CPU, particularly the duration of training time.

This month, we are excited to release the ability to train image classification models in Azure Machine Learning directly from Model Builder. Take advantage of the cloud and get even faster, more accurate results!

Let’s look at the dogs vs. cats example. In Model Builder, after selecting the Image Classification scenario and uploading your local dataset, you have the following training options:

ML.NET Model Builder Image train step

To train in Azure, set up an Azure Machine Learning workspace and create an experiment. Do that right in the UI:

Azure Model Builder Image aml dialog

There are several concepts that are specific to Azure and Azure Machine Learning. Learn about workspaces, computes, and experiments in our Docs.

After setting up your Azure ML workspace and experiment settings, click Start training to kick off training in Azure. This will then:

  1. Create a new experiment.
  2. Upload your data to Azure.
  3. Begin training with Azure AutoML.

The status will be displayed in the Progress section and Output window. On top of that, you will be provided with a link to the Azure ML portal for more information about the training status:

Image aml train status

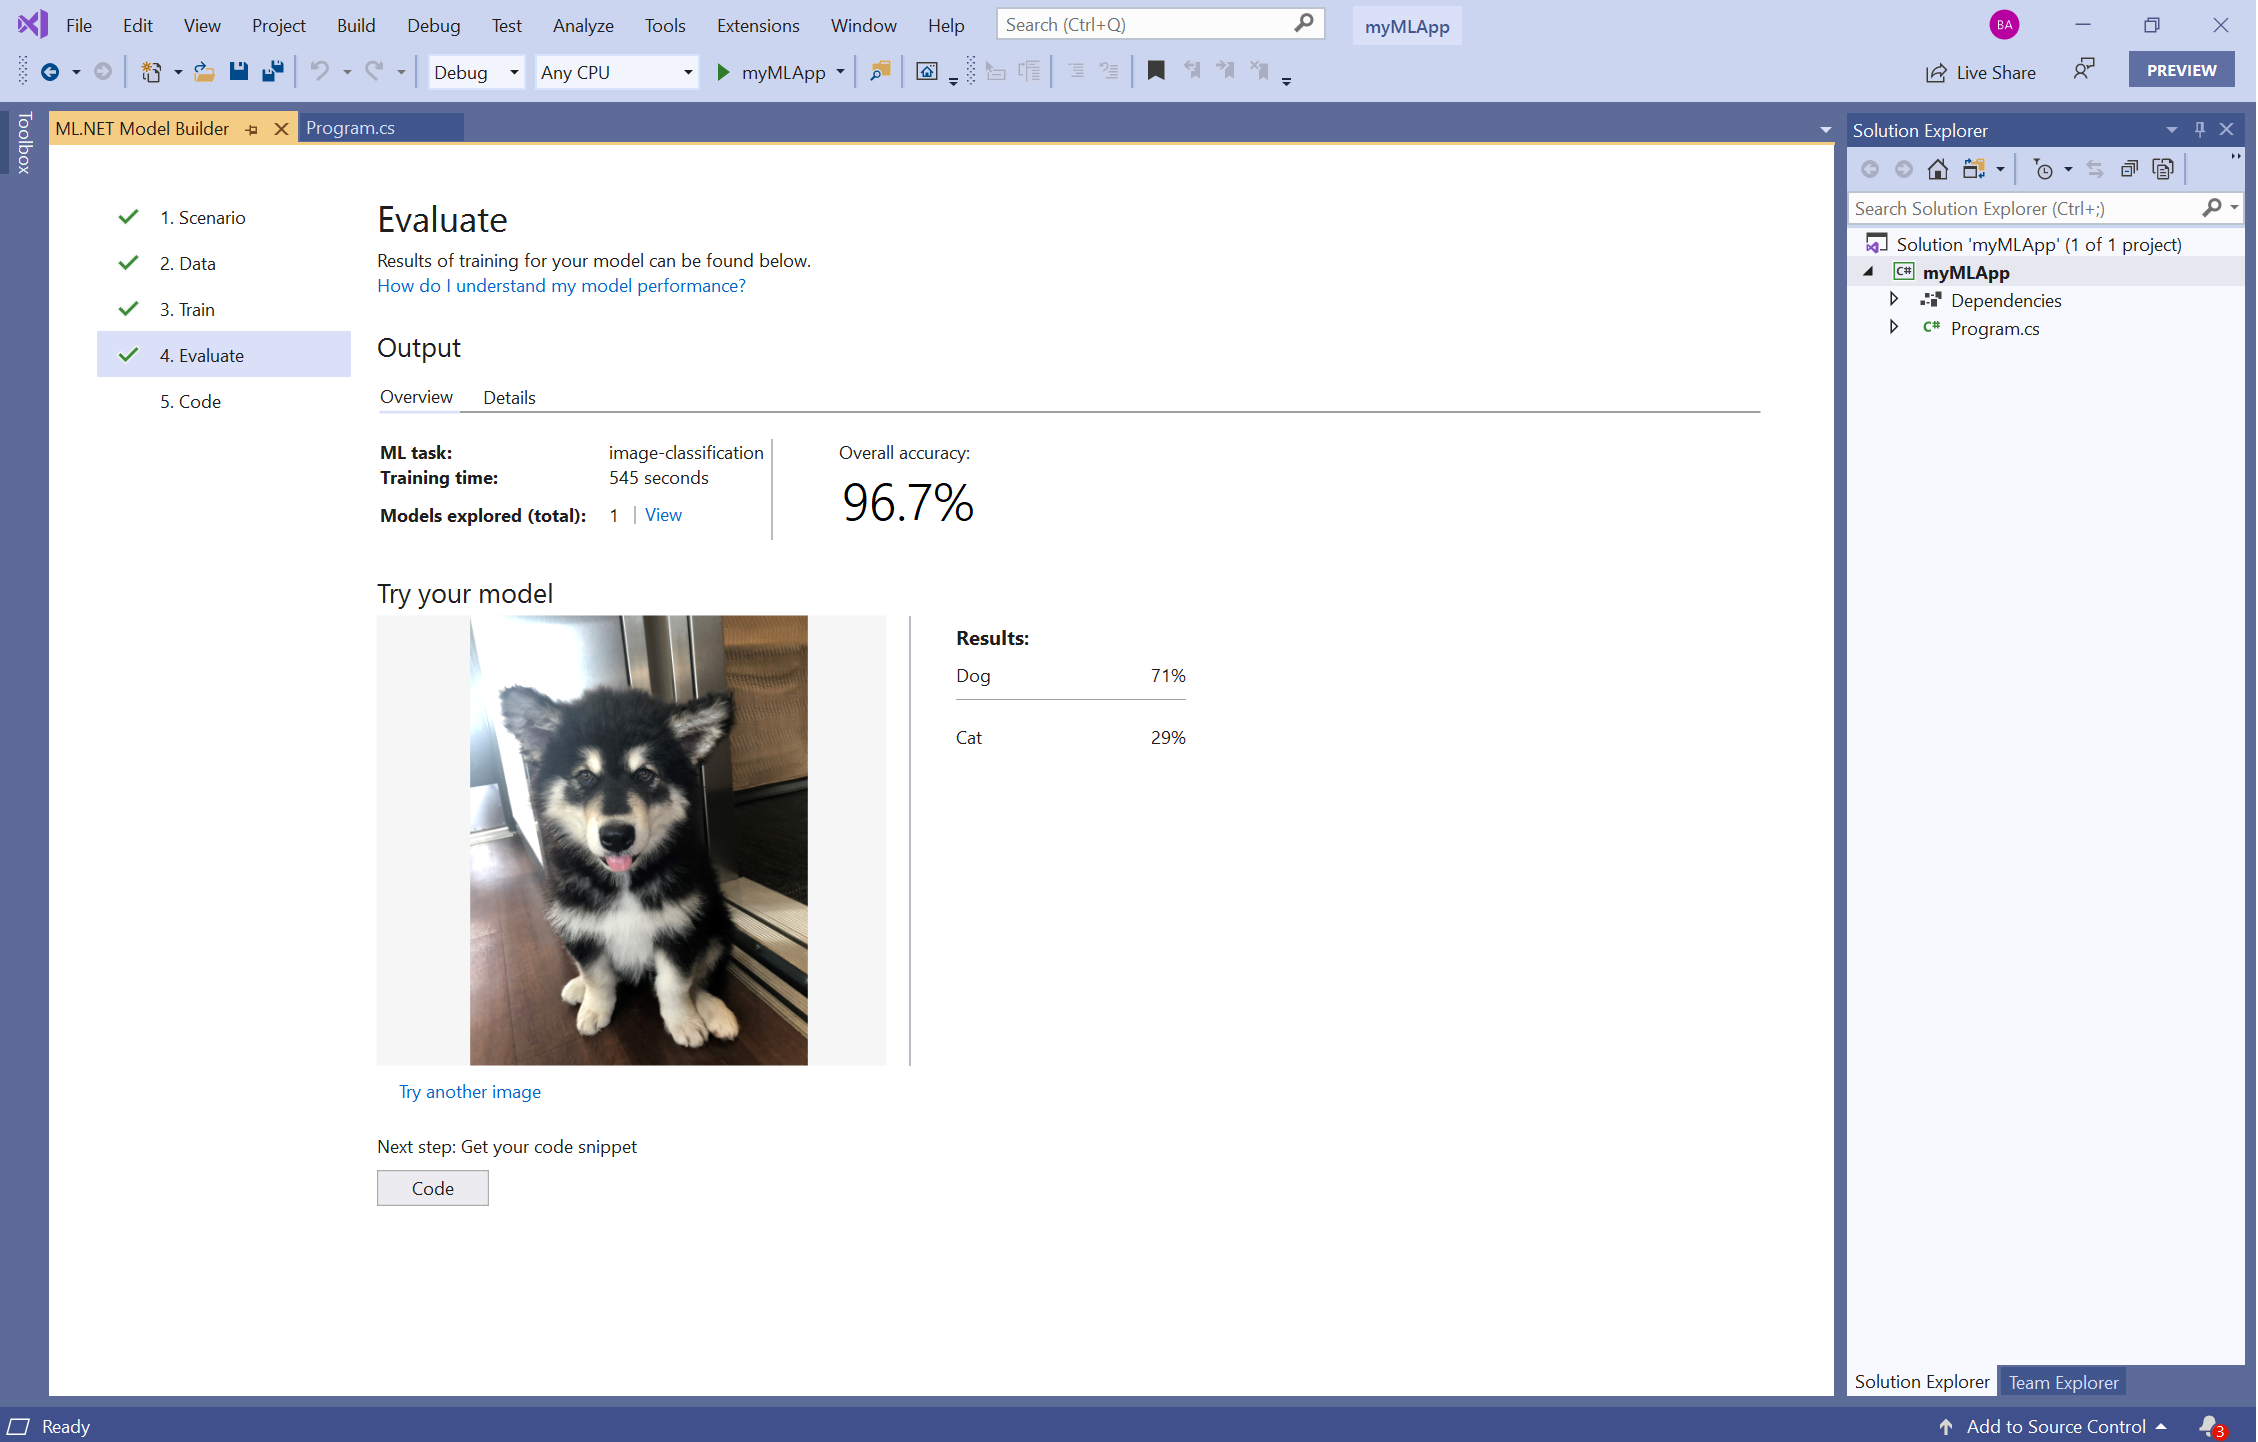
Once training in Azure is complete, the model is downloaded locally to your machine (both an ML.NET model and an ONNX model). Then, try out your model in the Evaluate step and generate the model consumption code to use the ML.NET model to make predictions. Just like with local image classification training:

ML.NET Model Builder Image aml eval

Recommendation Scenario

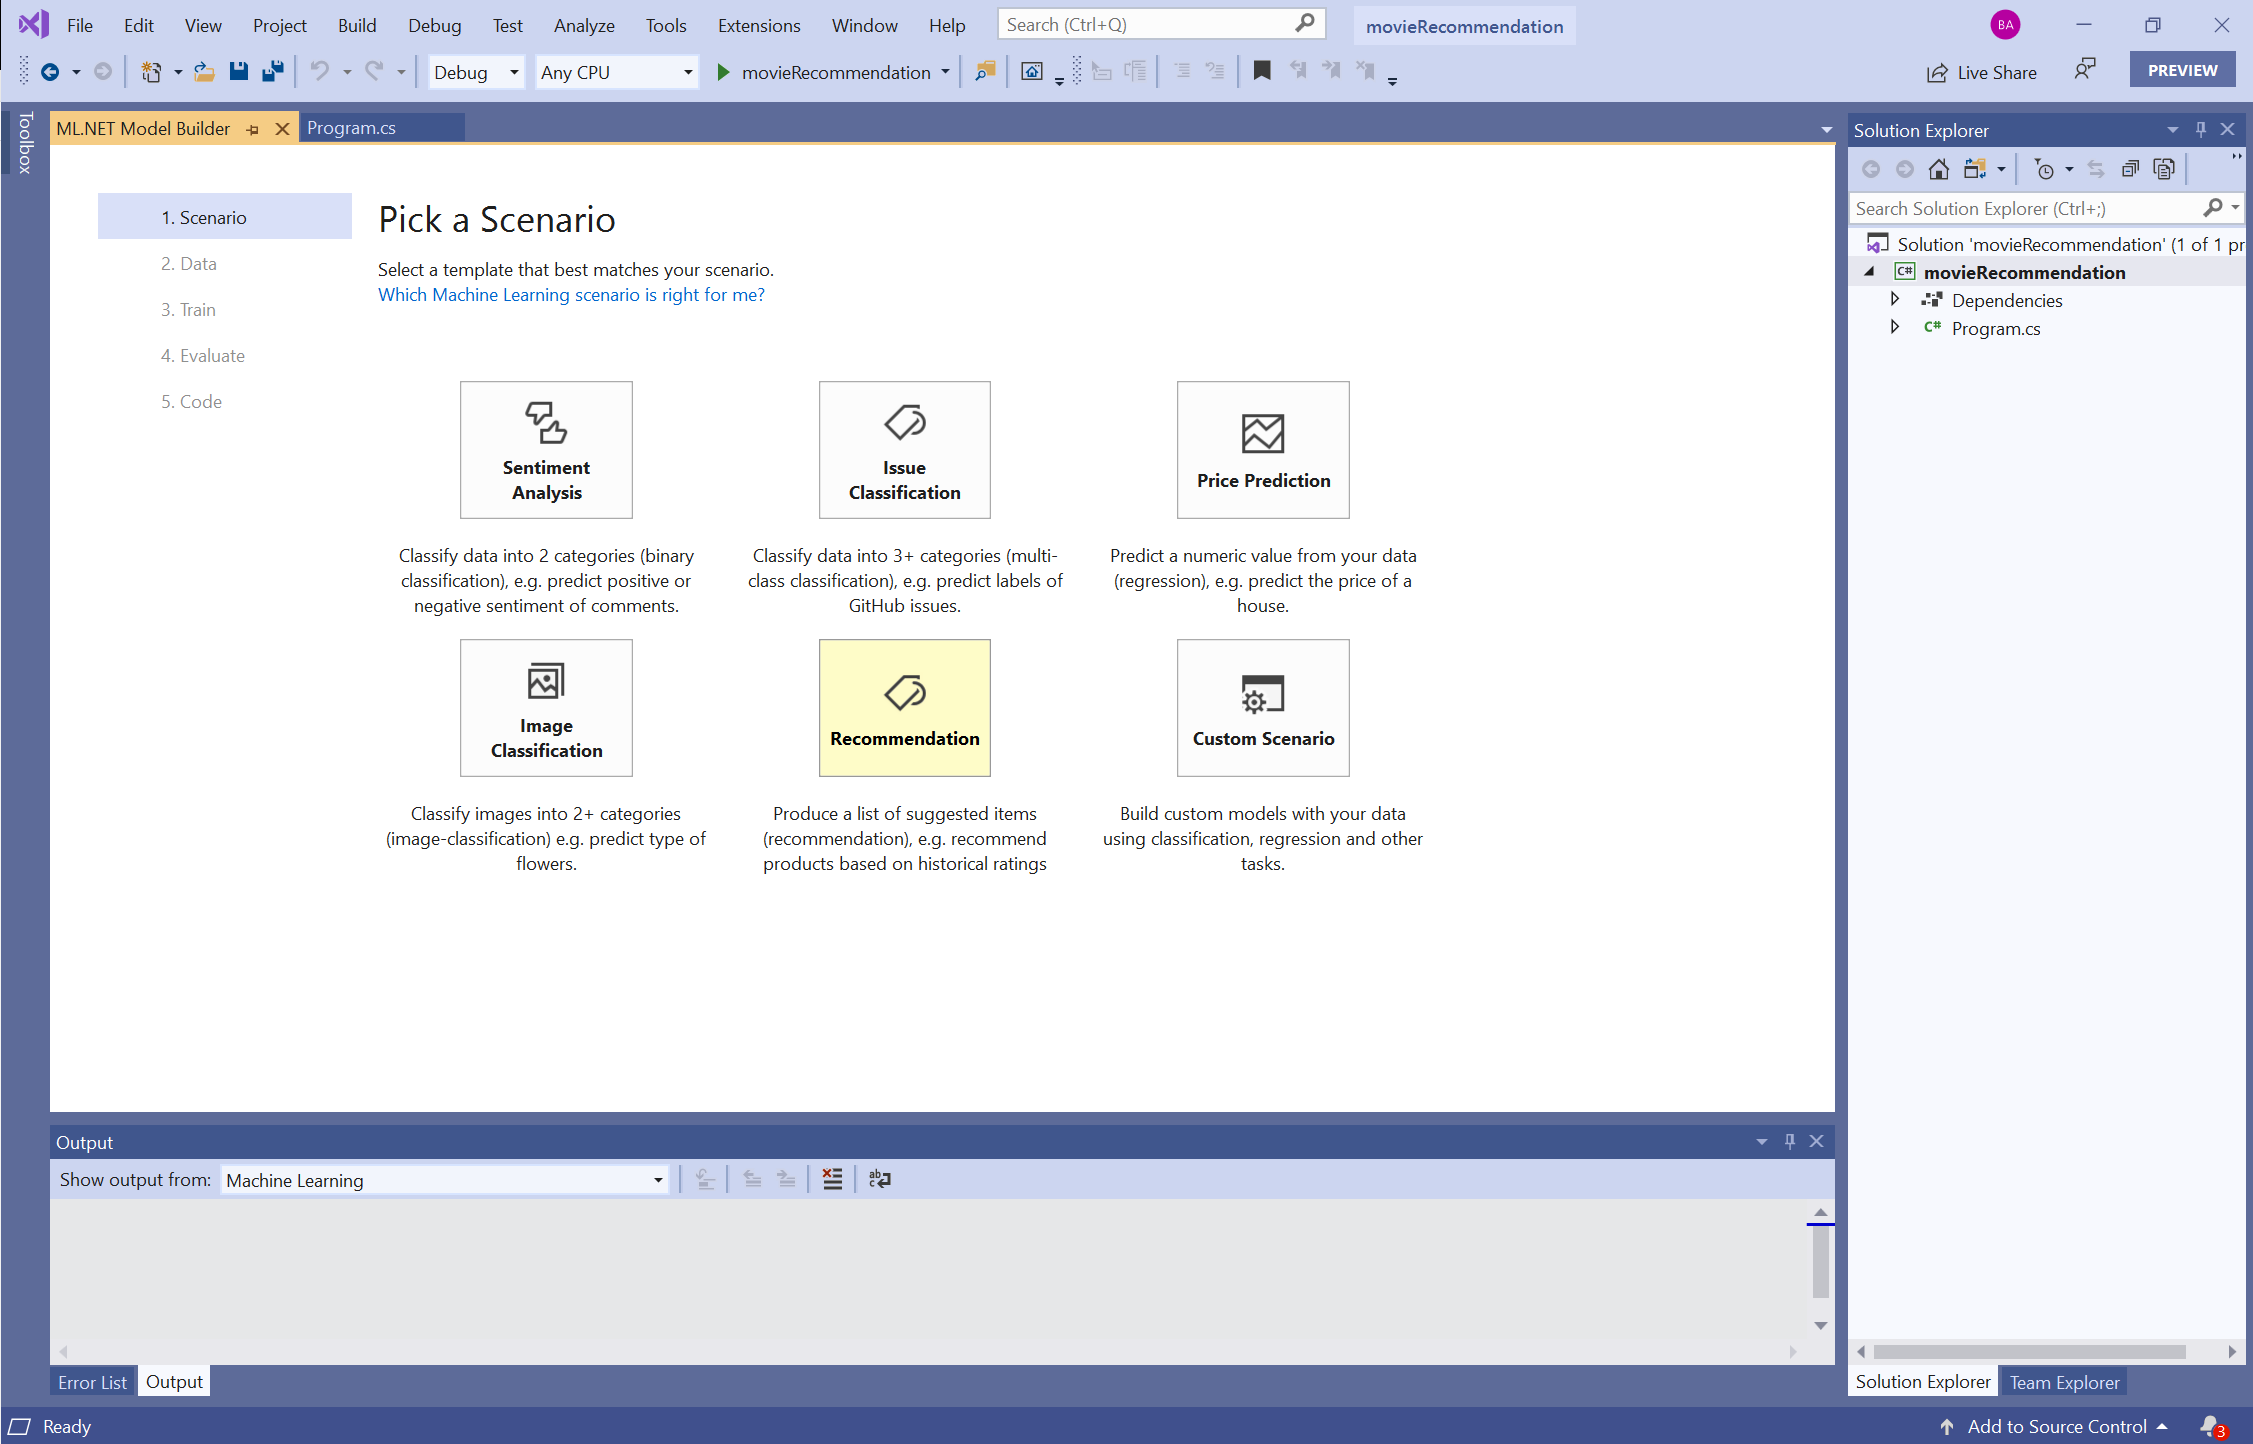
Additionally, we have also added a Recommendation scenario to Model Builder. This locally trains ML.NET models for recommending items (such as products or movies) to users:

Model Builder Image rec scenario

With this recommendation model, you can predict what rating a user will give to specific items based on historical item rating data. Then get the top rated / recommended items for a particular user. This type of recommendation in Model Builder uses the matrix factorization algorithm. Learn more in our documentation.

Matrix factorization has several different algorithm options which can be tuned to better suit your data needs. Model Builder tries out different combinations of these options in the given amount of training time. After that, chooses the combination of options which gives the best performance (measured by RMSE).

To use the Recommendation scenario in Model Builder, your dataset must have three specific columns:

  1. User column
  2. Item column
  3. Rating column

Let’s use movie recommendation as an example. With a dataset (taken from the MovieLens dataset) which has columns for userId, movie, timestamp, and ratings. In the Data screen in Model Builder, the Column to predict is the ratings column. The User column is the userId column. And the Item column is the movie column (the timestamp column is ignored):

Model Builder Image rec data

After the model is finished training, try out the recommendation model in the Evaluate screen in Model Builder. Specifically, input a userId and a movie to get the predicted rating that the user will give that particular movie. As well as the top 5 recommended movies for the specified user:

Image rec eval

Share Your Feedback

Since Model Builder is still in Preview, your feedback is super important in driving the direction of this tool and ML.NET in general. We would love to hear your feedback!

If you run into any issues, please let us know by creating an issue in our GitHub repo.

Get Started with ML.NET Model Builder

Download ML.NET Model Builder in the VS Marketplace. Additionally, find it in the Extensions menu of Visual Studio.

Learn more in the ML.NET Docs. Get started with this intro tutorial.

Not currently using Visual Studio? Try out the ML.NET CLI. (Image classification and recommendation will be implemented in the next CLI release.)

The post February ML.NET Model Builder Updates appeared first on .NET Blog.

The Spring 2020 Roadmap for Visual Studio published

$
0
0

The Visual Studio roadmap has been updated to provide a peek into the work planned for Visual Studio through June 2020. It captures significant capabilities that we plan to add, but it’s not a comprehensive feature list. Our goal is to clarify what’s coming so you can plan for upgrades and provide feedback on which features would make Visual Studio a more productive development environment for you and your team.

Our roadmap is driven largely by what we learn through ongoing customer research, as well as the feedback we get via our Developer Community portal. These features and time frames represent our current plans but may change based on what we learn. If there are features that are particularly important to you, please be sure to vote and comment on the features in the Developer Community portal.

We often get feedback on the importance of an up-to-date roadmap for Visual Studio. We aim to publish updates more frequently going forward and we’re putting processes in place to make that happen. In that light, we’d highly appreciate if you would take a brief survey to let us know how to best handle the roadmap going forward.

The post The Spring 2020 Roadmap for Visual Studio published appeared first on Visual Studio Blog.

Azure IoT Introduces seamless integration with Cisco IoT

$
0
0

The pace of technological change is relentless across all markets. Edge computing continues to play an essential role in allowing data to be managed closer to its source, where workloads can range from basic services like data filtering and de-duplication to advanced capabilities like event-driven processing. Gartner estimates that by 2025 75 percent of Enterprise data will be generated at the Edge. As computing resources and IoT networking devices become more powerful, the ability to manage vast amounts of data near the edge will mean infrastructure and operations teams are required to manage more advanced data workloads, while keeping pace with business needs.

Our leadership in the cloud and the Internet of Things is no coincidence and they are intertwined. These technology trends are accelerating ubiquitous computing and bringing unparalleled opportunities for transformation across industries. Our goal has been to create trusted, scalable solutions that our customers and partners can build on, no matter where they are starting in their IoT journey.

What if there was an integrated set of hardware, software, and cloud capabilities that allowed seamless connectivity and streamlined edge data flow directly from essential operations like autonomous driving, robotic factory lines, and oil and gas refinery operations into Azure IoT? This is where Azure IoT is partnering with Cisco to provide to customers a pre-integrated Cisco Edge to Microsoft Azure IoT Hub solution.

Value of the partnership, Microsoft Azure IoT and Cisco IoT

With both Azure IoT and Cisco IoT being known as leaders in the industrial IoT market, we have decided to team up to share the availability of an integrated Azure IoT solution, that provides the necessary software, hardware, and cloud services that businesses need to rapidly launch IoT initiatives and quickly realize business value. Using software-based intelligence pre-loaded onto Cisco IoT network devices, telemetry data pipelines from industry-standard protocols like OPC-Unified Architecture (OPC-UA) and Modbus can be easily established using a friendly UI directly into Azure IoT Hub. Services like Microsoft Azure Stream Analytics, Microsoft Azure Machine Learning, and Microsoft Azure Notification Hub services can be used to quickly build IoT applications for the enterprise. Additional telemetry processing is also supported by Cisco through local scripts developed in Microsoft Visual Studio, where filtered data can also be uploaded directly into Azure IoT Hub. This collaboration provides customers with a fully integrated solution that will give access to powerful design tools, global connectivity, advance analytics, and cognitive services for analyzing IoT data.

These capabilities will help to illuminate business opportunities across many industries. Using Cisco Edge Intelligence software to connect to Azure IoT Hub and Device Provisioning Services enable simple device provisioning and management at scale, without the headache of a complex setup.

Customers across industries want to leverage IoT data to deliver new use-cases and solve business problems.

“This partnership between Cisco and Azure IoT will significantly simplify customer deployments. Customers can now securely connect their assets, and simply ingest and send IoT data to the cloud. Our IoT Gateways will now be pre-integrated to take advantage of the latest in cloud technology from Azure. Cisco and Microsoft are happy to help our customers realize the value of their IoT projects faster than ever before. Our early field customer, voestalpine, is benefiting from this integration as they digitize their operations to improve production planning and operational efficiencies.”—Vikas Butaney, Cisco IoT VP of Product Management

“At voestalpine, we are going through a digital journey to rethink and innovate manufacturing processes to bring increased operational efficiency. We face challenges to consistently and securely extract data from these machines and deliver the right data to our analytics applications. We are validating Cisco’s next-generation edge data software, Cisco Edge Intelligence along with Azure IoT services for our cloud software development. Cisco’s out-of-the-box edge solution with Azure IoT services helps us accelerate our digital journey.”—Stefan Pöchtrager, Enterprise Architect, voestalpine AG

By enabling Azure IoT with Cisco IoT network devices infrastructure, IT, and operations teams can quickly take advantage of a wide variety of hardware and easily scalable telemetry collection from connected assets, to kickstart their Azure IoT application development. Our customers can now augment their existing Cisco networks with Azure IoT ready gateways across multiple industries and use cases, without compromising the ability to implement data control and security that both Microsoft and Cisco are known for.

Please visit Microsoft Azure for more information regarding Azure IoT.

Please visit Cisco Edge Intelligence for more information regarding Cisco IoT.

Empowering the NFL with Microsoft Surface and Microsoft Teams

Enabling Endpoint Routing in OData

$
0
0

Few months ago we announced an experimental release of OData for ASP.NET Core 3.1, and for those who could move forward with their applications without leveraging endpoint routing, the release was considered final, although not ideal.

But for those who have existing APIs or were planning to develop new APIs leveraging endpoint routing, the OData 7.3.0 release didn’t quiet meet their expectations without having to disable endpoint routing.

Understandably this was quiet a trade off between leveraging the capabilities of endpoints routing versus being able to use OData. Therefore in the past couple of months the OData team in coordination with ASP.NET team have worked together to achieve the desired compatibility between OData and Endpoint Routing to work seamlessly and offer the best capabilities of both worlds to our libraries consumers.

Today, we announce that this effort is over! OData release of 7.4.0 now allows using Endpoint Routing, which brings in a whole new spectrum of capabilities to take your APIs to the next level with the least amount of effort possible.


Getting Started

To fully bring this into action, we are going to follow the Entity Data Model (EDM) approach, which we have explored previously by disabling Endpoint Routing, so let’s get started.

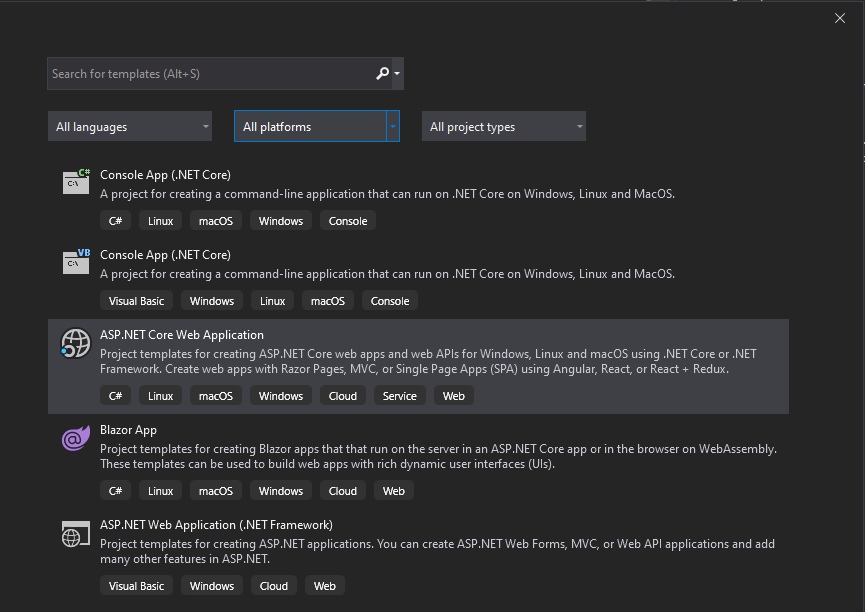
We are going to create an ASP.NET Core Application from scratch as follows:

Image New Web Application

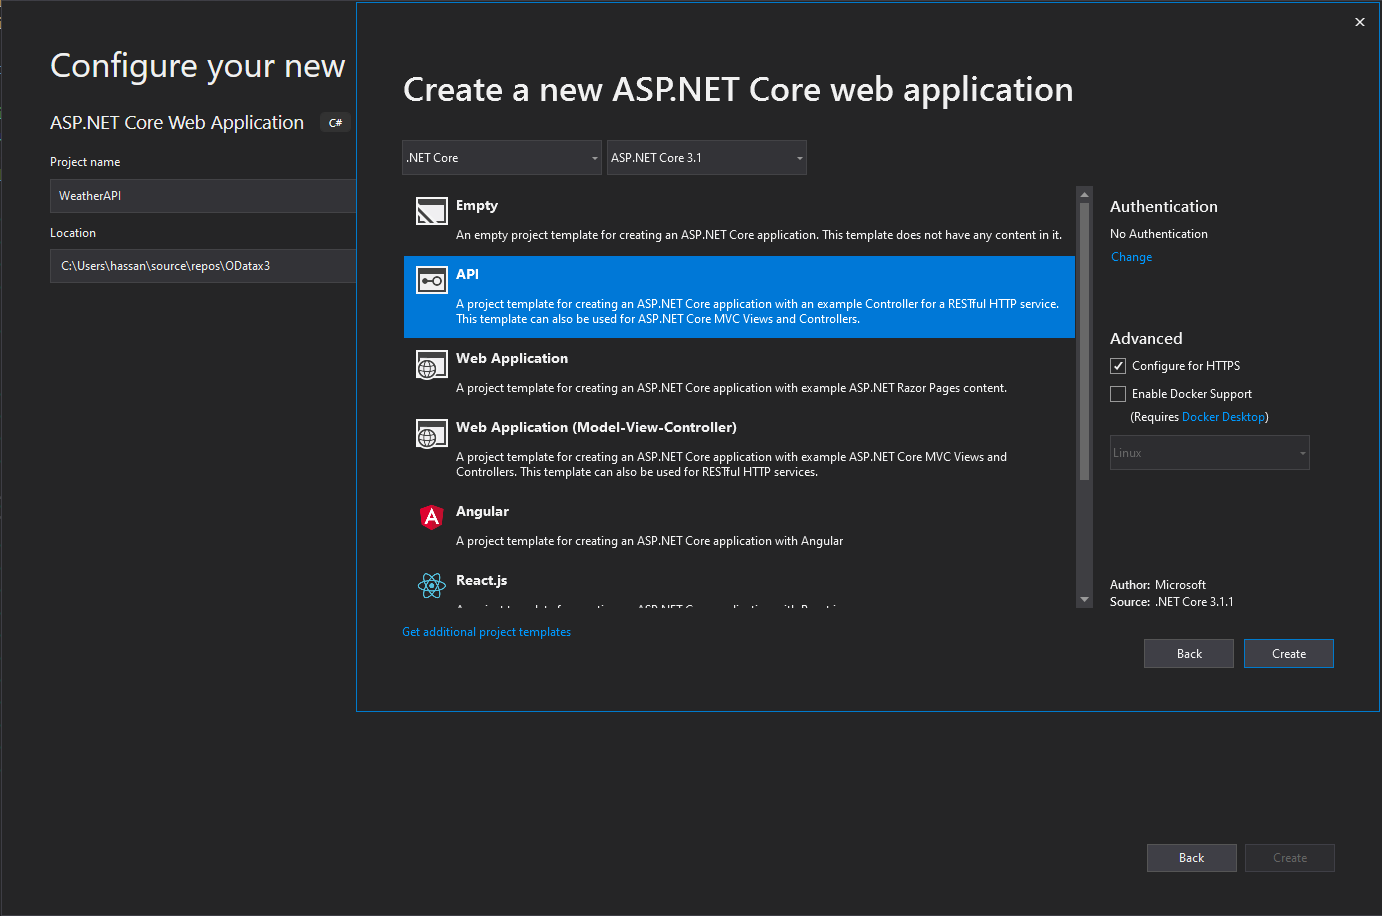
Since the API template we are going to select already comes with an endpoint to return a list of weather forecasts, let’s name our project WeatherAPI, with ASP.NET Core 3.1 as a project configuration as follows:

Image New API


Installing OData 7.4.0 (Beta)

Now that we have created a new project, let’s go ahead and install the latest release of OData with version 7.4.0 by either using PowerShell command as follows:

Install-Package Microsoft.AspNetCore.OData -Version 7.4.0-beta

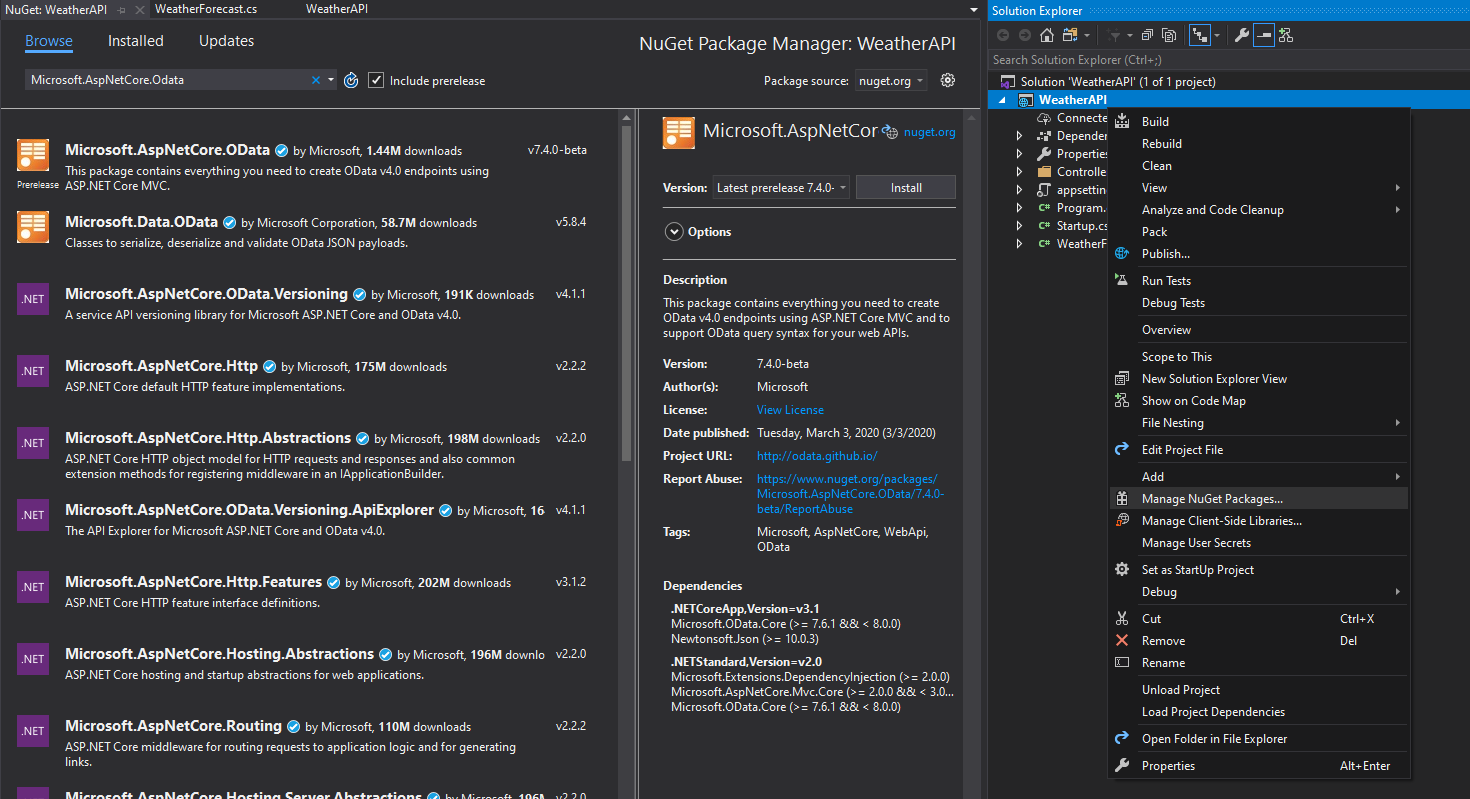
You can also navigate to the Nuget Package Manager as follows:

Image ODataWithContextBeta


Startup Setup

Now that we have the latest version of OData installed, and an existing controller for weather forecasts, let’s go ahead and setup our startup.cs file as follows:

using System.Linq;
using Microsoft.AspNet.OData.Builder;
using Microsoft.AspNet.OData.Extensions;
using Microsoft.AspNetCore.Builder;
using Microsoft.AspNetCore.Hosting;
using Microsoft.Extensions.Configuration;
using Microsoft.Extensions.DependencyInjection;
using Microsoft.Extensions.Hosting;
using Microsoft.OData.Edm;

namespace WeatherAPI
{
    public class Startup
    {
        public Startup(IConfiguration configuration)
        {
            Configuration = configuration;
        }

        public IConfiguration Configuration { get; }

        public void ConfigureServices(IServiceCollection services)
        {
            services.AddControllers();
            services.AddOData();
        }

        public void Configure(IApplicationBuilder app, IWebHostEnvironment env)
        {
            if (env.IsDevelopment())
            {
                app.UseDeveloperExceptionPage();
            }

            app.UseHttpsRedirection();

            app.UseRouting();

            app.UseAuthorization();

            app.UseEndpoints(endpoints =>
            {
                endpoints.MapControllers();
                endpoints.Select().Filter().OrderBy().Count().MaxTop(10);
                endpoints.MapODataRoute("odata", "odata", GetEdmModel());
            });
        }

        private IEdmModel GetEdmModel()
        {
            var odataBuilder = new ODataConventionModelBuilder();
            odataBuilder.EntitySet<WeatherForecast>("WeatherForecast");

            return odataBuilder.GetEdmModel();
        }
    }
}


As you can see in the code above, we didn’t have to disable EndpointRouting as we used to do in the past in the ConfigureServices method, you will also notice in the Configure method has all OData configurations as usual referencing creating an entity data model with whatever prefix we choose, in our case here we set it to odata but you can change that to virtually anything you want, including api.


Weather Forecast Model

Before you run your API, you will need to do a slight change to the demo WeatherForecast model that comes in with the API template, which is adding a key to it, otherwise OData wouldn’t know how to operate on a keyless model, so we are going to add an Id of type GUID to the model, and this is how the WeatherForecast model would look like:

public class WeatherForecast
    {
        public Guid Id { get; set; }
        public DateTime Date { get; set; }
        public int TemperatureC { get; set; }
        public int TemperatureF => 32 + (int)(TemperatureC / 0.5556);
        public string Summary { get; set; }
    }


Weather Forecast Controller

We had to enable OData querying on the weather forecast endpoint while removing all the other unnecessary annotations, this is how our controller looks like:

using System;
using System.Collections.Generic;
using System.Linq;
using Microsoft.AspNet.OData;
using Microsoft.AspNetCore.Mvc;
using Microsoft.Extensions.Logging;

namespace WeatherAPI.Controllers
{
    public class WeatherForecastController : ControllerBase
    {
        private static readonly string[] Summaries = new[]
        {
            "Freezing", "Bracing", "Chilly", "Cool", "Mild", "Warm", "Balmy", "Hot", "Sweltering", "Scorching"
        };

        [EnableQuery]
        public IEnumerable<WeatherForecast> Get()
        {
            var rng = new Random();
            return Enumerable.Range(1, 5).Select(index => new WeatherForecast
            {
                Id = Guid.NewGuid(),
                Date = DateTime.Now.AddDays(index),
                TemperatureC = rng.Next(-20, 55),
                Summary = Summaries[rng.Next(Summaries.Length)]
            })
            .ToArray();
        }
    }
}


Hit Run

Now that we have everything in place, let’s run our API and hit our OData endpoint with an HTTP GET request as follows:

https://localhost:44344/odata/weatherforecast

The following result should be returned:

{
  "@odata.context": "https://localhost:44344/odata/$metadata#WeatherForecast",
  "value": [
    {
      "Id": "66b86d0d-375f-4133-afb4-82b44f7f2e79",
      "Date": "2020-03-02T23:07:52.4084956-08:00",
      "TemperatureC": 23,
      "Summary": "Mild"
    },
    {
      "Id": "d534a764-4fb8-4f49-96c5-8f09987a61d8",
      "Date": "2020-03-03T23:07:52.4085408-08:00",
      "TemperatureC": 9,
      "Summary": "Balmy"
    },
    {
      "Id": "07583c78-b2f5-4119-acdb-50511ac02e8a",
      "Date": "2020-03-04T23:07:52.4085416-08:00",
      "TemperatureC": -15,
      "Summary": "Hot"
    },
    {
      "Id": "05810360-d1fb-4f89-be18-2b8ddc75beff",
      "Date": "2020-03-05T23:07:52.4085421-08:00",
      "TemperatureC": 9,
      "Summary": "Hot"
    },
    {
      "Id": "35b23b1a-4803-4c3e-aebc-ced17807b1e1",
      "Date": "2020-03-06T23:07:52.4085426-08:00",
      "TemperatureC": 16,
      "Summary": "Hot"
    }
  ]
}

You can now try the regular operations of $select, $orderby, $filter, $count and $top on your data and examine the functionality yourself.


Non-Edm Approach

If you decide to go the non-Edm route, you will need to install an additional Nuget package to resolve a Json formatting issue as follows:

First of all install Microsoft.AspNetCore.Mvc.NewtonsoftJson package by running the following PowerShell command:

Install-Package Microsoft.AspNetCore.Mvc.NewtonsoftJson -Version 3.1.2

You can also navigate for the package using Nuget Package manager as we did above.

Secondly, you will need to modify your ConfigureService in your Startup.cs file to enable the Json formatting extension method as follows:

using System.Linq;
using Microsoft.AspNet.OData.Extensions;
using Microsoft.AspNetCore.Builder;
using Microsoft.AspNetCore.Hosting;
using Microsoft.Extensions.Configuration;
using Microsoft.Extensions.DependencyInjection;
using Microsoft.Extensions.Hosting;

namespace WeatherAPI
{
    public class Startup
    {
        public Startup(IConfiguration configuration)
        {
            Configuration = configuration;
        }

        public IConfiguration Configuration { get; }

        public void ConfigureServices(IServiceCollection services)
        {
            services.AddControllers().AddNewtonsoftJson();
            services.AddOData();
        }

        public void Configure(IApplicationBuilder app, IWebHostEnvironment env)
        {
            if (env.IsDevelopment())
            {
                app.UseDeveloperExceptionPage();
            }

            app.UseHttpsRedirection();

            app.UseRouting();

            app.UseAuthorization();

            app.UseEndpoints(endpoints =>
            {
                endpoints.MapControllers();
                endpoints.EnableDependencyInjection();
                endpoints.Select().Filter().OrderBy().Count().MaxTop(10);
            });
        }
    }
}

Notice that we added AddNewtonsoftJson() to resolve the formatting issue with $select, we have also removed the MapODataRoute(..) and added EnableDependencyInjection() instead.

With that, we have added back the weather forecast controller [ApiController] and [Route] annotations in addition to [HttpGet] as follows:

using System;
using System.Collections.Generic;
using System.Linq;
using Microsoft.AspNet.OData;
using Microsoft.AspNetCore.Mvc;

namespace WeatherAPI.Controllers
{
    [ApiController]
    [Route("api/[controller]")]
    public class WeatherForecastController : ControllerBase
    {
        private static readonly string[] Summaries = new[]
        {
            "Freezing", "Bracing", "Chilly", "Cool", "Mild", "Warm", "Balmy", "Hot", "Sweltering", "Scorching"
        };

        [HttpGet]
        [EnableQuery]
        public IEnumerable<WeatherForecast> Get()
        {
            var rng = new Random();
            return Enumerable.Range(1, 5).Select(index => new WeatherForecast
            {
                Id = Guid.NewGuid(),
                Date = DateTime.Now.AddDays(index),
                TemperatureC = rng.Next(-20, 55),
                Summary = Summaries[rng.Next(Summaries.Length)]
            })
            .ToArray();
        }
    }
}


Now, run your API and try all the capabilities of OData with your ASP.NET Core 3.1 API including Endpoint Routing.


Final Notes

  1. The OData team will continue to address all the issues opened on the public github repo based on their priority.
  2. We are always open to feedback from the community, and we hope to get the community’s support on some of our public repos to keep OData and it’s client libraries running.
  3. With this current implementation of OData you can now enable Swagger easily on your API without any issues.
  4. You can clone the example we used in this article from this repo here to try it for yourself.
  5. The final release of OData 7.4.0 library should be released within two weeks from the time this article was published.

The post Enabling Endpoint Routing in OData appeared first on OData.


Announcing preview of Backup Reports

$
0
0

We recently announced a new solution, Backup Explorer, to enable you as a backup administrator to perform real-time monitoring of your backups, helping you achieve increased efficiency in your day-to-day operations.

But what if you could also be proactive in the way you manage your backup estate? What if there was a way to unlock the latent power of your backup metadata to make more informed business decisions?

For instance, any business would be well-served following a systematic way of forecasting backup usage. Often, this involves analyzing how backup storage has increased over time for a given tenant, subscription, resource group, or for individual workloads. Such analysis requires the paired ability to aggregate data over a long period of time and present it in a way that allows the reader to quickly derive insights.

Today, we are pleased to announce the public preview of Backup Reports. Leveraging Azure Monitor Logs and Azure Workbooks, Backup Reports serve as a one-stop destination for tracking usage, auditing of backups and restores, and identifying key trends at different levels of granularity.

With our reports, you can answer questions including ‘Which Backup Item(s) consume the most storage?’, ‘Which machines have had consistently misbehaving backups?’, ‘What are the main causes of backup job failure?’, and many more.

Key benefits

  1. Boundary-less reporting: Backup Reports work across multiple workload types that are supported by Azure Backup. This includes Azure workloads such as Azure Virtual Machines, SQL in Azure Virtual Machines, SAP HANA/ASE in Azure Virtual Machines, as well as on-premises workloads including Data Protection Manager (DPM), Azure Backup Server, and Azure Backup Agent. The reports can aggregate information across multiple vaults, subscriptions, and regions. If you are an Azure Lighthouse user with delegated access to your customers’ subscriptions/Log Analytics workspaces, you can also view reporting data across all your tenants within a single pane of glass.
  2. Rich slicing, dicing, and drill-down capabilities: Backup Reports offers a range of filters and visualization experiences that enable you, as a backup administrator, to easily scope down your analysis and derive valuable insights. You can also slice and dice on backup item-specific properties, such as the backup item type, protection state, and more.
  3. Native Azure-based experience: Backup Reports can be viewed right on the Azure portal without the need to purchase any additional software licenses. This native integration also makes it possible to seamlessly navigate to (and from) the individual dashboards for backup items and vaults and take action.

Note, Backup Reports will start showing data for Azure file share backup for each region once Azure file share backup becomes generally available.

Getting started

To start using Backup Reports, you will first need to configure your vaults to send diagnostics data to Log Analytics. To make this task easier, we have provided a built-in Azure Policy that auto-enables Log Analytics diagnostics for all vaults in a chosen scope.

Once all your vaults have been configured to send data to Log Analytics, you can simply navigate to any vault and click on the Backup Reports menu item.

  Backup Reports quick link on the Recovery Services Vault dashboard

This opens a report that will aggregate data across your entire backup estate. Simply select one or more LA Workspaces to view data and you’ll be ready to go.

Summary tab of Backup Reports

Next steps

How to write a Roslyn Analyzer

$
0
0

Roslyn analyzers inspect your code for style, quality, maintainability, design and other issues. Because they are powered by the .NET Compiler Platform, they can produce warnings in your code as you type even before you’ve finished the line. In other words, you don’t have to build your code to find out that you made a mistake. Analyzers can also surface an automatic code fix through the Visual Studio light bulb prompt that allows you to clean up your code immediately. With live, project-based code analyzers in Visual Studio, API authors can ship domain-specific code analysis as part of their NuGet packages.

You don’t have to be a professional API author to write an analyzer. In this post, I’ll show you how to write your very first analyzer.

Getting started

In order to create a Roslyn Analyzer project, you need to install the .NET Compiler Platform SDK via the Visual Studio Installer. There are two different ways to find the .NET Compiler Platform SDK in the Visual Studio Installer:

Install using the Visual Studio Installer – Workloads view:

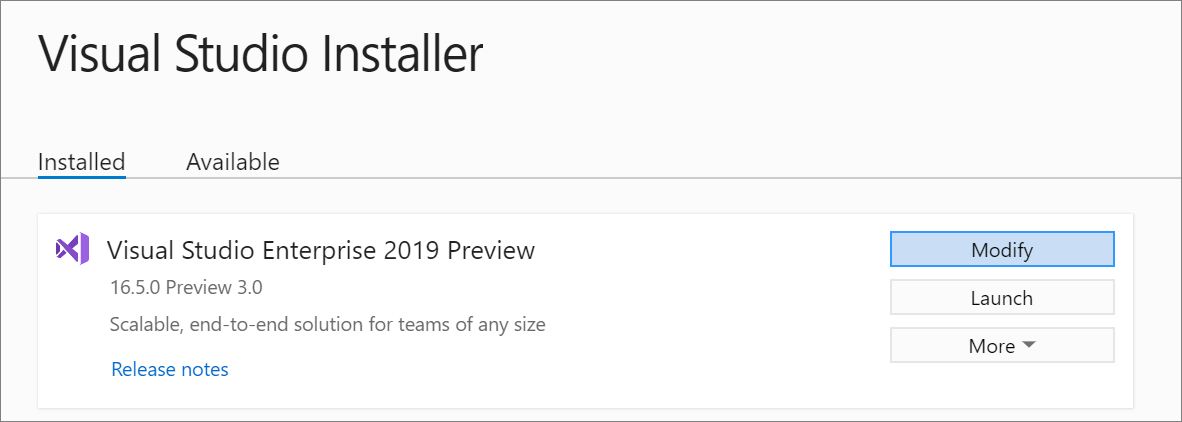
  1. Run the Visual Studio Installer and select Modify.
    Visual Studio Installer
  2. Check the Visual Studio extension development workload.
    Visual Studio Extension Development Workload

Install using the Visual Studio Installer – Individual components tab:

  1. Run the Visual Studio Installer and select Modify.
  2. Select the Individual components tab.
  3. Check the box for .NET Compiler Platform SDK.
    Visual Studio Individual Components

Writing an analyzer

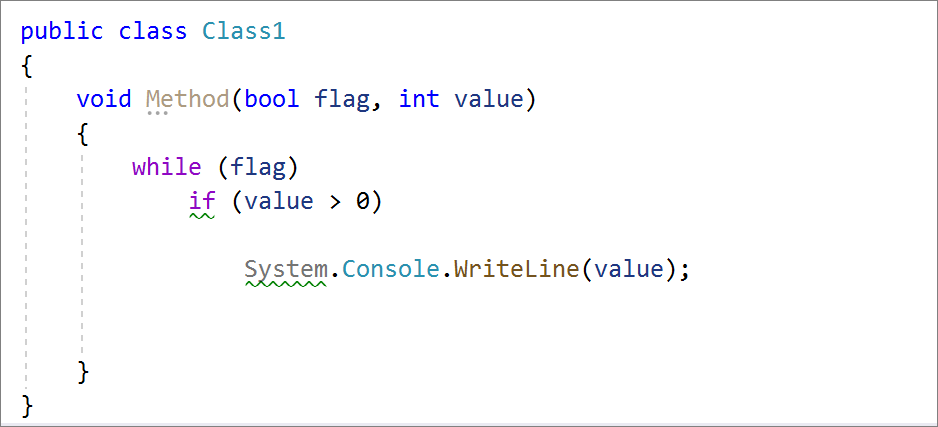
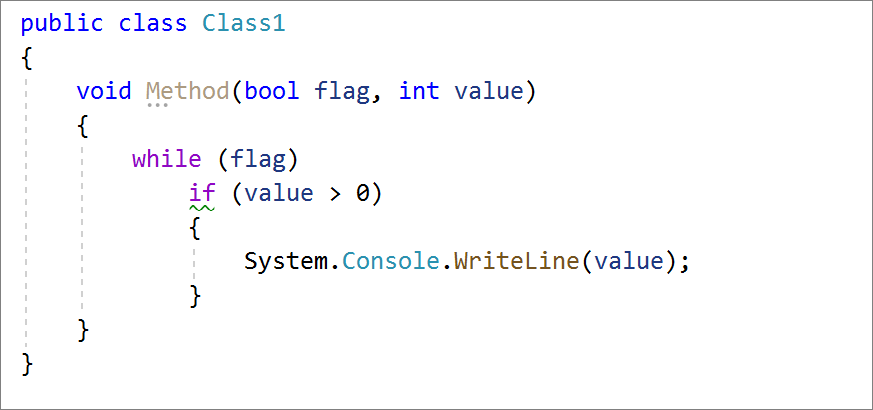
Let’s begin by creating a syntax tree analyzer. This analyzer generates a syntax warning for any statement that is not enclosed in a block that has curly braces { and }. For example, the following code generates a warning for both the if-statement and the System.Console.WriteLine invocation statement, but the while statement is not flagged:

Brace Analyzer Diagnostic

  1. Open Visual Studio.
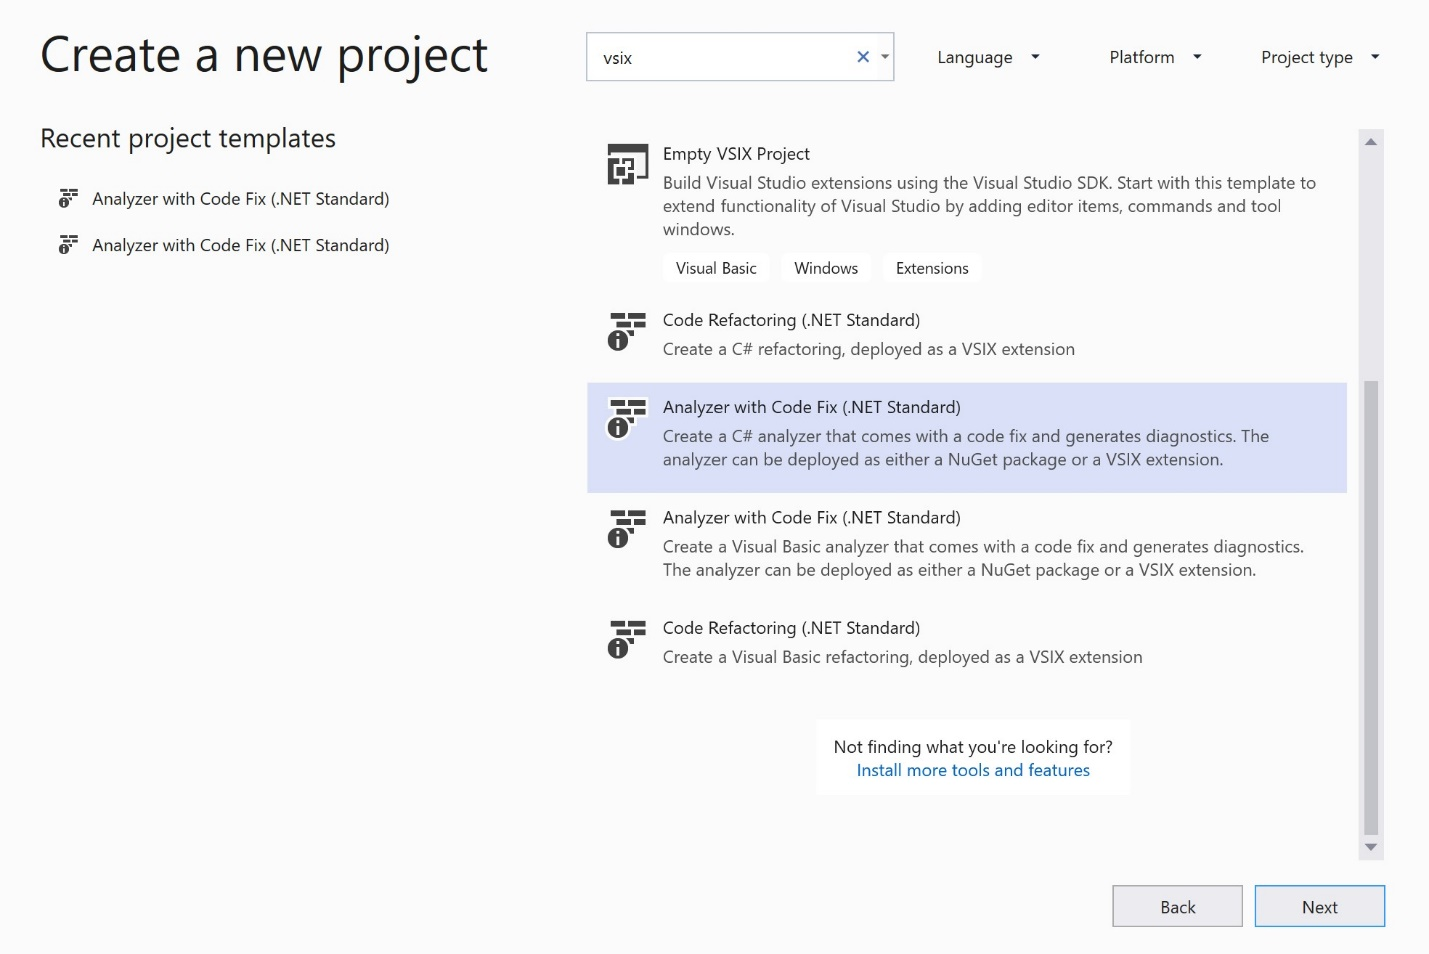
  2. On the Create a new project dialog search VSIX and select Analyzer with Code Fix (.NET Standard) in C# and click Next.
    Create New Project Dialog
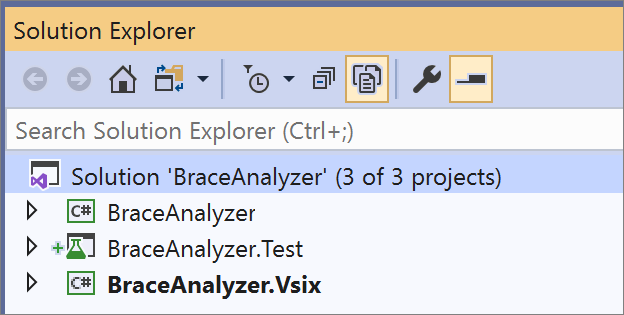
  3. Name your project BraceAnalyzer and click OK. The solution should contain 3 projects: BraceAnalyzer, BraceAnalyzer.Test, BraceAnalyzer.Vsix.
    Analyzer Solution Layout
    • BraceAnalyzer: This is the core analyzer project that contains the default analyzer implementation that reports a diagnostic for all type names that contain any lowercase letter.
    • BraceAnalyzer.Test: This is a unit test project that lets you make sure your analyzer is producing the right diagnostics and fixes.
    • BraceAnalyzer. Vsix: The VSIX project bundles the analyzer into an extension package (.vsix file). This is the startup project in the solution.
  4. In the Solution Explorer, open Resources.resx in the BraceAnalyzer project. This displays the resource editor.
  5. Replace the existing resource string values for AnalyzerDescription, AnalyzerMessageFormat, and AnalyzerTitle with the following strings:
    • Change AnalyzerDescription to Enclose statement with curly braces.
    • Change AnalyzerMessageFormat to `{` brace expected.
    • Change AnalyzerTitle to Enclose statement with curly braces.


    Resources Resx

  6. Within the BraceAnalyzerAnalyzer.cs file, replace the Initialize method implementation with the following code:
  7. public override void Initialize(AnalysisContext context)
    {
        context.RegisterSyntaxTreeAction(syntaxTreeContext =>
        {
            // Iterate through all statements in the tree
            var root = syntaxTreeContext.Tree.GetRoot(syntaxTreeContext.CancellationToken);
            foreach (var statement in root.DescendantNodes().OfType<StatementSyntax>())
            {
                // Skip analyzing block statements 
                if (statement is BlockSyntax)
                {
                    continue;
                }
    
                // Report issues for all statements that are nested within a statement
                // but not a block statement
                if (statement.Parent is StatementSyntax && !(statement.Parent is BlockSyntax))
                {
                    var diagnostic = Diagnostic.Create(Rule, statement.GetFirstToken().GetLocation());
                    syntaxTreeContext.ReportDiagnostic(diagnostic);
                }
            }
        });
    }

  8. Check your progress by pressing F5 to run your analyzer. Make sure that the BraceAnalyzer.Vsix project is the startup project before pressing F5. Running the VSIX project loads an experimental instance of Visual Studio, which lets Visual Studio keep track of a separate set of Visual Studio extensions.
  9. In the Visual Studio instance, create a new C# class library with the following code to verify that the analyzer diagnostic is neither reported for the method block nor the while statement, but is reported for the if statement and System.Console.WriteLine invocation statement:
    Brace Analyzer Diagnostic
  10. Now, add curly braces around the System.Console.WriteLine invocation statement and verify that the only single warning is now reported for the if statement:
    Brace Diagnostic For If Statement

Writing a code fix

An analyzer can provide one or more code fixes. A code fix defines an edit that addresses the reported issue. For the analyzer that you created, you can provide a code fix that encloses a statement with a curly brace.

  1. Open the BraceAnalyzerCodeFixProvider.cs file. This code fix is already wired up to the Diagnostic ID produced by your diagnostic analyzer, but it doesn’t yet implement the right code transform.
  2. Change the title string to “Add brace”:
  3. private const string title = "Add brace";

  4. Change the following line to register a code fix. Your fix will create a new document that results from adding braces.
  5. context.RegisterCodeFix(
            CodeAction.Create(
                title: title,
                createChangedDocument: c => AddBracesAsync(context.Document, diagnostic, root),
                equivalenceKey: title),
            diagnostic);

  6. You’ll notice red squiggles in the code you just added on the AddBracesAsync symbol. Add a declaration for AddBracesAsync by replacing the MakeUpperCaseAsync method with the following code:
  7. Task<Document> AddBracesAsync(Document document, Diagnostic diagnostic, SyntaxNode root)
            {
                var statement = root.FindNode(diagnostic.Location.SourceSpan).FirstAncestorOrSelf<StatementSyntax>();
                var newRoot = root.ReplaceNode(statement, SyntaxFactory.Block(statement));
                return Task.FromResult(document.WithSyntaxRoot(newRoot));
            }

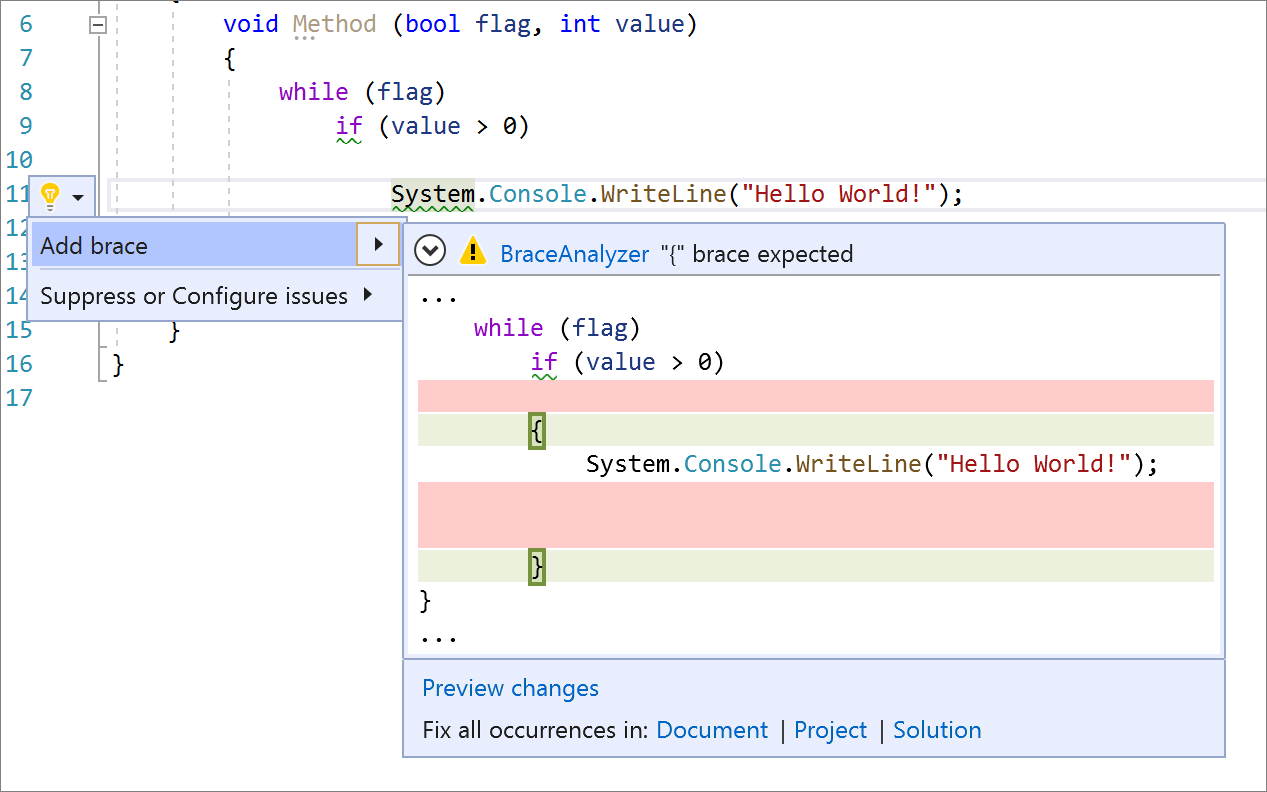
  8. Press F5 to run the analyzer project in a second instance of Visual Studio. Place your cursor on the diagnostic and press (Ctrl+.) to trigger the Quick Actions and Refactorings menu. Notice your code fix to add a brace!
    Image brace analyzer code fix2

Conclusion

Congratulations! You’ve created your first Roslyn analyzer that performs on-the-fly code analysis to detect an issue and provides a code fix to correct it. Now that you’re familiar with the .NET Compiler Platform SDK (Roslyn APIs), writing your next analyzer will be a breeze.

The post How to write a Roslyn Analyzer appeared first on .NET Blog.

Migrating OData V3 Services to OData V4 without Disrupting Existing Clients

$
0
0

The migration from your existing OData V3 services to V4 can be challenging if there are some clients that cannot be easily upgraded, like the ones running on on-premises resources. The OData V3 services will need to be kept running until the old clients have been phased out, incurring maintenance overhead. OData team recently released an extension to overcome the challenge. This extension eases the transitioning by enabling OData V4 services to serve OData V3 requests. The advantage is that no changes are needed on the OData V3 clients while the OData V3 services are migrated to OData V4.

In this article, I am going to show you how to use the Migration extension.

Prerequisites

It is assumed that you have migrated your OData V3 service to OData V4 and:

  • The service is built on ASP.NET Core 2.1+
  • The models remain unchanged including naming and name space
  • The requests and responses use JSON format

If a request is sent from the OData V3 client to the V4 service, the response will most likely be a 404 NotFound error because the service does not know how to route the request to the controller.

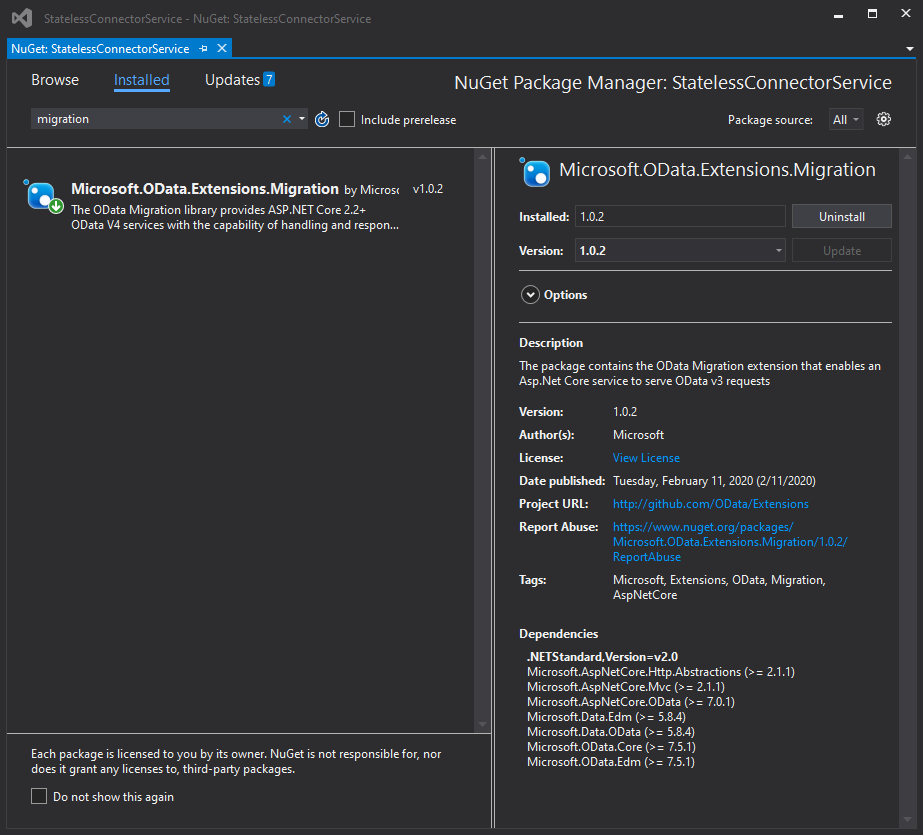
Adding Package Reference

Add a reference to the latest Microsoft.OData.Extensions.Migration package.

Image Migration reference

Configuring OData Migration Services

Add the OData Migration extension to services. It needs to be added after OData.

public static void ConfigureServices(IServiceCollection services)
{
    // your code here

    // AddOData must be called before AddODataMigration
    services.AddOData();
    services.AddODataMigration();

    // your code here
}

Using OData Migration Middleware

Call UseODataMigration to enable the extension in the pipeline. It needs both the OData V3 and V4 models. The OData V3 model can be represented by either a Data.Edm.IEdmModel object or an EDMX string. The service will return the OData V3 formatted EDMX for the metadata calls.

Below is the sample code of calling UseODataMigration with an OData V3 EDMX string.

public static void Configure(IApplicationBuilder builder)
{
    // your code here

    // If using batching, you must call UseODataBatching before UseODataMigration
    builder.UseODataBatching();

    string v3Edmx = /*your EDMX string*/
    builder.UseODataMigration(v3Edmx, v4model);

    // your code here
}

Features

Now if you make a metadata call to the service:

https://localhost/ODataV4Service/$metadata

The response should be the EDMX text for the OData V3 model:

<?xml version="1.0" encoding="iso-8859-1"?>
<edmx:Edmx xmlns:edmx="http://schemas.microsoft.com/ado/2009/11/edmx" Version="3.0">
  <edmx:DataServices xmlns:m="http://schemas.microsoft.com/ado/2007/08/dataservices/metadata" m:MaxDataServiceVersion="3.0" m:DataServiceVersion="3.0">
    <Schema xmlns="http://schemas.microsoft.com/ado/2009/11/edm" Namespace="Your.Namespace">
      <EntityContainer m:IsDefaultEntityContainer="true" Name="CommonContainer">
        <!-- Your entities here -->
      ...

The OData V4 service can respond to both OData V3 and V4 clients now.

URI Migration

Under the hood, the OData V3 URI is translated to the OData V4 format.

For example, a GUID value has different representation in OData V3 and V4. The following OData V3 URI:

https://localhost/v3/Product(guid’02951787-4c1a-4dff-a917-a04b21b40ad3‘)

will be translated into:

https://localhost/v4/Product(02951787-4c1a-4dff-a917-a04b21b40ad3)

Request/Response Payload Migration

The extension is also able to deserialize an OData V3 request body and serialize the response body to the OData V3 format.

For example, a long value is serialized differently in OData V3 and V4. The client will send and receive a payload like

{
  "MyString": “John”
  "MyLong": "1000000000"
}

while the OData V4 service sees below internally:

{
  "MyString": "John",
  "MyLong": 1000000000
}

Once the OData V3 clients have been phased out simply remove the reference and the two lines of code for OData Migration.

Final Notes

More information on the OData Migration extension including architecture and limitations can be found here. The source code of the extension is published on GitHub.

If you have any questions, comments, concerns or if you are running into any issues using this extension feel free to reach out on this blog post or by email. We are more than happy to listen to your feedback and communicate your concerns.

The post Migrating OData V3 Services to OData V4 without Disrupting Existing Clients appeared first on OData.
Our commitment to customers during COVID-19

IoT Signals healthcare report: Key opportunities to unlock IoT’s promise

$
0
0

The cost of healthcare is rising globally and to tackle this, medical providers, from hospitals to your local doctor’s office, are looking to IoT to streamline processes and minimize costs. Few industries stand to gain more from emerging technology. And in few industries the stakes are higher because, in healthcare, incremental efficiencies can make the difference between life and death.

The International Data Corporation (IDC) expects that by 2025 there will be 41.6 billion connected IoT devices or ‘things,’ generating more than 79 zettabytes (ZB) of data.i In the healthcare industry, IoT has emerged as a valuable tool to help ensure quality and better patient care. IoT is used to manage everything from chronic diseases to medication dosages to medical equipment—situations where security flaws in devices are potentially life-threatening. By helping to reduce human error, improve safety conditions, increase staff satisfaction, and make organizations more efficient, IoT can ultimately improve health outcomes.

Insights from new IoT Signals Healthcare report

Today we're launching a new IoT Signals report focused on the healthcare industry that provides an industry pulse on the state of IoT adoption. This research enables us to better serve our partners and customers, as well as help healthcare leaders develop their own IoT strategies. We surveyed 152 decision-makers in enterprise healthcare organizations across multiple countries to deliver an industry-level view of the IoT ecosystem, including adoption rates, related technology trends, challenges, and benefits of IoT.

What the study found is that while IoT has had broad adoption in healthcare (89 percent) and is considered critical to success, healthcare organizations are still challenged by security, compliance and privacy concerns, as well as skills shortages. To summarize the findings:

  1. IoT is helping healthcare organizations become safer and more efficient. With the sensitive and highly regulated nature of healthcare work, leveraging IoT for patient monitoring, quality assurance, and logistical support is quite prevalent. IoT is helping organizations ensure quality in these areas while improving patient care.
  2. To expand IoT implementations, organizations must tackle regulatory and compliance challenges. Healthcare organizations must continue to keep patient information private and comply with evolving regulatory standards while proving the return on investment of IoT. Overcoming barriers around evolving data regulations is key for healthcare organizations, and many are adopting numerous standards. Over 8 in 10 have adopted either HL7, DICOM, or CMS Interoperability, with HL7 FHIR and DICOM being the most common.
  3. IoT talent shortages exist. Getting IoT off the ground is a challenge for any company, given technology challenges, long-term commitments, and the investment required. It’s doubly so for healthcare organizations that lack talent and resources. In fact, 43 percent of those surveyed cited lack of budget and staff as roadblocks to success, with 34 percent specifically concerned about a lack of skilled workers and technical knowledge. Furthermore, 25 percent said a lack of resources and knowledge were key factors in their ability to scale, and in proof-of-concept failures.
  4. The future of IoT in healthcare will extend beyond patient care, with strong growth in optimizing logistics and operations. While IoT usage for patient care will continue to grow and remain a top use case in the future, decision-makers see strong potential to leverage IoT more to support the logistics and operational side of their organizations. Significant IoT growth is expected in facilities management and staff tracking. Decision-makers also anticipate improved safety, compliance, and efficiency through increased IoT implementation within supply chain management, inventory tracking, and quality assurance as patient care catches up with traditional IoT scenarios like manufacturing, logistics, supply chain, and quality.

Microsoft is leading the charge to address these IoT challenges

There are many ways in which healthcare organizations can benefit by leveraging the Azure IoT platform to connect and control devices:

  1. Simplify patient monitoring while reducing healthcare costs. Continuous monitoring of assets connected to healthcare applications, including battery life and general health of devices, allows providers to deliver personalized patient care anytime, anywhere and equips their care team with a near real-time view of the patient’s health and activities.
  2. Optimize medical equipment utilization. Medical staff can avoid equipment downtime and misplacement, and allocate more time for patients, when they connect and track machines, supplies, and other assets through the cloud and monitor their usage for optimal deployment.
  3. Proactively replenish supplies. Healthcare facilities can better ensure safety and efficacy through cold chain tracking to monitor, maintain, and automate life-saving vaccine storage and distribution by connecting devices to the cloud and proactively replenishing contents.

Across all these applications, we see common benefits provided by cloud computing, including:

  • Greater trust around the security of health data.
  • Near infinite scale for storing and processing large amounts of data.
  • Increased speed in gaining access to new tools, more storage space, or greater computing power.
  • Economical use of resources.
  • Scaling up and down as demand fluctuates in terms of, for instance, natural disasters.

Our commitment

We are committed to helping healthcare customers bring their visions to life with IoT, and this starts with simplifying and securing IoT. Our customers are embracing IoT as a core strategy to drive better patient outcomes and we are heavily investing in this space, committing $5 billion in IoT and intelligent edge innovation by 2022 and growing our IoT and intelligent edge partner ecosystem to over 10,000.

Our vision is to simplify IoT, enabling every business on the planet to benefit. We have the most comprehensive portfolio of IoT platform services and are pushing to further simplify IoT solution development with our scalable, fully managed IoT app platform Azure IoT Central. Solution builders are accelerated from proof of concept to production using IoT Central application templates like our healthcare template for continuous patient monitoring. We work hard to ensure healthcare organizations have a robust talent pool of IoT developers, providing free training for common application patterns and deployments through our IoT School and AI School.

Security is paramount for healthcare customers. Azure Sphere takes a holistic security approach from silicon to cloud, providing a highly secured solution for connected microcontroller units (MCUs,) that go into devices ranging from connected home devices to medical and industrial equipment. Azure Security Center provides unified security management and advanced threat protection for systems running in the cloud and on the edge. Azure Sphere combined with a real-time operating system (RTOS) delivers a better together solution that can help real-time medical apps improve the performance in IoT medical devices, including medical imaging systems, by ensuring they meet data regulation requirements.

Finally, we’re helping our healthcare customers leverage their IoT investments with AI and at the intelligent edge. Azure IoT Edge enables customers to distribute cloud intelligence to run in isolation on IoT devices directly and Azure Stack Edge builds on Azure IoT Edge and adds virtual machine and mass storage support.

When IoT is foundational to a healthcare organization’s transformation strategy, it can have a significant positive impact on patient care, safety, and the bottom line. We're invested in helping our partners, customers, and the broader industry to take the necessary steps to address barriers to success and invent with purpose.

Read the full IoT Signals healthcare report and learn how we're helping healthcare providers embrace the future and unlock new opportunities with IoT.


i Worldwide Global DataSphere IoT Device and Data Forecast, 2019–2023, (Doc #US45066919), May 2019.

Reimagining healthcare with Azure IoT

$
0
0

Providers, payors, pharmaceuticals, and life sciences companies are leading the next wave of healthcare innovation by utilizing connected devices. From continuous patient monitoring, to optimizing operations for manufacturers and cold-chain supply tracking for the pharmaceutical industry, the healthcare industry has embraced IoT technology to improve patient outcomes and operations.

In our latest IoT Signals for Healthcare research, we spoke with over 150 health organizations about the role that IoT will play in helping them deliver better health outcomes in the years to come. Across the ecosystem, 85 percent see IoT as “critical” to their success, with 78 percent planning to increase their investment in IoT technologies over the next few years. Real-time data from connected devices and sensors provides benefits across the health ecosystem, from manufacturers and pharmaceuticals to health providers and patients.

For health providers, IoT unlocks efficiencies for clinical staff and equipment:

  • Reduces human error.
  • Ensures regulatory compliance when exchanging patient health data across systems.
  • Coordinates the productivity of medical professionals across clinical facilities.

For manufacturers, IoT creates new digital feedback loops connecting their employees, facilities, products, and end customers. Real-time data can help:

  • Reduce costly downtime with predictive maintenance.
  • Improve sustainable practices by reducing waste and ensuring worker safety.
  • Contribute to improved product quality and quantity.

For the pharmaceutical industry, IoT provides greater traceability for inventory along a supply chain:

  • Improved visibility into environmental conditions.
  • Reduced costly inventory spoilage.
  • Increased control against theft or counterfeiting.

For end patients, IoT can improve health outcomes with continuous patient monitoring:

  • Reduces the need for unnecessary readmissions.
  • Improves treatment success rates by providing continuous data to care professionals.
  • Personalizes care based on patient needs.

In this blog, we’ll cover how our portfolio can support different IoT solution needs for software developers, hardware developers, and healthcare customers. We’ll also cover new product updates for healthcare solution builders, review a sample solution architecture, and showcase two case studies that illustrate different approaches for building innovative healthcare solutions. To further explore applications of IoT in healthcare and customer case studies, head to our IoT in Healthcare page.

Building healthcare IoT solutions with Azure IoT

As Microsoft and its global partners continue to build solutions that empower healthcare organizations around the world, a key question continues to face IoT decision makers: whether to build a solution from scratch or buy an existing solution that fits their needs.

From ensuring device-to-cloud security with Azure Sphere to providing multiple approaches for device management and connectivity with Platform as a Service (PaaS) options or a managed app platform, Azure IoT provides the most comprehensive IoT and Edge product portfolio on the market, designed to meet the diverse needs of healthcare solution builders.

Solution builders who want to invest their resources in designing, maintaining, and customizing IoT systems from the ground up can do so with our growing portfolio of IoT platform services, leveraging Azure IoT Hub as a starting point.

While this approach may be tempting for many, often solution builders struggle when growing their pilot into a globally scalable IoT solution. This process introduces significant complexity to an IoT architecture, requiring expertise across cloud and device security, DevOps, compliance, and more. For this reason, many solution builders might be better suited for starting with a managed platform approach with Azure IoT Central. Using more than two dozen Azure services, Azure IoT Central is designed to continually evolve with the latest service updates and seamlessly accompany solution builders along their IoT journey from pilot to production. With predictable pricing, white labeling, healthcare-specific application templates, and extensibility, solution builders can focus their time on how their device insights can improve outcomes, instead of common infrastructure questions like ingesting device data or ensuring disaster recovery.

New tools to accelerate building a healthcare IoT solution

Over the past year, we’ve been working hard to create new tools to make IoT solution development easier for our healthcare partners and customers:

  • Azure IoT Central app templates.
  • Internet of Medical Things (IoMT) Fast Healthcare Interoperability Resource (FHIR) Connector for Azure.

To help you put all of these tools together, we’ve also published a reference architecture diagram for continuous patient monitoring solutions.

Continuous patient monitoring reference architecture

Azure IoT Central Continuous Patient Monitoring App Template Reference Architecture

Azure IoT Central app templates

Last November, we announced the first IoT Central healthcare application template, designed for continuous patient monitoring applications. In-patient monitoring and remote patient monitoring are top of mind for many healthcare organizations; monitoring is the number one application of IoT in healthcare today, according to our survey of health organizations (mentioned above).

Application templates help solution builders get started even faster by providing scenario-specific resources such as:

  • Sample device operator dashboards.
  • Sample device templates.
  • Preconfigured rules and alerts.

An IoT device operator might set alerts to be notified when patient devices have low battery levels or exceed a certain threshold of temperature, so that they can take timely action to prevent devices losing connectivity, being damaged, or losing battery. Furthermore, the application template has rich documentation detailing integration with the Azure API for FHIR, ensuring scalable compliance with the HL7 FHIR standard (more on this in the next section).

Outside of using existing App Templates, solution builders can also leverage the “Custom App” option to build IoT applications for other healthcare scenarios as well.

IoMT FHIR Connector for Azure

Interoperability continues to be a huge challenge and critical for most healthcare organizations looking to use healthcare data in innovative ways. Microsoft proudly announced the general availability of our own FHIR server offering, Azure API for FHIR, in October 2019. We are now further enriching the FHIR ecosystem with the IoMT FHIR Connector for Azure, a connector designed to ingest, transform, and store IoT protected health information (PHI) data in FHIR compatible format.

Innovative healthcare companies share their IoT stories

In addition to rich industry insights like those found in IoT Signals for Healthcare and our previously published stories from Stryker, Gojo, and Wipro, we are releasing two new case stories. They detail the decisions, trade-offs, processes, and results of top healthcare organizations investing in IoT solutions, as well as the healthcare solution builders supporting them. These case studies showcase different approaches to building an IoT solution, based on the unique needs of their business. Read more about how these companies are implementing and winning with their IoT investments.

ThoughtWire and Schneider Electric leverage IoT for hospital operations

Clinical environments are managed by traditionally disconnected systems (facility management, clinical operations, inventory management, and more), operated by entirely separate teams. This makes it difficult to holistically manage and optimize clinical operations. Schneider Electric, a global expert in facilities management, partnered with ThoughtWire, a specialist in operations management systems, to deliver an end-to-end solution for facilities and clinical operations management. The joint Smart Hospital solution uses Azure’s IoT platform to help hospitals and clinics reduce costs, minimize their carbon footprint, and promote better staff satisfaction, patient experiences and health outcomes.

“We don’t just want to understand how the facility operates, we want to understand how patients and clinical staff interact with that infrastructure,” says Chris Roberts, Healthcare Solution Architect at Schneider Electric. “That includes everything to do with patient experience and patient safety. And when you talk about those things, the clinical world and the infrastructure world start to merge and connect. Working with ThoughtWire, we bridge the gap between those two worlds and drive performance improvements.”

To learn more, read the case study here.

Sensoria Health creates a new gold standard for managing diabetic foot ulcers

Diabetic Foot Ulcers (DFUs) are the leading cause of hospitalizations for diabetics, with a notoriously high treatment failure rate (over 75 percent), and an annual cost of $40 billion globally. To improve treatment success, Sensoria partnered with leading diabetic foot boot manufacturer, Optima Molliter, to create the Motus Smart Solution. The solution enables clinicians to remotely monitor patients wearing removable offloading devices (casts) when they leave the clinic and to track patient compliance against recommended care plans, enabling more personalized–and more impactful–care.

Sensoria turned to Azure IoT Central to develop a solution that would handle device management at scale while ensuring compliance in storing and sharing patient data. They leveraged the Continuous Patient Monitoring app template as their starting point to quickly design, launch, and scale their solution. With native IoMT Connector for FHIR integration, the template ensures that patient data is ultimately stored and shared in a secure and compliant format.

As stated by Davide Vigano, Cofounder and CEO of Sensoria, “We needed to quickly build enterprise-class applications for both doctors and patients to use with the device, send data from the device in a way that would help people remain compliant with HIPAA and other similar privacy-related legislation around the world, and find a way for the device’s data to easily flow from clinician to clinician across the very siloed healthcare industry. Using Azure IoT Central helped us deliver on all those requirements in a very short period of time.”

To learn more, read the case study here.

Figure 2: Sensoria Health  Motus Smart integration with Azure IoT Central and the Azure API for FHIR.

We look forward to seeing healthcare organizations continue to innovate with IoT to drive better health outcomes. We’ll continue to build the tools and platforms to empower our partners to invent with purpose.

Getting started

Data agility and open standards in health: FHIR fueling interoperability in Azure

$
0
0

Data agility in healthcare; it sounds fantastic, but there are few data ecosystems as sophisticated and complex as healthcare. The path to data agility can often be elusive. Leaders in health are prioritizing and demanding cloud technology that works on open standards like Fast Healthcare Interoperability Resources (FHIR) to transform how we manage data. Open standards will drive the future of healthcare, and today, we're sharing the expansion of Microsoft’s portfolio for FHIR, with new open-source software (OSS) and connectors which will help customers at different stages of their journey to advance interoperability and secure exchange of protected health information (PHI):

Enabling health data to work in the open format of FHIR enables us to innovate for the future of health. The Microsoft Azure API for FHIR was released to general availability in November 2019, and Azure was the first cloud with a fully-managed, enterprise-grade service for health data in the FHIR format. Since then, we’ve been actively working with customers so they can easily deploy an end-to-end pipeline for PHI in the cloud with the added security of FHIR APIs. From remote patient monitoring or clinical trials in the home environment to clinics and research teams, data needs to flow seamlessly in a trusted environment. Microsoft is empowering data agility with seamless data flows that leverage the open and secure framework of FHIR APIs.

Transform data to FHIR with the FHIR Converter

Health systems today have data in a variety of data formats and systems. The FHIR Converter provides your data team with a simple API call to convert data in legacy formats, such as HL7 V2, in real-time and convert it into FHIR. The current release includes the ability to transform HL7 V2 message utilizing a set of starting templates, generated on mappings defined by the HL7 community, but allows for customization to meet each organization’s implementation of the HL7 V2 standard using a simple Web UI. The FHIR Converter is designed as a simple, yet powerful, tool to reduce the amount of time and manual effort required in data mapping and exchange of data in FHIR.

Enable secondary use of FHIR data

The power of data organized in the FHIR framework means you can manage it more efficiently, particularly when you need to make data available for secondary use. Using FHIR Tools for Anonymization, your teams can leverage techniques, including de-identification through redaction or date-shifting for extraction, and exchange of data in anonymized formats. Because FHIR Tools for Anonymization is open source, you can work with it locally or with a cloud-based FHIR service like the Azure API for FHIR.

FHIR Tools for Anonymization enables de-identification of the 18 identifiers per the HIPAA Safe Harbor method. A configuration file is available for customers to create custom templates that meet their needs for Expert Determination methods.

Ingesting PHI data with FHIR, the Internet of Medical Things (IoMT)

Today’s healthcare data is not limited to patient charts and documents, it is expanding rapidly to include device data captured both inside and outside the clinician’s office. Customers can already use the powerful Azure IoT platform to manage devices and IoT solutions, but in the health industry, we need to pay special attention to managing PHI data from devices.

The IoMT FHIR Connector for Azure has been specifically designed for devices in health scenarios. Developed to work seamlessly with pre-built Azure functions and Microsoft Azure Event Hubs or the Microsoft Azure IoT platform, the IoMT connector ingests streaming data in real-time at millions of events per second. Customized settings allow developers to manage device content, sample data rates, and set the desired capture thresholds. Upon ingestion, device data is normalized, grouped, and mapped to FHIR that can be sent via FHIR APIs to an electronic health record (EHR) or other FHIR service. Supporting the open standard of FHIR means the IoMT FHIR Connector works with most devices, eliminating the need for custom integration for multiple device scenarios.

To enhance scale and connectivity with common patient-facing platforms that collect device data, the IoMT FHIR Connector is also launching with a FHIR HealthKit framework to quickly bring Apple HealthKit data to the cloud. 

Fueling data visualization in Power BI with real data

Customers love the rich data visualizations in Power BI that help everyone make decisions based on facts, not instinct. The Power BI Connector enables our health customers to light up robust tools for data visualization, analytics, and data exploration in Power BI using data in the FHIR format. With the control of FHIR APIs from an FHIR endpoint that uses the open standards, you still maintain flexibility and control data access allowing you to define user access as needed. Whether you need consistent event tracking or patient management reporting for your care teams, research tools and self-serve exploration for your clinical research teams, or predictive analytics and systems efficiency for your operations teams, the connection of FHIR and Power BI provides a powerful new tool for health organizations.

Check out the new FHIR tech

Microsoft is committed to data agility through FHIR. We believe FHIR is the fuel for innovation in healthcare and life sciences, and we’re excited to see what you build with it. The future of health is ours to create and we are excited to be at the innovation forefront of that journey with you.

We’d love to hear from health developers about the new FHIR products rolling out. Check out the OSS releases in GitHub.


Analyze your builds programmatically with the C++ Build Insights SDK

$
0
0

We’re happy to announce today the release of the C++ Build Insights SDK, a framework that gives you access to MSVC build time information via C and C++ APIs. To accompany this release, we are making vcperf open source on GitHub. Because vcperf itself is built with the SDK, you can use it as a reference when developing your own tools. We’re excited to see what sort of applications you’ll be building with the SDK, and we’re looking forward to receiving your feedback!

Background

Last November, we introduced vcperf and its Windows Performance Analyzer (WPA) plugin to help MSVC users understand their build times. Both components were announced under the umbrella of C++ Build Insights. But what is C++ Build Insights, really?

We’ve already covered in November that C++ Build Insights is based on Event Tracing for Windows (ETW), the convenient tracing mechanism available in the Windows operating system. But for our technology to scale to the very large C++ builds done by our customers, ETW wasn’t enough. We needed to fine-tune the event model and analysis algorithms used. This work resulted in a new data analysis platform for MSVC that we now call C++ Build Insights.

Today, the C++ Build Insights platform is what powers vcperf and some of our internal tools. However, we wanted to give all of you the opportunity to benefit from it, too. To this end, we packaged it up behind C and C++ interfaces to create a full-fledged software development kit.

Get started with the C++ Build Insights SDK

Use the C++ Build Insights SDK to build custom tools that fit your scenarios:

  1. Analyze traces programmatically rather than through WPA.
  2. Add build time analysis into your continuous integration (CI).
  3. Or just have fun!

Here is how you can get started with the SDK. This example shows how to build a program that lists all functions taking more than 500 milliseconds to generate.

Capturing a trace with vcperf. Use the /stopnoanalyze command to obtain a trace that is compatible with the C++ Build Insights SDK.

  1. Download and install a copy of Visual Studio 2019.
  2. Obtain a trace of your build.
    1. Launch an x64 Native Tools Command Prompt for VS 2019.
    2. Run the following command: vcperf /start MySessionName
    3. Build your C++ project from anywhere, even from within Visual Studio (vcperf collects events system-wide).
    4. Run the following command: vcperf /stopnoanalyze MySessionName outputFile.etl. This will save a trace of your build in outputFile.etl.
  3. Launch Visual Studio and create a new C++ project.
  4. Right-click on your project’s name, select Manage NuGet packages… and install the latest Microsoft.Cpp.BuildInsights NuGet package from the official nuget.org feed. You will be prompted to accept the license.
  5. Type in the following code.
  6. Build and run by passing the path to outputFile.etl as the first argument.

#include <iostream>
#include <CppBuildInsights.hpp>

using namespace Microsoft::Cpp::BuildInsights;
using namespace Activities;

class LongCodeGenFinder : public IAnalyzer
{
public:
    // Called by the analysis driver every time an activity stop event
    // is seen in the trace. 
    AnalysisControl OnStopActivity(const EventStack& eventStack) override
    {
        // This will check whether the event stack matches
        // TopFunctionsFinder::CheckForTopFunction's signature.
        // If it does, it will forward the event to the function.

        MatchEventStackInMemberFunction(eventStack, this, 
            &LongCodeGenFinder::CheckForLongFunctionCodeGen);

        // Tells the analysis driver to proceed to the next event

        return AnalysisControl::CONTINUE;
    }

    // This function is used to capture Function activity events that are 
    // within a CodeGeneration activity, and to print a list of functions 
    // that take more than 500 milliseconds to generate.

    void CheckForLongFunctionCodeGen(CodeGeneration cg, Function f)
    {
        using namespace std::chrono;

        if (f.Duration() < milliseconds(500)) {
            return;
        }

        std::cout << "Duration: " << duration_cast<milliseconds>(
            f.Duration()).count();

        std::cout << "t Function Name: " << f.Name() << std::endl;
    }
};

int main(int argc, char *argv[])
{
    if (argc <= 1) return -1;

    LongCodeGenFinder lcgf;

    // Let's make a group of analyzers that will receive
    // events in the trace. We only have one; easy!
    auto group = MakeStaticAnalyzerGroup(&lcgf);

    // argv[1] should contain the path to a trace file
    int numberOfPasses = 1;
    return Analyze(argv[1], numberOfPasses, group);
}

A cloneable and buildable version of this sample is also available on our C++ Build Insights samples GitHub repository.

Note that it’s also possible to obtain a trace programmatically instead of through vcperf by using the SDK. See the official C++ Build Insights SDK documentation for details.

vcperf is now open source

vcperf itself is built using the C++ Build Insights SDK, and we are making it open-source today on GitHub. We hope you will be able to use it to learn more about the SDK, and to customize vcperf to your own needs. The repository includes an example commit that extends vcperf to detect linkers that were restarted due to error conditions. The example highlights these invocations in C++ Build Insights’ Build Explorer view in WPA. We recommend reading this sample commit in the following order:

  1. RestartedLinkerDetector.h
  2. BuildExplorerView.cpp
  3. Commands.cpp

A reason why you might want to build and run vcperf from GitHub today is to gain access to new events that are not yet supported in the released version of vcperf, including the new template instantiation events. Note that vcperf is not tied to any particular version of Visual Studio, but that the new events are only supported in Visual Studio 2019 version 16.4 and above. Here is the updated event table:

Updated event table for the latest version of C++ Build Insights. New events include template instantiation times and force-inlined functions.

Tell us what you think!

We hope you will enjoy the release of the C++ Build Insights SDK, as well as the open-source version of vcperf. Download Visual Studio 2019 today and get started on your first C++ Build Insights application.

In this article, we shared a simple example on how to use the SDK to identify functions taking a long time to generate in your entire build. We also pointed you to useful resources for customizing vcperf. Stay tuned for more examples and code samples in future blog posts!

Would you like the SDK to support additional events? What are some of the ways you have customized vcperf to your needs? Please let us know in the comments below, on Twitter (@VisualC), or via email at visualcpp@microsoft.com.

The post Analyze your builds programmatically with the C++ Build Insights SDK appeared first on C++ Team Blog.

Empowering care teams with new tools in Microsoft 365

OData Connected Service 0.4.0 Release

$
0
0

OData Connected Service 0.4.0 has been released and is now available on the Visual Studio Marketplace.

The new version adds the following features:

  1. Support for Visual Studio 2019 (in addition to Visual Studio 2017)
  2. Option to generate types as internal so that they are not accessible outside the assembly
  3. Bug fixes

In this article, I would like to take you through some key new features and get you up to speed with using the OData Connected Service.

OData Connected Service in Visual Studio 2019

Let’s start by illustrating how you can use the extension in Visual Studio 2019. Open Visual Studio 2019 and create a new C# .Net Core Console project. Let’s call the project “SampleClient”, and the solution “OCSTest”. Once the project is open, click the Extensions menu, then Manage Extensions. In the Manage Extensions window, search for “OData Connected Service”. Select the extension and install it. You may need to close Visual Studio to allow the extension to install, then restart it after installation completes.

Image OCS 0 4 0 Extensions Download

Alternatively, you can just download the VSIX from the marketplace and double click to install.

Once the extension has been installed. Right-click your project in the solution explorer, then in the context menu select Add > Connected Service. This will open the Connected Services window where you can select which services to add to your project. Select OData Connected Service.

Image Add Connected Service MenuImage Connected Services list 8211 Add OCS

Next, a configuration wizard will open where you can configure how code will be generated for your service.

On the first page, we’ll add the metadata URL of the service we want to access. For this example, let’s use the sample Trip Pin Service. Set the service name to “TripPin Service” and the Address to  https://services.odata.org/TripPinRESTierService/$metadata

Then click Finish.

Image Configure OCS Endpoint

After the process completes, the OData docs website will be launched. Go back to Visual Studio and you will see a connected service added to your project and a Reference.cs file that  contains all the code generated from the OData code generator.

Image Connected Service Added to Project

Let’s proceed to use the generate classes to interact with the service. Replace the code in Program.cs with the following:

using System; 
using System.Threading.Tasks;
using Microsoft.OData.Service.Sample.TrippinInMemory.Models;
static class Program
{
    static string serviceUri = "https://services.odata.org/TripPinRESTierService/";
    static Container context = new Container(new Uri(serviceUri));
    static void Main()
    {
        ShowPeople().Wait();
    }

    static async Task ShowPeople()
    {
        var people = await context.People.ExecuteAsync();
        foreach (var person in people)
        {
            Console.WriteLine(person.FirstName);
        }
    }
}

The above program fetches people data from the Trip Pin service and then displays their names. If you run the program, it should display a list of names.

Image OData Connected Service app sample people output

To learn more about using the generated client to interact with an OData service, visit this guide.

Generating types as internal

This feature allows you to mark generated types as internal instead of public, so that they are not accessible outside your assembly.

To illustrate this, let’s add a library project to our OCSTest solution. Right-click the solution and click Add > New Project. Create a C# .Net Standard Class Library project and call it SampleLib. This library will expose a simple method that makes use of the same Trip Pin service we used earlier.

Let’s use the same steps as in the previous section to add an OData Connected Service to this project using the same Trip Pin service metadata endpoint.

Next, let’s add a public class to our library project that will contain the method we want to expose to consumers of the library. Let’s name the file LibService.cs. Let’s add the following code in LibService.cs file:

using System;
using System.Threading.Tasks;
using Microsoft.OData.Service.Sample.TrippinInMemory.Models;

namespace SampleLib
{
    public static class LibService
    {
        private static string serviceUri = "https://services.odata.org/TripPinRESTierService/";
        private static Container context = new Container(new Uri(serviceUri));

        public static async Task<string> GetMostPopularPerson()
        {
            var person = await context.GetPersonWithMostFriends().GetValueAsync();
            return $"{person.FirstName} {person.LastName}";
        }
    }
}

The GetMostPopularPerson() method simply fetches the person with the most friends from the service and returns that person’s full name.

Let’s add a reference to SampleLib in our initial console applicaton so that we can use it. Right click the SampleClient project > Add > Reference > Projects > Solution > SampleLib then press OK.

Image Add SampleLib reference

At this point, we can call the method from our SampleLib library in the Main method of the SampleClient console app, by adding the following line at the end of the Main method. The Main method should now look like:

static void Main()
{
    ShowPeople().Wait();
    Console.WriteLine("Most popular: {0}", SampleLib.LibService.GetMostPopularPerson().Result);
}

If you try to run this application, you will get compiler warnings on the Container class, because both the console app and library define classes with the same names in the same namespace. The console app has access to all the proxy classes of the library because they are public. But this is not what we want, we only want to expose the LibService.GetMostPopularPerson() method from the service, the proxy classes should not be accessible outside the library.

To correct this issue, go to the SampleLib project in the solution explorer, under the Connected Services node, you will see a folder for the connected service you added, which is TripPin Service in our example. Right click the folder and select Update Connected Service.

Image Update OCS Menu

This will open up the OData Connected Wizard and allow you to update the configuration. On the Endpoint page click Next to navigate to the Settings page, then click the AdvancedSettings link to reveal more options. Check the Mark generated types as internal checkbox and click Finish.

Image Make types internal OCS option

When asked whether to replace the existing Reference.cs file, click Yes. After the code generation is complete, you can open the generated Reference.cs file and confirm that all top-level classes and enums have an internal access modifier.

Image Generated code with internal modifier

Finally, build and run the SampleClient project, you will not see the warnings again. The program will display the name of the person with most friends at the end.

Image OData Connected Service app sample output with most popular person

Minor updates and bug fixes

The ByKey method now accepts an IDictionary as a parameter as opposed to the concrete Dictionary class that it allowed before. This allows you to pass your own implementation of IDictionary instead of the standard Dictionary when you need to.

In addition, references to EdmxReader have been replaced with Microsoft.OData.Edm.Csdl.CsdlReader. This fixes some of the compilation errors that occurred in the generated code in the previous version.


There are more features and fixes coming to OData Connected Service soon, so stay tuned for upcoming releases.

The post OData Connected Service 0.4.0 Release appeared first on OData.

Accelerate your Windows Virtual Desktop deployment—join our virtual event

Making a cleaner and more intentional azure-pipelines.yml for an ASP.NET Core Web App

$
0
0

Azure Pipelines releasing to LinuxA few months back I moved my CI/CD (Continuous Integration/Continuous Development) to Azure DevOps for free. You get 1800 build minutes a month FREE and I'm not even close to using it with three occasionally-updated sites building on it.
It wasn't too hard, but as with all build pipelines you'll end up with a bunch of trial and error builds until you really get it dialed in.

I was working/pairing with Damian today because I wanted to get my git commit hashes and build ids embedded into the actual website so I could see exactly what commit is in production. How to do that will be the next post!

However, while tidying up we noticed some possible speed up and potential issues with my original azurepipeslines.yml file, so here's my new one!

NOTE: There's MANY ways to write one of these. For example, note that I'm allowing the "dotnet restore" to happen automatically as a sign effect of the call to dotnet build. Damian prefers to make that more explicit as its own task so he can see timing info for it. It's up to you, just know the side effects and measure!

Let's read the YAML and see what's up here.

  • My primary Git branch is called "main" so my Pipeline triggers on commits to main.
  • I'm using a VM from the pool that's the latest Ubuntu.
  • I'm doing a Release (not Debug) build and putting that value in a variable that I can use later in the pipeline.
  • I'm using a "runtime id" of linux-x64 and I'm storing that value also for use later. That's the .NET Core runtime I'm interested in.
  • I'm passing in the -r $(rid) to be absolutely clear about my intent at every step.
  • I want to build ONCE so I'm using --no-build on the publish command. It's likely not needed, but because I was using a rid on the build and then not using it later, my publish was wasting time by building again.
  • The dotnet test command uses -r for results (dumb) so I have to pass in --runtime if I want to pass in a rid. Again, likely not needed, but it's explicit.
  • I publish and name the artifact (fancy word for the resulting ZIP file) so it can be used later in the Deployment pipeline.

Here's the YAML

# https://docs.microsoft.com/azure/devops/pipelines/languages/dotnet-core


trigger:
- main

pool:
vmImage: 'ubuntu-latest'

variables:
buildConfiguration: 'Release'
rid: 'linux-x64'

steps:
- task: UseDotNet@2
inputs:
version: '3.1.x'
packageType: sdk

- task: DotNetCoreCLI@2
displayName: 'dotnet build $(buildConfiguration)'
inputs:
command: 'build'
arguments: '-r $(rid) --configuration $(buildConfiguration) /p:SourceRevisionId=$(Build.SourceVersion)'

- task: DotNetCoreCLI@2
displayName: "Test"
inputs:
command: test
projects: '**/*tests/*.csproj'
arguments: '--runtime $(rid) --configuration $(buildConfiguration)'

- task: DotNetCoreCLI@2
displayName: "Publish"
inputs:
command: 'publish'
publishWebProjects: true
arguments: '-r $(rid) --no-build --configuration $(BuildConfiguration) --output $(Build.ArtifactStagingDirectory)'
zipAfterPublish: true

- task: PublishBuildArtifacts@1
displayName: "Upload Artifacts"
inputs:
pathtoPublish: '$(Build.ArtifactStagingDirectory)'
artifactName: 'hanselminutes'

Did I miss anything? What are your best tips for a clean YAML file that you can use to build and deploy a .NET Web app?


Sponsor: This week's sponsor is...me! This blog and my podcast has been a labor of love for over 18 years. Your sponsorship pays my hosting bills for both AND allows me to buy gadgets to review AND the occasional taco. Join me!


© 2019 Scott Hanselman. All rights reserved.
     
Viewing all 5971 articles
Browse latest View live