Quantcast
Channel: Category Name
Viewing all 5971 articles
Browse latest View live

Announcing TypeScript 3.8

$
0
0

Today we’re proud to release TypeScript 3.8!

For those unfamiliar with TypeScript, it’s a language that adds syntax for types on top of JavaScript which can be analyzed through a process called static type-checking. This type-checking can tell us about errors like typos and values that are potentially null and undefined before we even run our code. More than just that, that same type analysis can be used to provide a solid editing experience for both TypeScript and JavaScript, powering operations like code completion, find-all-references, quick fixes, and refactorings. In fact, if you’re already using JavaScript in an editor like Visual Studio and Visual Studio Code, your editing experience is really being powered by TypeScript! So if you’re interested in learning more, head over to our website.

If you’re already ready to use TypeScript, you can get it through NuGet, or use npm with the following command:

npm install typescript

You can also get editor support by

TypeScript 3.8 brings a lot of new features, including new or upcoming ECMAScript standards features, new syntax for importing/exporting only types, and more.

Type-Only Imports and Exports

This feature is something most users may never have to think about; however, if you’ve hit issues here, it might be of interest (especially when compiling under --isolatedModules, our transpileModule API, or Babel).

TypeScript reuses JavaScript’s import syntax in order to let us reference types. For instance, in the following example, we’re able to import doThing which is a JavaScript value along with Options which is purely a TypeScript type.

// ./foo.ts
interface Options {
    // ...
}

export function doThing(options: Options) {
    // ...
}

// ./bar.ts
import { doThing, Options } from "./foo.js";

function doThingBetter(options: Options) {
    // do something twice as good
    doThing(options);
    doThing(options);
}

This is convenient because most of the time we don’t have to worry about what’s being imported – just that we’re importing something.

Unfortunately, this only worked because of a feature called import elision. When TypeScript outputs JavaScript files, it sees that Options is only used as a type, and it automatically drops its import. The resulting output looks kind of like this:

// ./foo.js
export function doThing(options: Options) {
    // ...
}

// ./bar.js
import { doThing } from "./foo.js";

function doThingBetter(options: Options) {
    // do something twice as good
    doThing(options);
    doThing(options);
}

Again, this behavior is usually great, but it causes some other problems.

First of all, there are some places where it’s ambiguous whether a value or a type is being exported. For example, in the following example is MyThing a value or a type?

import { MyThing } from "./some-module.js";

export { MyThing };

Limiting ourselves to just this file, there’s no way to know. Both Babel and TypeScript’s transpileModule API will emit code that doesn’t work correctly if MyThing is only a type, and TypeScript’s isolatedModules flag will warn us that it’ll be a problem. The real problem here is that there’s no way to say “no, no, I really only meant the type – this should be erased”, so import elision isn’t good enough.

The other issue was that TypeScript’s import elision would get rid of import statements that only contained imports used as types. That caused observably different behavior for modules that have side-effects, and so users would have to insert a second import statement purely to ensure side-effects.

// This statement will get erased because of import elision.
import { SomeTypeFoo, SomeOtherTypeBar } from "./module-with-side-effects";

// This statement always sticks around.
import "./module-with-side-effects";

A concrete place where we saw this coming up was in frameworks like Angular.js (1.x) where services needed to be registered globally (which is a side-effect), but where those services were only imported for types.

// ./service.ts
export class Service {
    // ...
}
register("globalServiceId", Service);

// ./consumer.ts
import { Service } from "./service.js";

inject("globalServiceId", function (service: Service) {
    // do stuff with Service
});

As a result, ./service.js will never get run, and things will break at runtime.

To avoid this class of issues, we realized we needed to give users more fine-grained control over how things were getting imported/elided.

As a solution in TypeScript 3.8, we’ve added a new syntax for type-only imports and exports.

import type { SomeThing } from "./some-module.js";

export type { SomeThing };

import type only imports declarations to be used for type annotations and declarations. It always gets fully erased, so there’s no remnant of it at runtime. Similarly, export type only provides an export that can be used for type contexts, and is also erased from TypeScript’s output.

It’s important to note that classes have a value at runtime and a type at design-time, and the use is context-sensitive. When using import type to import a class, you can’t do things like extend from it.

import type { Component } from "react";

interface ButtonProps {
    // ...
}

class Button extends Component<ButtonProps> {
    //               ~~~~~~~~~
    // error! 'Component' only refers to a type, but is being used as a value here.

    // ...
}

If you’ve used Flow before, the syntax is fairly similar. One difference is that we’ve added a few restrictions to avoid code that might appear ambiguous.

// Is only 'Foo' a type? Or every declaration in the import?
// We just give an error because it's not clear.

import type Foo, { Bar, Baz } from "some-module";
//     ~~~~~~~~~~~~~~~~~~~~~~
// error! A type-only import can specify a default import or named bindings, but not both.

In conjunction with import type, we’ve also added a new compiler flag to control what happens with imports that won’t be utilized at runtime: importsNotUsedAsValues. This flag takes 3 different values:

  • remove: this is today’s behavior of dropping these imports. It’s going to continue to be the default, and is a non-breaking change.
  • preserve: this preserves all imports whose values are never used. This can cause imports/side-effects to be preserved.
  • error: this preserves all imports (the same as the preserve option), but will error when a value import is only used as a type. This might be useful if you want to ensure no values are being accidentally imported, but still make side-effect imports explicit.

For more information about the feature, you can take a look at the pull request, and relevant changes around broadening where imports from an import type declaration can be used.

ECMAScript Private Fields

TypeScript 3.8 brings support for ECMAScript’s private fields, part of the stage-3 class fields proposal. This work was started and driven to completion by our good friends at Bloomberg!

class Person {
    #name: string

    constructor(name: string) {
        this.#name = name;
    }

    greet() {
        console.log(`Hello, my name is ${this.#name}!`);
    }
}

let jeremy = new Person("Jeremy Bearimy");

jeremy.#name
//     ~~~~~
// Property '#name' is not accessible outside class 'Person'
// because it has a private identifier.

Unlike regular properties (even ones declared with the private modifier), private fields have a few rules to keep in mind. Some of them are:

  • Private fields start with a # character. Sometimes we call these private names.
  • Every private field name is uniquely scoped to its containing class.
  • TypeScript accessibility modifiers like public or private can’t be used on private fields.
  • Private fields can’t be accessed or even detected outside of the containing class – even by JS users! Sometimes we call this hard privacy.

Apart from “hard” privacy, another benefit of private fields is that uniqueness we just mentioned. For example, regular property declarations are prone to being overwritten in subclasses.

class C {
    foo = 10;

    cHelper() {
        return this.foo;
    }
}

class D extends C {
    foo = 20;

    dHelper() {
        return this.foo;
    }
}

let instance = new D();
// 'this.foo' refers to the same property on each instance.
console.log(instance.cHelper()); // prints '20'
console.log(instance.dHelper()); // prints '20'

With private fields, you’ll never have to worry about this, since each field name is unique to the containing class.

class C {
    #foo = 10;

    cHelper() {
        return this.#foo;
    }
}

class D extends C {
    #foo = 20;

    dHelper() {
        return this.#foo;
    }
}

let instance = new D();
// 'this.#foo' refers to a different field within each class.
console.log(instance.cHelper()); // prints '10'
console.log(instance.dHelper()); // prints '20'

Another thing worth noting is that accessing a private field on any other type will result in a TypeError!

class Square {
    #sideLength: number;

    constructor(sideLength: number) {
        this.#sideLength = sideLength;
    }

    equals(other: any) {
        return this.#sideLength === other.#sideLength;
    }
}

const a = new Square(100);
const b = { sideLength: 100 };

// Boom!
// TypeError: attempted to get private field on non-instance
// This fails because 'b' is not an instance of 'Square'.
console.log(a.equals(b));

Finally, for any plain .js file users, private fields always have to be declared before they’re assigned to.

class C {
    // No declaration for '#foo'
    // :(

    constructor(foo: number) {
        // SyntaxError!
        // '#foo' needs to be declared before writing to it.
        this.#foo = foo;
    }
}

JavaScript has always allowed users to access undeclared properties, whereas TypeScript has always required declarations for class properties. With private fields, declarations are always needed regardless of whether we’re working in .js or .ts files.

class C {
    /** @type {number} */
    #foo;

    constructor(foo: number) {
        // This works.
        this.#foo = foo;
    }
}

For more information about the implementation, you can check out the original pull request

Which should I use?

We’ve already received many questions on which type of privates you should use as a TypeScript user: most commonly, “should I use the private keyword, or ECMAScript’s hash/pound (#) private fields?”

Like all good questions, the answer is not good: it depends!

When it comes to properties, TypeScript’s private modifiers are fully erased – that means that at runtime, it acts entirely like a normal property and there’s no way to tell that it was declared with a private modifier. When using the private` keyword, privacy is only enforced at compile-time/design-time, and for JavaScript consumers it’s entirely intent-based.

class C {
    private foo = 10;
}

// This is an error at compile time,
// but when TypeScript outputs .js files,
// it'll run fine and print '10'.
console.log(new C().foo);    // prints '10'
//                  ~~~
// error! Property 'foo' is private and only accessible within class 'C'.

// TypeScript allows this at compile-time
// as a "work-around" to avoid the error.
console.log(new C()["foo"]); // prints '10'

The upside is that this sort of “soft privacy” can help your consumers temporarily work around not having access to some API, and also works in any runtime.

On the other hand, ECMAScript’s # privates are completely inaccessible outside of the class.

class C {
    #foo = 10;
}

console.log(new C().#foo); // SyntaxError
//                  ~~~~
// TypeScript reports an error *and*
// this won't work at runtime!

console.log(new C()["#foo"]); // prints undefined
//          ~~~~~~~~~~~~~~~
// TypeScript reports an error under 'noImplicitAny',
// and this prints 'undefined'.

This hard privacy is really useful for strictly ensuring that nobody can take use of any of your internals. If you’re a library author, removing or renaming a private field should never cause a breaking change.

As we mentioned, another benefit is that subclassing can be easier with ECMAScript’s # privates because they really are private. When using ECMAScript # private fields, no subclass ever has to worry about collisions in field naming. When it comes to TypeScript’s private property declarations, users still have to be careful not to trample over properties declared in superclasses.

One more thing to think about is where you intend for your code to run. TypeScript currently can’t support this feature unless targeting ECMAScript 2015 (ES6) targets or higher. This is because our downleveled implementation uses WeakMaps to enforce privacy, and WeakMaps can’t be polyfilled in a way that doesn’t cause memory leaks. In contrast, TypeScript’s private-declared properties work with all targets – even ECMAScript 3!

A final consideration might be speed: private properties are no different from any other property, so accessing them is as fast as any other property access no matter which runtime you target. In contrast, because # private fields are downleveled using WeakMaps, they may be slower to use. While some runtimes might optimize their actual implementations of # private fields, and even have speedy WeakMap implementations, that might not be the case in all runtimes.

Kudos!

It’s worth reiterating how much work went into this feature from our contributors at Bloomberg. They were diligent in taking the time to learn to contribute features to the compiler/language service, and paid close attention to the ECMAScript specification to test that the feature was implemented in compliant manner. They even improved another 3rd party project, CLA Assistant, which made contributing to TypeScript even easier.

We’d like to extend a special thanks to:

export * as ns Syntax

It’s often common to have a single entry-point that exposes all the members of another module as a single member.

import * as utilities from "./utilities.js";
export { utilities };

This is so common that ECMAScript 2020 recently added a new syntax to support this pattern!

export * as utilities from "./utilities.js";

This is a nice quality-of-life improvement to JavaScript, and TypeScript 3.8 implements this syntax. When your module target is earlier than es2020, TypeScript will output something along the lines of the first code snippet.

Special thanks to community member Wenlu Wang (Kingwl) who implemented this feature! For more information, check out the original pull request.

Top-Level await

Most modern environments that provide I/O in JavaScript (like HTTP requests) is asynchronous, and many modern APIs return Promises. While this has a lot of benefits in making operations non-blocking, it makes certain things like loading files or external content surprisingly tedious.

fetch("...")
    .then(response => response.text())
    .then(greeting => { console.log(greeting) });

To avoid .then chains with Promises, JavaScript users often introduced an async function in order to use await, and then immediately called the function after defining it.

async function main() {
    const response = await fetch("...");
    const greeting = await response.text();
    console.log(greeting);
}

main()
    .catch(e => console.error(e))

To avoid introducing an async function, we can use a handy upcoming ECMAScript feature called “top-level await“.

Previously in JavaScript (along with most other languages with a similar feature), await was only allowed within the body of an async function. However, with top-level await, we can use await at the top level of a module.

const response = await fetch("...");
const greeting = await response.text();
console.log(greeting);

// Make sure we're a module
export {};

Note there’s a subtlety: top-level await only works at the top level of a module, and files are only considered modules when TypeScript finds an import or an export. In some basic cases, you might need to write out export {} as some boilerplate to make sure of this.

Top level await may not work in all environments where you might expect at this point. Currently, you can only use top level await when the target compiler option is es2017 or above, and module is esnext or system. Support within several environments and bundlers may be limited or may require enabling experimental support.

For more information on our implementation, you can check out the original pull request.

es2020 for target and module

Thanks to Kagami Sascha Rosylight (saschanaz), TypeScript 3.8 supports es2020 as an option for module and target. This will preserve newer ECMAScript 2020 features like optional chaining, nullish coalescing, export * as ns, and dynamic import(...) syntax. It also means bigint literals now have a stable target below esnext.

JSDoc Property Modifiers

TypeScript 3.8 supports JavaScript files by turning on the allowJs flag, and also supports type-checking those JavaScript files via the checkJs option or by adding a // @ts-check comment to the top of your .js files.

Because JavaScript files don’t have dedicated syntax for type-checking, TypeScript leverages JSDoc. TypeScript 3.8 understands a few new JSDoc tags for properties.

First are the accessibility modifiers: @public, @private, and @protected. These tags work exactly like public, private, and protected respectively work in TypeScript.

// @ts-check

class Foo {
    constructor() {
        /** @private */
        this.stuff = 100;
    }

    printStuff() {
        console.log(this.stuff);
    }
}

new Foo().stuff;
//        ~~~~~
// error! Property 'stuff' is private and only accessible within class 'Foo'.
  • @public is always implied and can be left off, but means that a property can be reached from anywhere.
  • @private means that a property can only be used within the containing class.
  • @protected means that a property can only be used within the containing class, and all derived subclasses, but not on dissimilar instances of the containing class.

Next, we’ve also added the @readonly modifier to ensure that a property is only ever written to during initialization.

// @ts-check

class Foo {
    constructor() {
        /** @readonly */
        this.stuff = 100;
    }

    writeToStuff() {
        this.stuff = 200;
        //   ~~~~~
        // Cannot assign to 'stuff' because it is a read-only property.
    }
}

new Foo().stuff++;
//        ~~~~~
// Cannot assign to 'stuff' because it is a read-only property.

Better Directory Watching on Linux and watchOptions

TypeScript 3.8 ships a new strategy for watching directories, which is crucial for efficiently picking up changes to node_modules.

For some context, on operating systems like Linux, TypeScript installs directory watchers (as opposed to file watchers) on node_modules and many of its subdirectories to detect changes in dependencies. This is because the number of available file watchers is often eclipsed by the of files in node_modules, whereas there are way fewer directories to track.

Older versions of TypeScript would immediately install directory watchers on folders, and at startup that would be fine; however, during an npm install, a lot of activity will take place within node_modules and that can overwhelm TypeScript, often slowing editor sessions to a crawl. To prevent this, TypeScript 3.8 waits slightly before installing directory watchers to give these highly volatile directories some time to stabilize.

Because every project might work better under different strategies, and this new approach might not work well for your workflows, TypeScript 3.8 introduces a new watchOptions field in tsconfig.json and jsconfig.json which allows users to tell the compiler/language service which watching strategies should be used to keep track of files and directories.

{
    // Some typical compiler options
    "compilerOptions": {
        "target": "es2020",
        "moduleResolution": "node",
        // ...
    },

    // NEW: Options for file/directory watching
    "watchOptions": {
        // Use native file system events for files and directories
        "watchFile": "useFsEvents",
        "watchDirectory": "useFsEvents",

        // Poll files for updates more frequently
        // when they're updated a lot.
        "fallbackPolling": "dynamicPriority"
    }
}

watchOptions contains 4 new options that can be configured:

  • watchFile: the strategy for how individual files are watched. This can be set to
    • fixedPollingInterval: Check every file for changes several times a second at a fixed interval.
    • priorityPollingInterval: Check every file for changes several times a second, but use heuristics to check certain types of files less frequently than others.
    • dynamicPriorityPolling: Use a dynamic queue where less-frequently modified files will be checked less often.
    • useFsEvents (the default): Attempt to use the operating system/file system’s native events for file changes.
    • useFsEventsOnParentDirectory: Attempt to use the operating system/file system’s native events to listen for changes on a file’s containing directories. This can use fewer file watchers, but might be less accurate.
  • watchDirectory: the strategy for how entire directory trees are watched under systems that lack recursive file-watching functionality. This can be set to:
    • fixedPollingInterval: Check every directory for changes several times a second at a fixed interval.
    • dynamicPriorityPolling: Use a dynamic queue where less-frequently modified directories will be checked less often.
    • useFsEvents (the default): Attempt to use the operating system/file system’s native events for directory changes.
  • fallbackPolling: when using file system events, this option specifies the polling strategy that gets used when the system runs out of native file watchers and/or doesn’t support native file watchers. This can be set to
    • fixedPollingInterval: (See above.)
    • priorityPollingInterval: (See above.)
    • dynamicPriorityPolling: (See above.)
  • synchronousWatchDirectory: Disable deferred watching on directories. Deferred watching is useful when lots of file changes might occur at once (e.g. a change in node_modules from running npm install), but you might want to disable it with this flag for some less-common setups.

For more information on these changes, head over to GitHub to see the pull request to read more.

“Fast and Loose” Incremental Checking

TypeScript’s --watch mode and --incremental mode can help tighten the feedback loop for projects. Turning on --incremental mode makes TypeScript keep track of which files can affect others, and on top of doing that, --watch mode keeps the compiler process open and reuses as much information in memory as possible.

However, for much larger projects, even the dramatic gains in speed that these options afford us isn’t enough. For example, the Visual Studio Code team had built their own build tool around TypeScript called gulp-tsb which would be less accurate in assessing which files needed to be rechecked/rebuilt in its watch mode, and as a result, could provide drastically low build times.

Sacrificing accuracy for build speed, for better or worse, is a tradeoff many are willing to make in the TypeScript/JavaScript world. Lots of users prioritize tightening their iteration time over addressing the errors up-front. As an example, it’s fairly common to build code regardless of the results of type-checking or linting.

TypeScript 3.8 introduces a new compiler option called assumeChangesOnlyAffectDirectDependencies. When this option is enabled, TypeScript will avoid rechecking/rebuilding all truly possibly-affected files, and only recheck/rebuild files that have changed as well as files that directly import them.

For example, consider a file fileD.ts that imports fileC.ts that imports fileB.ts that imports fileA.ts as follows:

fileA.ts <- fileB.ts <- fileC.ts <- fileD.ts

In --watch mode, a change in fileA.ts would typically mean that TypeScript would need to at least re-check fileB.ts, fileC.ts, and fileD.ts. Under assumeChangesOnlyAffectDirectDependencies, a change in fileA.ts means that only fileA.ts and fileB.ts need to be re-checked.

In a codebase like Visual Studio Code, this reduced rebuild times for changes in certain files from about 14 seconds to about 1 second. While we don’t necessarily recommend this option for all codebases, you might be interested if you have an extremely large codebase and are willing to defer full project errors until later (e.g. a dedicated build via a tsconfig.fullbuild.json or in CI).

For more details, you can see the original pull request.

Editor Features

Convert to Template String

Thanks to Arooran Thanabalasingam (bigaru), TypeScript 3.8 ships a new refactoring to convert string concatenations like

"I have " + numApples + " apples"

into template strings like the following.

`I have ${numApples} apples`
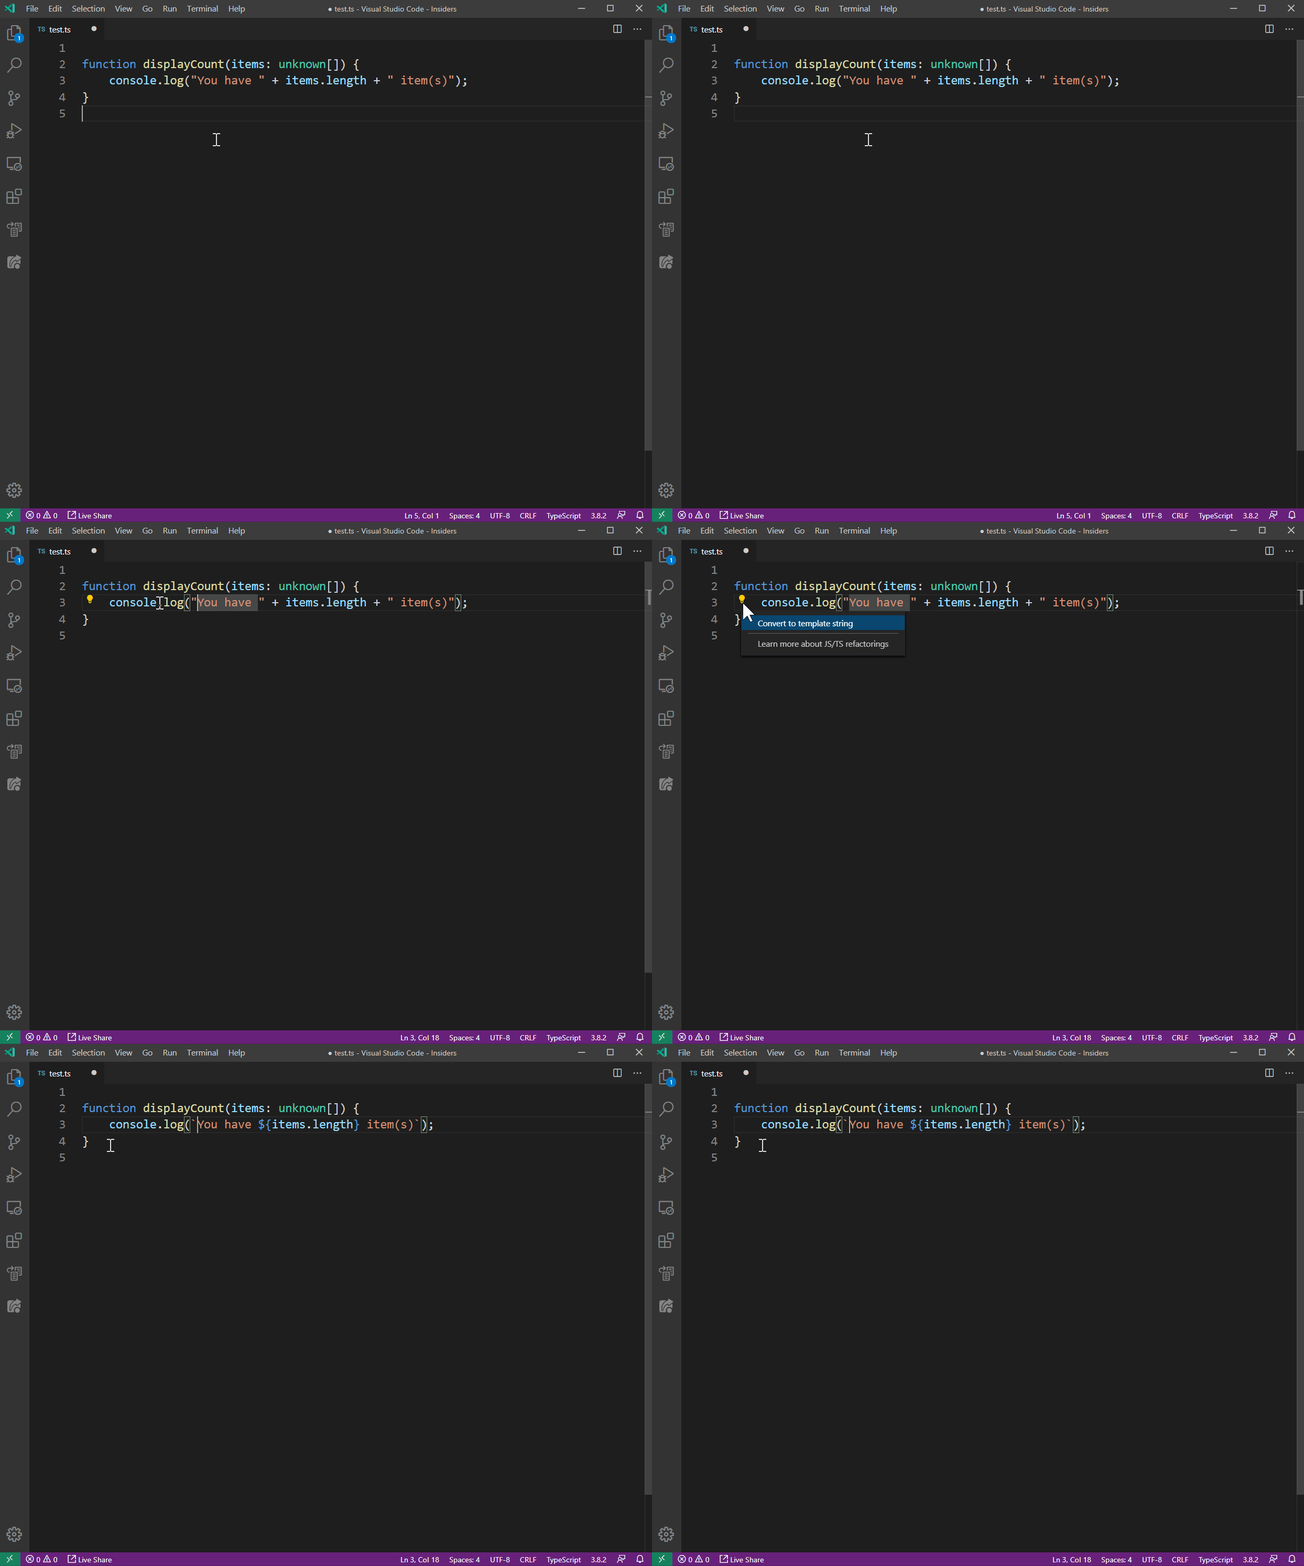
Convert to template string in action

Call Hierarchy

It’s often useful to figure out who’s calling a given function. TypeScript has a way to find all references of a declaration (i.e. the Find All References command), and most people can use that to answer that question – but it can be slightly cumbersome. For example, imagine trying to find out who calls a function named foo.

export function foo() {
    // ...
}

// later, much farther away from 'foo'...
export function bar() {
    foo();
}

export function baz() {
    foo()
}

Once we find out that foo is called by bar and baz, we also want to know who calls bar and baz too! So we can invoke Find All References on bar and baz too, but that loses the context of who’s calling foo, the question we were originally trying to answer.

To address the limitations here, some editors have a feature to visualize the ways a function will be called through a command called Show Call Hierarchy, and TypeScript 3.8 officially supports the Call Hierarchy feature.
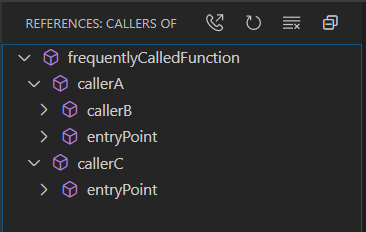
A screenshot of call hierarchy

Call Hierarchy might be a bit confusing at first, and it takes a bit of usage to build up an intuition around it. Let’s consider the following code.

function frequentlyCalledFunction() {
    // do something useful
}

function callerA() {
    frequentlyCalledFunction();
}

function callerB() {
    callerA();
}

function callerC() {
    frequentlyCalledFunction();
}

function entryPoint() {
    callerA();
    callerB();
    callerC();
}

The following textual tree diagram shows the call hierarchy of frequentlyCalledFunction.

frequentlyCalledFunction
 │
 ├─callerA
 │  ├─ callerB
 │  │   └─ entryPoint
 │  │
 │  └─ entryPoint
 │
 └─ callerC
     └─ entryPoint

Here we see that the immediate callers of frequentlyCalledFunction are callerA and callerB. If we want to know who calls callerA, we can see that our program’s entryPoint calls it directly, along with a function called callerB. We can further expand out the callers of callerB and callerC to see that they’re only called within the entryPoint function.

Call Hierarchy is already supported for TypeScript and JavaScript in Visual Studio Code Insiders, and will be available in the next stable version.

Call Hierarchy in action

Breaking Changes

TypeScript 3.8 contains a few minor breaking changes that should be noted.

Stricter Assignability Checks to Unions with Index Signatures

Previously, excess properties were unchecked when assigning to unions where any type had an index signature – even if that excess property could never satisfy that index signature. In TypeScript 3.8, the type-checker is stricter, and only “exempts” properties from excess property checks if that property could plausibly satisfy an index signature.

const obj1: { [x: string]: number } | { a: number };

obj1 = { a: 5, c: 'abc' }
//             ~
// Error!
// The type '{ [x: string]: number }' no longer exempts 'c'
// from excess property checks on '{ a: number }'.

let obj2: { [x: string]: number } | { [x: number]: number };

obj2 = { a: 'abc' };
//       ~
// Error!
// The types '{ [x: string]: number }' and '{ [x: number]: number }' no longer exempts 'a'
// from excess property checks against '{ [x: number]: number }',
// and it *is* sort of an excess property because 'a' isn't a numeric property name.
// This one is more subtle.

Optional Arguments with no Inferences are Correctly Marked as Implicitly any

In the following code, param is now marked with an error under noImplicitAny.

function foo(f: () => void) {
    // ...
}

foo((param?) => {
    // ...
});

This is because there is no corresponding parameter for the type of f in foo. This seems unlikely to be intentional, but it can be worked around by providing an explicit type for param.

object in JSDoc is No Longer any Under noImplicitAny

Historically, TypeScript’s support for checking JavaScript has been lax in certain ways in order to provide an approachable experience.

For example, users often used Object in JSDoc to mean, “some object, I dunno what”, we’ve treated it as any.

// @ts-check

/**
 * @param thing {Object} some object, i dunno what
 */
function doSomething(thing) {
    let x = thing.x;
    let y = thing.y;
    thing();
}

This is because treating it as TypeScript’s Object type would end up in code reporting uninteresting errors, since the Object type is an extremely vague type with few capabilities other than methods like toString and valueOf.

However, TypeScript does have a more useful type named object (notice that lowercase o). The object type is more restrictive than Object, in that it rejects all primitive types like string, boolean, and number. Unfortunately, both Object and object were treated as any in JSDoc.

Because object can come in handy and is used significantly less than Object in JSDoc, we’ve removed the special-case behavior in JavaScript files when using noImplicitAny so that in JSDoc, the object type really refers to the non-primitive object type.

What’s Next?

We anticipate that our next version, TypeScript 3.9, will be coming mid-May of 2020, and will mostly focus on performance, polish, and potentially smarter type-checking for Promises. In the coming days our planning documents will be published to give an idea of specifics.

But please don’t wait until 3.9 – 3.8 is a fantastic release with lots of great improvements, so grab it today!

Have fun, and happy hacking!

– Daniel Rosenwasser and the TypeScript Team

The post Announcing TypeScript 3.8 appeared first on TypeScript.


Azure Cost Management + Billing updates – February 2020

$
0
0

Whether you're a new student, thriving startup, or the largest enterprise, you have financial constraints and you need to know what you're spending, where, and how to plan for the future. Nobody wants a surprise when it comes to the bill, and this is where Azure Cost Management + Billing comes in.

We're always looking for ways to learn more about your challenges and how Azure Cost Management + Billing can help you better understand where you're accruing costs in the cloud, identify and prevent bad spending patterns, and optimize costs to empower you to do more with less. Here are a few of the latest improvements and updates based on your feedback:

Let's dig into the details.


New Power BI reports for Azure reservations and Azure Hybrid Benefit

Azure Cost Management + Billing offers several ways to report on your cost and usage data. You can start in the portal, download data or schedule an automated export for offline analysis, or even integrate with Cost Management APIs directly. But maybe you just need detailed reporting alongside other business reports. This is where the Power BI comes in. We last talked about the addition of reservation purchases in the Azure Cost Management Power BI connector in October. Building on top of that, the new Azure Cost Management Power BI app offers an extensive set of reports to get you started, including detailed reservation and Azure Hybrid Benefit reports.

The Account overview offers a summary of all usage and purchases as well as your credit balance to help you track monthly expenses. From here, you can dig in to usage costs broken down by subscription, resource group, or service in additional pages. Or, if you simply want to see your prices, take a look at the Price sheet page.

If you’re already using Azure Hybrid Benefit (AHB) or have existing, unused on-prem Windows licenses, check out the Windows Server AHB Usage page. Start by checking how many VMs currently have AHB enabled to determine if you have additional licenses that could help you further lower your costs. If you do have additional licenses, you can also identify eligible VMs based on their core/vCPU count. Apply AHB to your most expensive VMs to maximize your potential savings.

Azure Hybrid Benefit (AHB) report in the new Azure Cost Management Power BI app

If you’re using Azure reservations or are interested in potential savings you could benefit from if you did, you’ll want to check out the VM RI coverage pages to identify any new opportunities where you can save with new reservations, including the historical usage so you can see why that reservation is recommended. You can drill in to a specific region or instance size flexibility group and more. You can see your past purchases in the RI purchases page and get a breakdown of those costs by region, subscription, or resource group in the RI chargeback page, if you need to do any internal chargeback. And, don’t forget to check out the RI savings page, where you can see how much you’ve saved so far by using Azure reservations.

Azure reservation coverage report in the new Azure Cost Management Power BI app

This is just the first release of a new generation of Power BI reports. Get started with the Azure Cost Management Power BI quickstart today and let us know what you’d like to see next.


Quicker access to help and support

Learning something new can be a challenge; especially when it's not your primary focus. But given how critical it is to meet your financial goals, getting help and support needs to be front and center. To support this, Cost Management now includes a contextual Help menu to direct you to documentation and support experiences.

Get started with a quickstart tutorial and, when you're ready to automate that experience or integrate it into your own apps, check out the API reference. If you have any suggestions on how the experience could be improved for you, please don't hesitate to share your feedback. If you run into an issue or see something that doesn't make sense, start with Diagnose and solve problems, and if you don't see a solution, then please do submit a new support request. We're closely monitoring all feedback and support requests to identify ways the experience could be streamlined for you. Let us know what you'd like to see next.

Help menu in Azure Cost Management showing options to navigate to a Quickstart tutorial, API reference, Feedback, Diagnose and solve problems, and New support request


We need your feedback

As you know, we're always looking for ways to learn more about your needs and expectations. This month, we'd like to learn more about how you report on and analyze your cloud usage and costs in a brief survey. We'll use your inputs from this survey to inform ease of use and navigation improvements within Cost Management + Billing experiences. The 15-question survey should take about 10 minutes.

Take the survey.


What's new in Cost Management Labs

With Cost Management Labs, you get a sneak peek at what's coming in Azure Cost Management and can engage directly with us to share feedback and help us better understand how you use the service, so we can deliver more tuned and optimized experiences. Here are a few features you can see in Cost Management Labs:

  • Get started quicker with the cost analysis Home view
    Azure Cost Management offers five built-in views to get started with understanding and drilling into your costs. The Home view gives you quick access to those views so you get to what you need faster.
  • New: More details in the cost by resource view
    Drill in to the cost of your resources to break them down by meter. Simply expand the row to see more details or click the link to open and take action on your resources.
  • New: Explain what "not applicable" means
    Break down "not applicable" to explain why specific properties don't have values within cost analysis.

Of course, that's not all. Every change in Azure Cost Management is available in Cost Management Labs a week before it's in the full Azure portal. We're eager to hear your thoughts and understand what you'd like to see next. What are you waiting for? Try Cost Management Labs today.


Drill in to the costs for your resources

Resources are the fundamental building block in the cloud. Whether you're using the cloud as infrastructure or componentized microservices, you use resources to piece together your solution and achieve your vision. And how you use these resources ultimately determines what you're billed for, which breaks down to individual "meters" for each of your resources. Each service tracks a unique set of meters covering time, size, or other generalized unit. The more units you use, the higher the cost.

Today, you can see costs broken down by resource or meter with built-in views, but seeing both together requires additional filtering and grouping to get down to the data you need, which can be tedious. To simplify this, you can now expand each row in the Cost by resource view to see the individual meters that contribute to the cost of that resource.

Cost by resource view showing a breakdown of meters under a resource

This additional clarity and transparency should help you better understand the costs you're accruing for each resource at the lowest level. And if you see a resource that shouldn't be running, simply click the name to open the resource, where you can stop or delete it to avoid incurring additional cost.

You can see the updated Cost by resource view in Cost Management Labs today, while in preview. Let us know if you have any feedback. We'd love to know what you'd like to see next. This should be available everywhere within the next few weeks.


Understanding why you see "not applicable"

Azure Cost Management + Billing includes all usage, purchases, and refunds for your billing account. Seeing every line item in the full usage and charges file allows you to reconcile your bill at the lowest level, but since each of these records has different properties, aggregating them within cost analysis can result in groups of empty properties. This is when you see "not applicable" today.

Now, in Cost Management Labs, you can see these costs broken down and categorized into separate groups to bring additional clarity and explain what each represents. Here are a few examples:

  • You may see Other classic resources for any classic resources that don't include resource group in usage data when grouping by resource or resource group.
  • If you're using any services that aren't deployed to resource groups, like Security Center or Azure DevOps (Visual Studio Online), you will see Other subscription resources when grouping by resource group.
  • You may recall seeing Untagged costs when grouping by a specific tag. This group is now broken down further into Tags not available and Tags not supported groups. These signify services that don't include tags in usage data (see How tags are used) and costs that can't be tagged, like purchases and resources not deployed to resource groups, covered above.
  • Since purchases aren't associated with an Azure resource, you might see Other Azure purchases or Other Marketplace purchases when grouping by resource, resource group, or subscription.
  • You may also see Other Marketplace purchases when grouping by reservation. This represents other purchases, which aren't associated with a reservation.
  • If you have a reservation, you may see Unused reservation when viewing amortized costs and grouping by resource, resource group, or subscription. This represents the unused portion of your reservation that isn't associated with any resources. These costs will only be visible from your billing account or billing profile.

Of course, these are just a few examples. You may see more. When there simply isn't a value, you'll see something like No department, as an example, which represents Enterprise Agreement (EA) subscriptions that aren't grouped into a department.

We hope these changes help you better understand your cost and usage data. You can see this today in Cost Management Labs while in preview. Please check it out and let us know if you have any feedback. This should be available everywhere within the next few weeks.


Upcoming changes to Azure usage data

Many organizations use the full Azure usage and charges to understand what's being used, identify what charges should be internally billed to which teams, and/or to look for opportunities to optimize costs with Azure reservations and Azure Hybrid Benefit, just to name a few. If you're doing any analysis or have setup integration based on product details in the usage data, please update your logic for the following services.

The following change will start effective March 1:

Also, remember the key-based Enterprise Agreement (EA) billing APIs have been replaced by new Azure Resource Manager APIs. The key-based APIs will still work through the end of your enrollment, but will no longer be available when you renew and transition into Microsoft Customer Agreement. Please plan your migration to the latest version of the UsageDetails API to ease your transition to Microsoft Customer Agreement at your next renewal.


New videos and learning opportunities

For those visual learners out there, here are 2 new resources you should check out:

Follow the Azure Cost Management + Billing YouTube channel to stay in the loop with new videos as they're released and let us know what you'd like to see next!


Documentation updates

There were lots of documentation updates. Here are a few you might be interested in:

Want to keep an eye on all of the documentation updates? Check out the Cost Management + Billing doc change history in the azure-docs repository on GitHub. If you see something missing, select Edit at the top of the document and submit a quick pull request.

What's next?

These are just a few of the big updates from last month. We're always listening and making constant improvements based on your feedback, so please keep the feedback coming.

Follow @AzureCostMgmt on Twitter and subscribe to the YouTube channel for updates, tips, and tricks. And, as always, share your ideas and vote up others in the Cost Management feedback forum.

MLOPS for R with Azure Machine Learning

$
0
0

The video recording of my RStudio::conf talk, MLOPS for R with Azure Machine Learning, is now available for streaming thanks to the fine folks at RStudio.

Mlops-talk-scrshot

The talk begins with a general discussion of MLOps (Machine Learning Operations) and how it differs from DevOps as applied to traditional (non-ML-based) applications. This is a theme I plan to develop further in upcoming talks, but this slide provides a summary of the main differences:

Mlops-devops

The second half of the talk describes an MLOPS workflow for building a Shiny application, based on a model trained using the caret package. I used the Azure ML service and the azuremlsdk R package to coordinate the training process and provide a cluster of machines to train multiple models simultaneously and track accuracy to choose the best model to deploy. You can find the complete code behind the demonstration shown in this vignette, included with the azuremlsdk package. (If you haven't used azuremlsdk before, start with this vignette which sets up some prerequisites.)

The slides used in the talk, along with links to other resources, are also available at the link below or at aka.ms/mlops-r.

GitHub (revodavid): Resources for Machine Learning Operations with R

How to set up Docker within Windows System for Linux (WSL2) on Windows 10

$
0
0

MagicI've written about WSL2 and it's glorious wonders many times. As its release (presumably) grows closer - as of this writing it's on Windows Insiders Slow and Fast - I wanted to update a few posts. I've blogged about a few cool thing around WSL and Docker

Here's a little HanselFAQ and some resources.

I want to run Linux on Windows

You can certainly use HyperV or VirtualBox and run a standard Virtual Machine. Download an ISO and mount it and run "a square within a square." It won't be seamlessly integrated within Windows - it'll be like the movie Inception - but it's time-tested.

Better yet, install WSL or WSL2. It'll take 5-10 minutes tops if your Windows 10 is somewhat up to date.

  • How to install WSL on Windows 10
    • WSL doesn't include a Linux kernel. Its Linux file system access is kinda slow, but it accesses Windows files super fast. If you use Cygwin, you'll love this, because it's really Linux, just the kernel is emulated.
  • How to install WSL2 on Windows 10
    • WSL2 ships an actual Linux kernel and its Linux file system is 5x-10x faster than WSL. WSL2 uses a tiny utility VM that expands contracts its memory and you can manage distros with the wsl command line.
    • Do all your development work inside here, while still using VS Code on Windows. It's amazing. Watch me set up a friend with WSL2, LIVE on YouTube.

I want to SSH into Linux stuff from Windows

There's 15 years of websites telling you to install Putty but you might not need it. OpenSSH has been shipping in Windows 10 for over two years. You can add them with Windows Features, or if you like, grab a release and put it on your PATH.

You can also do things like set up keys to use Windows 10's built-in OpenSSH to automatically SSH into a remote Linux machine. I also like to setup Signed Git Commits with a YubiKey NEO and GPG and Keybase on Windows.

I need a better Terminal in Windows

The new Windows Terminal is for you. Download Windows Terminal now for free. It's open source. You can then run the Win64/Win32 ssh from above, or run any Linux distros SSH. Have fun. It's time.

NOTE: Have you already downloaded the Terminal, maybe a while back? Enough has changed that you should delete your profiles.json and start over.

You can download the Windows Terminal from the Microsoft Store or from the GitHub releases page. There's also an unofficial Chocolatey release. I recommend the Store version if possible.

My prompt and fonts are ugly

Make them pretty. You deserve the best. Go get Cascadia Code's CascadiaPL.ttf and PowerLine and buckle up buttercup. Get a nice theme and maybe a GIF background.

image_e2447ddd-416e-4036-9584-e728455e6d9d

I want to use Docker on Windows and I want it to not suck

Surprise, it's actually awesome. You may have had some challenges with Docker a few years ago on Windows and gave up, but come back. There's been a huge (and fascinating) architecture of Docker on Windows. It's very nicely integrated if you have WSL2.

If you have WSL2 set up nicely, then get Docker Desktop WSL2. This version of Docker for Windows uses WSL2 as its engine allowing you to share your docker context across Windows and Linux on the same machine! As the maker intended!

WSL 2 introduces a significant architectural change as it is a full Linux kernel built by Microsoft, allowing Linux containers to run natively without emulation. With Docker Desktop running on WSL 2, users can leverage Linux workspaces and avoid having to maintain both Linux and Windows build scripts.

So that means

  1. Install Windows 10 Insider Preview build 19018 or higher
  2. Enable WSL 2 feature on Windows. For detailed instructions, refer to the Microsoft documentation.
  3. Download Docker Desktop Edge 2.1.6.0 or a later release.

Ensure your default WSL instances is WSL2. You can do that with wsl -l -v, and then wsl --set-version  <distro> 2

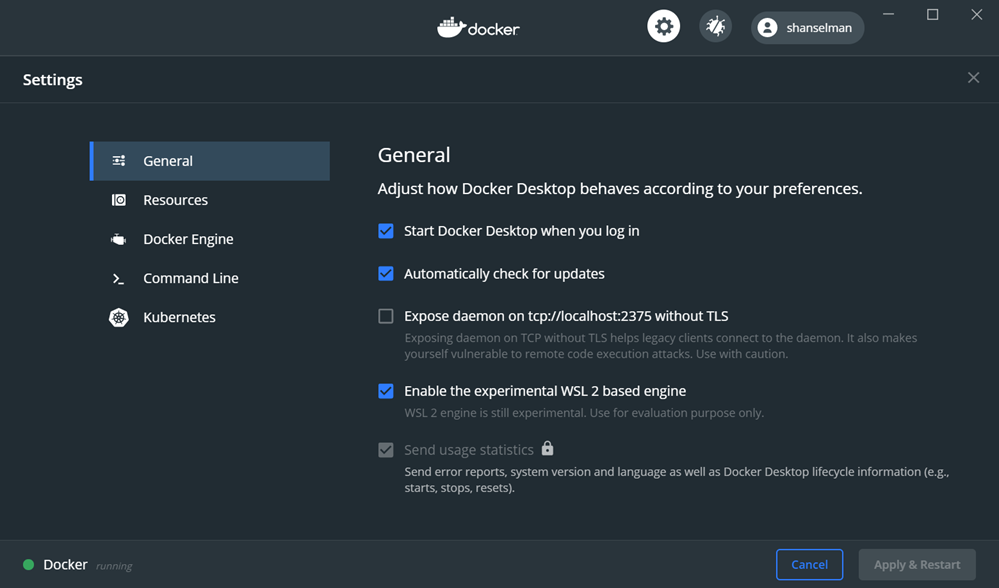
Then within Docker Desktop for Windows you've got two things to check. First, are you using WSL2 as your backend?

Docker for Windows | Enable WSL2

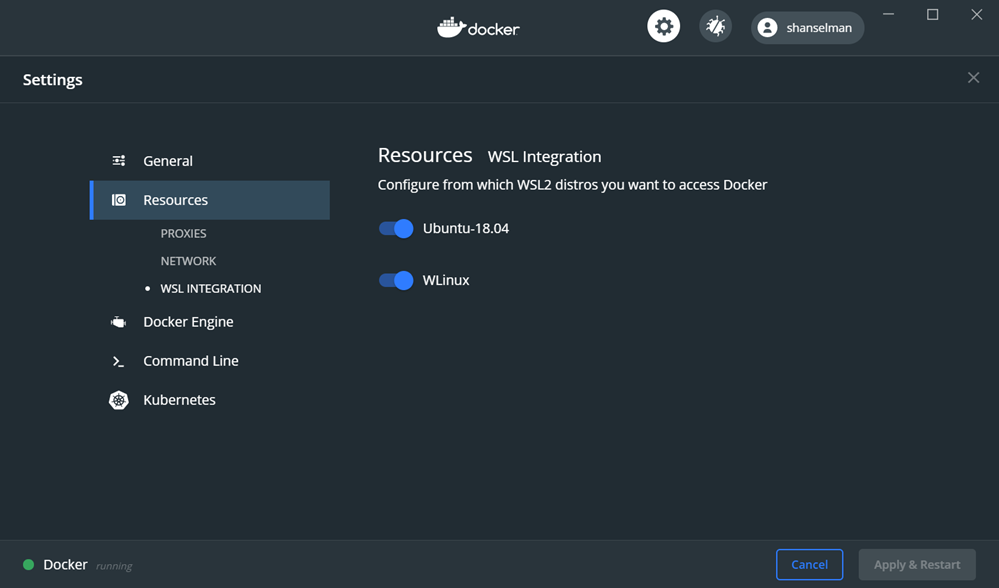
And then, the often missed setup, check under Resources | WSL Integration and tell Docker which WSL2 distros you want to use to access Docker. If you're paying attention you may notice that Docker Desktop tries to prompt you with a notification in Action Center but you might miss it.

Docker | Resources | WSL Integration

NOTE: If you used an early Tech Preview, you might have an extra now-vestigial Docker context named "wsl." You want to use the Default one, not the WSL one.

This isn't intuitive or obvious and you might get weird errors like these

docker wsl open //./pipe/docker_wsl: The system cannot find the file specified.

or

error during connect: Get http://%2F%2F.%2Fpipe%2Fdocker_wsl/v1.40/images/json?all=1: open //./pipe/docker_wsl: The system cannot find the file specified.

You can see if you have an extra context from before like below. That "wsl" one is older (if you have it) and you want to use default in both Windows and WSL2.

docker context ls

NAME DESCRIPTION DOCKER ENDPOINT KUBERNETES ENDPOINT
default * Current DOCKER_HOST based configuration npipe:////./pipe/docker_engine https://kubernetes.docker
wsl Docker daemon hosted in WSL 2 npipe:////./pipe/docker_wsl

I actually removed that one to avoid confusion with docker context rm wsl.

Here's Ubuntu on my Windows machine

Docker in Ubuntu

And here's my Windows machine. Note that docker images in both instances returns the same list. They are the same Docker backend!

Docker on Windows

I want to code in VS Code on Windows but compile on Linux

At this point once I've set things up I can go bananas. I can do Container-based development, where I use VS Code to run all my developer tools and builds insider a container...maybe I never event install Go or PHP or .NET Core. It's all just inside a container.

Oh, by the way, please Subscribe to my YouTube! I talk a lot about this stuff over there.


Sponsor: Couchbase gives developers the power of SQL with the flexibility of JSON. Start using it today for free with technologies including Kubernetes, Java, .NET, JavaScript, Go, and Python.


© 2019 Scott Hanselman. All rights reserved.
     

Accelerate Your cloud strategy with Skytap on Azure

$
0
0

Azure is the best cloud for existing Microsoft workloads, and we want to ensure all of our customers can take full advantage of Azure services. We work hard to understand the needs of those customers running Microsoft workloads on premises, including Windows Server, and help them to navigate a path to the cloud. But not all customers can take advantage of Azure services due to the diversity of their on-premises platforms, the complexity of their environments, and the mission-critical applications running in those environments.

Microsoft works with many partners to create strategic partnerships to unlock the power of the cloud for customers relying on traditional on-premises application platforms. Azure currently offers several specialized application platforms and experiences, including Cray, SAP, and NetApp, and we continue to invest in additional options and platforms.

Allowing businesses to innovate with the cloud faster

Today we're pleased to share that we are enabling more customers to start on their journey to the cloud. Skytap has announced the availability of Skytap on Azure. The Skytap on Azure service simplifies cloud migration for traditional applications running on IBM Power while minimizing disruption to the business. Skytap has more than a decade of experience working with customers and offering extensible application environments that are compatible with on-premises data centers; Skytap’s environments simplify migration and provide self-service access to develop, deploy, and accelerate innovation for complex applications.

Brad Schick, Skytap CEO: “Today, we are thrilled to make the service generally available.  Enterprises and ISVs can now move their traditional applications from aging data centers and use all the benefits of Azure to innovate faster.”

Customers can learn more about Skytap and the Skytap on Azure service here.

Cloud migration remains a crucial component for any organization in the transformation of their business, and Microsoft continues to focus on how best to support customers in that journey. We often hear about the importance of enabling the easy movement of existing applications running on traditional on-premises platforms to the cloud and the desire to have those platforms be available on Azure.

The migration of applications running on IBM Power to the cloud is often seen as a difficult and challenging move involving re-platforming. For many businesses, these environments are running traditional, and frequently, mission-critical applications. The idea of re-architecting or re-platforming these applications to be cloud native can be daunting. With Skytap on Azure, customers gain the ability to run native Power workloads, including AIX, IBM i, and Linux on Azure. The Skytap service allows customers to unlock the benefits of the cloud faster and begin innovating across applications sooner, by providing the ability to take advantage of and integrate with the breadth of Azure native services. All of this is possible with minimal changes to the way existing IBM Power applications are managed on-premises.

This montage of terminal screen shots shows IBM i, AIX, and Linux on Power running in Skytap on Azure.

Application running on IBM Power and x86 in Skytap on Azure.

With Skytap on Azure, Microsoft brings the unique capabilities of IBM Power9 servers to Azure data centers, directly integrating with Azure network, and enabling Skytap to provide their platform with minimal connectivity latency to Azure native services such as Blob Storage, Azure NetApp Files, or Azure Virtual Machines.

Skytap on Azure is now available in the East US Azure region. Given the high level of interest we have seen already, we intend to expand availability to additional regions across Europe, the United States, and Asia Pacific. Stay tuned for more details on specific regional rollout availability.

Try Skytap on Azure today, available through the Azure Marketplace. For more information on the Public Availability of Skytap on Azure, please access the full Skytap press release. Skytap on Azure is a Skytap first-party service delivered on Microsoft Azure’s global cloud infrastructure.

Azure HBv2 Virtual Machines eclipse 80,000 cores for MPI HPC

$
0
0

HPC-optimized virtual machines now available

Azure HBv2-series Virtual Machines (VMs) are now generally available in the South Central US region. HBv2 VMs will also be available in West Europe, East US, West US 2, North Central US, Japan East soon.

HBv2 VMs deliver supercomputer-class performance, message passing interface (MPI) scalability, and cost efficiency for a variety of real-world high performance computing (HPC) workloads, such as CFD, explicit finite element analysis, seismic processing, reservoir modeling, rendering, and weather simulation.

Azure HBv2 VMs are the first in the public cloud to feature 200 gigabit per second HDR InfiniBand from Mellanox. HDR InfiniBand on Azure delivers latencies as low as 1.5 microseconds, more than 200 million messages per second per VM, and advanced in-network computing engines like hardware offload of MPI collectives and adaptive routing for higher performance on the largest scaling HPC workloads. HBv2 VMs use standard Mellanox OFED drivers that support all RDMA verbs and MPI variants.

Each HBv2 VM features 120 AMD EPYC™ 7002-series CPU cores with clock frequencies up to 3.3 GHz, 480 GB of RAM, 480 MB of L3 cache, and no simultaneous multithreading (SMT). HBv2 VMs provide up to 340 GB/sec of memory bandwidth, which is 45-50 percent more than comparable x86 alternatives and three times faster than what most HPC customers have in their datacenters today. A HBv2 virtual machine is capable of up to 4 double-precision teraFLOPS, and up to 8 single-precision teraFLOPS.

One and three year Reserved Instance, Pay-As-You-Go, and Spot Pricing for HBv2 VMs is available now for both Linux and Windows deployments. For information about five-year Reserved Instances, contact your Azure representative.

Disruptive speed for critical weather forecasting

Numerical Weather Prediction (NWP) and simulation has long been one of the most beneficial use cases for HPC. Using NWP techniques, scientists can better understand and predict the behavior of our atmosphere, which in turn drives advances in everything from coordinating airline traffic, shipping of goods around the globe, ensuring business continuity, and critical disaster preparedness from the most adverse weather. Microsoft recognizes the criticality of this field is to science and society, which is why Azure shares US hourly weather forecast data produced by the Global Forecast System (GFS) from the National Oceanic and Atmospheric Administration (NOAA) as part of the Azure Open Datasets initiative.

Cormac Garvey, a member of the HPC Azure Global team, has extensive experience supporting weather simulation teams on the world’s most powerful supercomputers. Today, he’s published a guide to running the widely-used Weather Research and Forecasting (WRF) Version 4 simulation suite on HBv2 VMs.

Cormac used a 371M grid point simulation of Hurricane Maria, a Category 5 storm that struck the Caribbean in 2017, with a resolution of 1 kilometer. This model was chosen not only as a rigorous benchmark of HBv2 VMs but also because the fast and accurate simulation of dangerous storms is one of the most vital functions of the meteorology community.

WRF v4.1.3 on Azure HBv2 benchmark results

Figure 1: WRF Speedup from 1 to 672 Azure HBv2 VMs.

Nodes

(VMs)

Parallel

Processes

Average Time(s)

per Time Step

Scaling

Efficiency

Speedup

(VM-based)

1

120

18.51

100 percent

1.00

2

240

8.9

104 percent

2.08

4

480

4.37

106 percent

4.24

8

960

2.21

105 percent

8.38

16

1,920

1.16

100 percent

15.96

32

3,840

0.58

100 percent

31.91

64

7,680

0.31

93 percent

59.71

128

15,360

0.131

110 percent

141.30

256

23,040

0.082

88 percent

225.73

512

46,080

0.0456

79 percent

405.92

640

57,600

0.0393

74 percent

470.99

672

80,640

0.0384

72 percent

482.03

Figure 2: Scaling and configuration data for WRF on Azure HBv2 VMs.

Note: for some scaling points, optimal performance is achieved with 30 MPI ranks and 4 threads per rank, while in others 90 MPI ranks was optimal. All tests were run with OpenMPI 4.0.2.

Azure HBv2 VMs executed the “Maria” simulation with mostly super-linear scalability up to 128 VMs (15,360 parallel processes). Improvements from scaling continue up to the largest scale of 672 VMs (80,640 parallel processes) tested in this exercise, where a 482x speedup over a single VM. At 512 nodes (VMs) we observe a ~2.2x performance increase as compared to a leading supercomputer that debuted among the top 20 fastest machines in 2016.

The gating factor to higher levels of scaling efficiency? The 371M grid point model, even as one of the largest known WRF models, is too small at such extreme levels of parallel processing. This opens the door for leading weather forecasting organizations to leverage Azure to build and operationalize even higher resolution models that higher numerical accuracy and a more realistic understanding of these complex weather phenomena.

Visit Cormac’s blog post on the Azure Tech Community to learn how to run WRF on our family of H-series Virtual Machines, including HBv2.

Better, safer product design from hyper-realistic CFD

Computational fluid dynamics (CFD) is core to the simulation-driven businesses of many Azure customers. A common request from customers is to “10x” their capabilities while keeping costs as close to constant as possible. Specifically, customers often seek ways to significantly increase the accuracy of their models by simulating it in higher resolution. Given that many customers already solve CFD problems with ~500-1000 parallel processes per job, this is a tall task that implies linear scaling to at least 5,000-10,000 parallel processes. Last year, Azure accomplished one of these objectives when it became the first public cloud to scale a CFD application to more than 10,000 parallel processes. With the launch of HBv2 VMs, Azure’s CFD capabilities are increasing again.

Jon Shelley, also a member of the Azure Global HPC team, worked with Siemens to validate one its largest CFD simulations ever, a 1 billion cell model of a sports car named after the famed 24 Hours of Le Mans race with a 10x higher-resolution mesh than what Azure tested just last year. Jon has published a guide to running Simcenter STAR-CCM+ at large scale on HBv2 VMs.

Siemens Simcenter Star-CCM+ 14.06 benchmark results

Figure 3: Simcenter STAR-CCM+ Scaling Efficiency from 1 to 640 Azure HBv2 VMs

Nodes

(VMs)

Parallel

Processes

Solver Elapsed Time

Scaling Efficiency

Speedup

(VM-based)

8

928

337.71

100 percent

1.00

16

1,856

164.79

102.5 percent

2.05

32

3,712

82.07

102.9 percent

4.11

64

7,424

41.02

102.9 percent

8.23

128

14,848

20.94

100.8 percent

16.13

256

29,696

12.02

87.8 percent

28.10

320

37,120

9.57

88.2 percent

35.29

384

44,544

7.117

98.9 percent

47.45

512

59,392

6.417

82.2 percent

52.63

640

57,600

5.03

83.9 percent

67.14

Figure 4: Scaling and configuration data for STAR-CCM+ on Azure HBv2 VMs

Note: A given scaling point may achieve optimal performance with 90, 112, 116, or 120 parallel processes per VM. Plotted data below shows optimal performance figures. All tests were run with HPC-X MPI ver. 2.50.

Once again, Azure HBv2 executed the challenging problem with linear efficiency to more than 15,000 parallel processes across 128 VMs. From there, high scaling efficiency continued, peaking at nearly 99 percent at more than 44,000 parallel processes. At the largest scale of 640 VMs and 57,600 parallel processes, HBv2 delivered 84 percent scaling efficiency. This is among the largest scaling CFD simulations with Simcenter STAR-CCM+ ever performed, and now can be replicated by Azure customers.

Visit Jon’s blog post on the Azure Tech Community site to learn how to run Simcenter STAR-CCM+ on our family of H-series Virtual Machines, including HBv2.

Extreme HPC I/O meets cost-efficiency

An increasing scenario on the cloud is on-demand HPC-grade parallel filesystems. The rationale is straight forward; if a customer needs to perform a large quantity of compute, that customer often needs to also move a lot of data into and out of those compute resources. The catch? Simple cost comparisons against traditional on-premises HPC filesystem appliances can be unfavorable, depending on circumstances. With Azure HBv2 VMs, however, NVMeDirect technology can be combined with ultra low-latency RDMA capabilities to deliver on-demand “burst buffer” parallel filesystems at no additional cost beyond the HBv2 VMs already provisioned for compute purposes.

BeeGFS is one such filesystem and has a rapidly growing user base among both entry-level and extreme-scale users. The BeeOND filesystem is even used in production on the novel HPC + AI hybrid supercomputer “Tsubame 3.0.”

Here is a high-level summary of how a sample BeeOND filesystem looks when created across 352 HBv2 VMs, providing 308 terabytes of usable, high-performance namespace.

Overview of example BeeOND filesystem on HBv2 VMs

Figure 5: Overview of example BeeOND filesystem on HBv2 VMs.

Running the widely-used IOR test of parallel filesystems across 352 HBv2 VMs, BeeOND achieved peak read performance of 763 gigabytes per second, and peak write performance of 352 gigabytes per second.

Visit Cormac’s blog post on the Azure Tech Community to learn how to run BeeGFS on RDMA-powered Azure Virtual Machines.

10x-ing the cloud HPC experience

Microsoft Azure is committed to delivering to our customers a world-class HPC experience, and maximum levels of performance, price/performance, and scalability.

“The 2nd Gen AMD EPYC processors provide fantastic core scaling, access to massive memory bandwidth and are the first x86 server processors that support PCIe 4.0; all of these features enable some of the best high-performance computing experiences for the industry,” said Ram Peddibhotla, corporate vice president, Data Center Product Management, AMD. “What Azure has done for HPC in the cloud is amazing; demonstrating that HBv2 VMs and 2nd Gen EPYC processors can deliver supercomputer-class performance, MPI scalability, and cost efficiency for a variety of real-world HPC workloads, while democratizing access to HPC that will help drive the advancement of science and research.”

"200 gigabit HDR InfiniBand delivers high data throughout, extremely low latency, and smart In-Network Computing engines, enabling high performance and scalability for compute and data applications. We are excited to collaborate with Microsoft to bring the InfiniBand advantages into Azure, providing users with leading HPC cloud services” said Gilad Shainer, Senior Vice President of Marketing at Mellanox Technologies. “By taking advantage of InfiniBand RDMA and its MPI acceleration engines, Azure delivers higher performance compared to other cloud options based on Ethernet. We look forward to continuing to work with Microsoft to introduce future generations and capabilities."

ExpressRoute Global Reach: Building your own cloud-based global backbone

$
0
0

Connectivity has gone through a fundamental shift as more workloads and services have moved to the Cloud. Traditional enterprise Wide Area Networks (WAN) have been fixed in nature, without the ability to dynamically scale to meet modern customer demands. For customers seeking to increasingly apply a cloud-first approach as the basis for their app and networking strategy, hybrid cloud enables applications and services to be deployed cross-premises as a fully connected and seamless architecture. The connectivity across premises is moving to utilize a more cloud-first model, with services offered by global hyper-scale networks.

Microsoft global network

Microsoft operates one of the  largest networks on the globe  spanning over 130,000 miles of terrestrial and subsea fiber cable systems across 6 continents. Besides Azure, the global network powers all our cloud services, including Bing, Office 365 and Xbox. The network carries more than 30 billion packets per second at any one time and is accessible for peering, private connectivity and application content delivery through our more than 160 global network PoPs. Microsoft continuously add new network PoPs to optimize the experience for our customers accessing Microsoft services.

Microsoft's Global network map

The global network is built and operated using intelligent software-defined traffic engineering technologies, that allow Microsoft to dynamically select optimal paths and route around network faults and congestion scenarios in near real-time. The network has multiple redundant paths to ensure maximum uptime and reliability when powering mission-critical workloads for our customers.

Microsoft's Point of Presence (PoP) with connectivity services

ExpressRoute overview

Azure ExpressRoute provides enterprises with a service that bypasses the Internet to securely and privately connect to Azure and to create their own global network. A common scenario is for enterprises to use ExpressRoute to access their Azure virtual networks (VNets) containing their own private IP addresses. This allows Azure to become a seamless hybrid extension of their on-premises networks. Another scenario includes using ExpressRoute to access public services over a private connection such as Azure Storage or Azure SQL. Traffic for ExpressRoute enters the Microsoft network at our networking Points of Presence (or PoPs) strategically distributed across the world, which are hosted in carrier-neutral facilities to provide customers options when picking a carrier or Telco partner.

ExpressRoute provides three different SKUs of ExpressRoute circuits:

  • ExpressRoute Local: Available at ExpressRoute sites physically close to an Azure region and can be used only to access the local Azure region. Because the traffic stays in the regional network and does not traverse the global network, the ExpressRoute Local traffic has no egress charge.
  • ExpressRoute Standard: Provides connectivity to any Azure region with in the same geopolitical region as the ExpressRoute site from London to West Europe, for example.
  • ExpressRoute Premium: Provides connectivity to any Azure region within the cloud environment. For example, an ExpressRoute Premium circuit at the New Zealand site can access Azure regions in Australia or other geographies from Europe or North America.

In addition to using the more than 200 ExpressRoute partners to connect for ExpressRoute, enterprises can directly connect to ExpressRoute routers with the ExpressRoute Direct option, at either 10G or 100G physical interfaces. Within ExpressRoute Direct, enterprises can divide up this physical port into multiple ExpressRoute circuits to serve different business units and use cases.

Many customers want to take further advantage of their existing architecture and ExpressRoute connections to provide connectivity between their on-premises sites or data centers. Enabling site-to-site connectivity across our global network is now very easy. When Azure introduced ExpressRoute Global Reach, as the first in public cloud, we provided a sleek and simple way to take full advantage of our global backbone assets. 

ExpressRoute Global Reach

With ExpressRoute Global Reach, we are democratizing connectivity, allowing enterprises to build cloud based virtual global backbones by using ExpressRoute and Microsoft’s global network. ExpressRoute Global Reach enables connectivity from on-premises to on-premises fully routed privately within the Microsoft global backbone. This capability can be a backup to existing network infrastructure, or it can be the primary means to serve enterprise Wide Area Network (WAN) needs. Microsoft takes care of redundancy, the larger global infrastructure investments, and the scale out requirements, allowing customers to focus on their core mission. 

ExpressRoute Global Reach Map

Consider Contoso, a multi-national company headquartered in Dallas, Texas with global offices in London and Tokyo. These three main locations also serve as major connectivity hubs for branch offices and on-premises datacenters. Utilizing a local last-mile carrier, Contoso invests in redundant paths to meet at the ExpressRoute sites in these same locations. After establishing the physical connectivity, Contoso stands up their ExpressRoute connectivity through a local provider or via ExpressRoute Direct and starts advertising routes via the industry standard, Border Gateway Protocol (BGP). Contoso can now connect all these sites together and opt to enable Global Reach, which will take the on-premises routes and advertise them to the peered circuit in the remote locations, enabling cross-premises connectivity. Contoso has now created a cloud-based Wide Area Network and all within minutes. Effectively end-to-end global connectivity without long-haul investments and fixed contracts.

Modernizing the network and applying the cloud-first model help customers scale with their needs, while at the same time take full advantage and build onto their existing cloud infrastructure. As on-premises sites and branches emerge or change, global connectivity should be as easy as a click of a button. ExpressRoute Global Reach enables companies to provide best in class connectivity on one of the most comprehensive software-defined networks on the planet.

ExpressRoute Global Reach is generally available in these locations, including Azure US Government.

Protecting users from potentially unwanted applications in Microsoft Edge

$
0
0

Our customer feedback tells us that when users search for free versions of software, they often find applications with a poor reputation being installed on the machine at the same time. This pattern indicates that the user has downloaded an application which shows offers (or bundles) for potentially unwanted applications (PUA).

Potentially unwanted applications can make the user less productive, make the user’s machine less performant, and lead to a degraded Windows experience. Examples of PUA include software that creates extra advertisements, applications that mine cryptocurrency, applications that show offers for other software and applications that the AV industry considers having a poor reputation.

In the new Microsoft Edge (beginning with 80.0.338.0), we’ve introduced a new feature to prevent downloads that may contain potentially unwanted apps (PUA), by blocking those apps from downloading. This feature is off by default, but can be turned on in three easy steps:

  1. Tap (Settings and more) > Settings.
  2. Choose Privacy and services.
  3. Scroll down to Services, and then turn on Block potentially unwanted apps.
Screenshot highlighting the Block potentially unwanted apps setting

Here is what users will see when a download is blocked by the feature (Note: PUA blocking requires Microsoft Defender SmartScreen to be enabled):

Screenshot showing a download banner, with the text: freevideo.exe has been blocked as a potentially unwanted app, and an option to Delete or click for more options.

To learn more about what Microsoft defines as PUA, see the criteria in our documentation.

If an app has been mislabeled as PUA, users can choose to keep it by tapping in the bottom bar, choosing Keep, and then choosing Keep anyway in the dialog that appears.

Screenshot showing a dialog warning the an app is a potentially unwanted app.

From edge://downloads/, users can also choose Report this app as reputable, which will direct them to our feedback site. There, users can let us know that they think the app is mistakenly marked as PUA.

If you own the site or app in question, you can let us know here. Your feedback will be reviewed by our team to determine an appropriate follow up action.

Screenshot highlighting the option to Report the app as reputable in Downloads

Our goal is to assist users in getting the apps they want, while empowering them to maintain control over their devices and experiences.

You can learn more about how Microsoft identifies malware, unwanted software, and PUA in our security documentation.

We encourage users to always try to download software from a trusted location, such as the publisher’s website or a reputable app store, and to check reviews of the app and the reputation of the publisher before downloading.

If you are an admin or IT professional and are interested in enabling this feature on for your users, see our enterprise documentation here.

We hope you’ll try out this new feature in the new Microsoft Edge and let us know what you think! Give us your feedback by clicking the feedback link in the upper right corner of your browser or pressing Alt-Shift-I to send feedback.

– Juli Hooper and Michael Johnson, Microsoft Defender ATP

The post Protecting users from potentially unwanted applications in Microsoft Edge appeared first on Microsoft Edge Blog.


Improve collaboration across apps and customize experiences—here’s what’s new to Microsoft 365 in February

Welcome to Babylon.js 4.1

$
0
0

Our mission is to create one of the most powerful, beautiful, and simple Web rendering engines in the world. Our passion is to make it completely open and free for everyone.

Today, we are thrilled to announce the official release of Babylon.js 4.1! Before diving into more detail, we also want to humbly thank the awesome community of 250+ contributors for their efforts to help build this framework.

Up to 3 times smaller and 12% faster, Babylon.js 4.1 includes countless performance optimizations, continuing our lineage of a high-performance engine. With the new Node Material Editor, a truly cross-platform development experience with Babylon Native, Cascaded Shadows, Navigation Mesh, updated WebXR and glTF support, and much more, Babylon.js 4.1 brings even more power to your web development toolbox.

Node Material Editor

Screenshot of Node Material Editor.

Introducing the powerful and simple Node Material Editor. This new user-friendly node-based system unlocks the power of the GPU for everyone. Traditionally, writing shaders (GPU programs) hasn’t been very easy or accessible for anyone without the understanding of low-level code. Babylon’s new node material system removes the complexity without sacrificing power. With this new system, absolutely anyone can create beautiful shader networks by simply connecting nodes together.

Gif of underwater sea floor.

To see the Node Material in action, we put together a couple of demos for you. The Under Water Demo and accompanying Mystery Demo Tutorial Videos showcase how the Node Material makes writing complex vertex shaders easier. The Fantasy Weapons Demo shows off some truly amazing lighting effects shaders. If you just can’t wait to try out the Node Material Editor yourself, head on over here.

Babylon Native Preview

Babylon Native Preview

The holy grail of software development is to write code once and have it work everywhere: on any device, on every platform. This is the inspiration behind Babylon Native. This exciting new addition to the Babylon platform allows anyone to take their Babylon.js code and build a native application with it, unlocking the power of native technologies. You can learn more about it here.

Screen Space Reflections

Example of Real-time screen space reflections.

Real-time screen space reflections are here! With this amazing effort from the dedicated Julien Moreau Mathis, you can now add an entirely new level of realism, depth, and intrigue to all of your Babylon experiences. Simple to use and beautiful, this feature is truly a “must try!” Check out a live demo here.

Cascaded Shadows

Example of Cascaded Shadow Maps.

Babylon.js 4.1 brings one of the most community requested features to the engine: Cascaded Shadow Maps! This exciting new feature helps distribute the resolution of shadows making shadows look crisp, smooth, and beautiful. Best of all, it was created by one of our very own community members: Popov72. Check out a demo here.

Thin Engine for 2D experiences

2D depiction of a welder.

The power of the core Babylon.js engine is now available in a stripped-down version that we are calling the “Thin Engine.” 

Babylon’s scene graph and all other tools and features rely on an engine which functions as the central hub of the technology. The size of this central engine is critically important to anyone thinking about using Babylon.js at mass scale for 2D experiences. The Thin Engine removes features in exchange for raw power in a tiny package size. Stripping the core engine down to its bare frame, we created a version specifically for accelerating 2D experiences with the smallest possible package size (~100KB unpacked).

Navigation Mesh and Crowd Agents

Screenshot of underwater demo.

With the new fun and simple Navigation Mesh system, leveraging the power of the excellent and open source Recast navigation library, it’s easier than ever to create convincing “AI” for your game or interactive experience. Simply provide a crowd agent with a navigation mesh, and the movement of that agent will be confined to the mesh. As seen with the fish in this Underwater Demo, you’ll find it very useful for AI and path finding or to replace physics for collision detection (only allow player to go where it’s possible instead of using collision detection). More info here.

Updated WebXR Support

Screenshot of WebXR support.

It’s no secret that the future is bright for AR/VR experiences on the web. Babylon 4.1 further advances the engine’s best-in-class WebXR support by bringing: 

  • An easy to use experience helper
  • A dedicated session manager for more advanced users
  • One camera to rule them all
  • Full support for any device that accepts WebXR sessions
  • Full input-source support
  • API for Experimental AR features
  • Teleportation, scene interactions, physics, and more

You can find more details on our introduction to WebXR.

Much, Much More

Of course, that’s all just the tip of the iceberg. There’s so much more packed into this release that it’s nearly too much to mention…nearly…

  • Render the same scene from 2 different canvases with MultiView
  • Render UI elements in a second worker thread with Offscreen Canvas
  • Render thousands of objects with variance through Instance Buffers
  • Speed up common web controls with powerful new 2D Controls
  • Reduced 3D file sizes through experimental KTX2+BasisU support
  • Experimental support for upcoming glTF extensions: KHR_texture_basisu, KHR_mesh_instancing, KHR_mesh_quantization, KHR_materials_clearcoat, KHR_materials_sheen, KHR_materials_specular

For a full list of new features, updates, performance improvements, and bug fixes, head on over here.

Babylon.js 4.1 marks another major step forward towards creating one of the most powerful, beautiful, simple, and open rendering engine in the world. We can’t wait to see what you make with it.

www.babylonjs.com

The post Welcome to Babylon.js 4.1 appeared first on Windows Developer Blog.

New Cortana experience coming to Windows 10 helps you achieve more with less effort

.NET Framework February 2020 Preview of Quality Rollup

$
0
0

Today, we are releasing the February 2020 Preview of Quality Rollup Updates for .NET Framework.

Quality and Reliability

This release contains the following quality and reliability improvements.

CLR1

  • Addresses an issue with rare crashes or deadlocks that could occur if a GC occurs while another thread is running NGen’ed code which makes the initial call into a static method within the same module where one or more parameter types involve type-forwarded value types.
  • Addresses rare crashes that could occur if Server GC is enabled and a GC occurs while another thread is running NGen’ed code which is making the initial call into NGen’ed code in a 2nd module where one or more parameter types involve valuetypes defined in a 3rd module.
  • The PAUSE instruction latency increased dramatically on the Intel Skylake processor (documented in “Section 2.2.4 Pause Latency in Skylake Microarchitecture” of the Intel 64 and IA-32 Architectures Optimization Reference Manual). As such places in the runtime that call YieldProcessor (which translates to this instruction) in a loop needed to adjust the number of iterations to call it. GC now takes a scale factor (provided by testing how long the instruction takes and scaling it down) and uses that to adjust the number of iterations so the total time approximates what happened on previous processors. A common symptom is in Server GC where GC spends a much larger percentage in CPU time inclr!SVR::t_join::join and with this change you should see the time go down to the previous percentage.
  • Addresses an issue with a crash that could occur in some configurations involving either hot-added CPUs or multi-group machines where per-group CPU count is not consistent across all groups.
  • Addresses an issue with a rare crash that can occur during the first call that native code makes into the managed portion of a mixed-mode DLL.

WCF2

  • Addresses an issue when using the WCFNetTcp binding. If a client stops responding during the connection handshake, sometimes a service will use the binding receive timeout instead of the open timeout. This update ensures that the correct open timeout is used during the entire handshake.

Workflow

  • Addresses an accessibility issue where text inside a Windows Workflow Foundation Visual Basic Editor would use the wrong colors in high contrast themes.

Winforms

  • Addresses an issue with interaction between WPF user control and hosting WinForms app when processing keyboard input.
  • Addresses an issue getting accessible objects for PropertyGridView ComboBox property items – adding the verification for item existence and validity.
  • Addresses an issue with WinForms ComboBox control reinitialization in AD FS MMC UI.

1 Common Language Runtime (CLR)
2 Windows Communication Foundation (WCF)

Getting the Update

The Preview of Quality Rollup is available via Windows Update, Windows Server Update Services, and Microsoft Update Catalog.

Microsoft Update Catalog

You can get the update via the Microsoft Update Catalog. For Windows 10, NET Framework 4.8 updates are available via Windows Update, Windows Server Update Services, Microsoft Update Catalog. Updates for other versions of .NET Framework are part of the Windows 10 Monthly Cumulative Update.

Note: Customers that rely on Windows Update and Windows Server Update Services will automatically receive the .NET Framework version-specific updates. Advanced system administrators can also take use of the below direct Microsoft Update Catalog download links to .NET Framework-specific updates. Before applying these updates, please ensure that you carefully review the .NET Framework version applicability, to ensure that you only install updates on systems where they apply.

The following table is for Windows 10 and Windows Server 2016+ versions.

Product Version Cumulative Update
Windows 10 1809 (October 2018 Update) and Windows Server 2019 4538156
.NET Framework 3.5, 4.7.2 Catalog 4537490
.NET Framework 3.5, 4.8 Catalog 4537480
Windows 10 1803 (April 2018 Update)
.NET Framework 3.5, 4.7.2 Catalog 4537795
.NET Framework 4.8 Catalog 4537479
Windows 10 1709 (Fall Creators Update)
.NET Framework 3.5, 4.7.1, 4.7.2 Catalog 4537816
.NET Framework 4.8 Catalog 4537478
Windows 10 1607 (Anniversary Update) and Windows Server 2016
.NET Framework 3.5, 4.6.2, 4.7, 4.7.1, 4.7.2 Catalog 4537806
.NET Framework 4.8 Catalog 4537477

The following table is for earlier Windows and Windows Server versions.

Product Version Preview of Quality Rollup
Windows 8.1, Windows RT 8.1 and Windows Server 2012 R2 4538158
.NET Framework 3.5 Catalog 4537503
.NET Framework 4.5.2 Catalog 4537491
.NET Framework 4.6, 4.6.1, 4.6.2, 4.7, 4.7.1, 4.7.2 Catalog 4537488
.NET Framework 4.8 Catalog 4537482
Windows Server 2012 4538157
.NET Framework 3.5 Catalog 4537500
.NET Framework 4.5.2 Catalog 4537492
.NET Framework 4.6, 4.6.1, 4.6.2, 4.7, 4.7.1, 4.7.2 Catalog 4537487
.NET Framework 4.8 Catalog 4537481

Previous Monthly Rollups

The last few .NET Framework Monthly updates are listed below for your convenience:
* February 2020 Security and Quality Rollup
* January 2020 Preview of Quality Rollup
* January 2020 Security and Quality Rollup
* December 2019 Security and Quality Rollup

The post .NET Framework February 2020 Preview of Quality Rollup appeared first on .NET Blog.

ASP.NET Core Apps Observability

$
0
0

Thank you Sergey Kanzhelev for the support and review of this ASP.NET Core Apps Observability article.

Modern software development practices value quick and continuous updates, following processes that minimize the impact of software failures. As important as identifying bugs early, finding out if changes are improving business value are equally important. These practices can only work when a monitoring solution is in place. This article explores options for adding observability to .NET Core apps. They have been collected based on interactions with customers using .NET Core in different environments. We will be looking into OpenTelemetry and Application Insights SDKs to add observability to a sample distributed application.

Observability Basics

Identifying software error and business impact require a monitoring solution with the ability to observe and report how the system and users behave. The collected data must provide the required information to analyze and identify a bad update. Answering questions such as:

  • Are we observing more errors than before?
  • Were there new error types?
  • Did the request duration unexpectedly increase compared to previous versions?
  • Has the throughput (req/sec) decreased?
  • Has the CPU and/or Memory usage increased?
  • Were there changes in our KPIs?
  • Is it selling less than before?
  • Did our visitor count decrease?

The impact of a bad system update can be minimized by combining the monitoring information with progressive deployment strategies. Such as canary, mirroring, rings, blue/green, etc.

Observability is Built on 3 Pillars:

  • Logging: collects information about events happening in the system. Helping the team analyze unexpected application behavior. Searching through the logs of suspect services can provide the necessary hint to identify the problem root cause. Such as: service throwing out of memory exceptions and app configuration not reflecting expected values. As well as calls to external service with incorrect address, calls to external service returns with unexpected results, and incoming requests with unexpected input.

  • Tracing: collects information to create an end-to-end view of how transactions are executed in a distributed system. A trace is like a stack trace spanning multiple applications. Once a problem has been recognized, traces are a good starting point in identifying the source in distributed operations. Like calls from service A to B are taking longer than normal, service payment calls are failing, etc.

  • Metrics: provide a real-time indication of how the system is running. It can be leveraged to build alerts, allowing proactive reactance to unexpected values. As opposed to logs and traces, the amount of data collected using metrics remains constant as the system load increases. Application problems are often first detected through abnormal metric values. Such as CPU usage being higher than before, payment error count spiking, and queued item count keeps growing.

Adding Observability to a .NET Core Application

There are many ways to add observability aspects to an application. Dapr for example, is a runtime to build distributed applications, transparently adding distribute tracing. Another example is through the usage of service meshes in Kubernetes (Istio, Linkerd).

Built-in and transparent tracing are typically covering basic scenarios and answering generic questions, such as observed request duration or CPU trends. Other questions, such as custom KPIs or user behavior, require adding instrumentation to your code.

To illustrate how observability can be added to a .NET Core application we will be using the following asynchronous distributed transaction example:


Sample Observability Application Overview
  1. Main Api receives a request from a “source”.
  2. Main Api enriches the request body with current day, obtained from Time Api.
  3. Main Api enqueues enriched request to a RabbitMQ queue for asynchronous processing.
  4. RabbitMQProcessor dequeues request.
  5. RabbitMQProcessor, as part of the request processing, calls Time Api to get dbtime.
  6. Time Api calls SQL Server to get current time.

To run the sample application locally (including dependencies and observability tools), follow this guide. The article will walkthrough adding each observability pillar (logging, tracing, metrics) into the sample asynchronous distributed transaction.

Note: for information on bootstrapping OpenTelemetry or Application Insights SDK please refer to the documentation: OpenTelemetry and Application Insights.

Logging

Logging was redesigned in .NET Core, bringing an integrated and extensible API. Built-in and external logging providers allow the collection of logs in multiple formats and targets. When deciding a logging platform, consider the following features:

  • Centralized: allowing the collection/storage of all system logs in a central location.
  • Structured logging: allows you to add searchable metadata to logs.
  • Searchable: allows searching by multiple criteria (app version, date, category, level, text, metadata, etc.)
  • Configurable: allows changing verbosity without code changes (based on log level and/or scope).
  • Integrated: integrated into tracing, facilitating analysis of traces and logs in the same tool.

The sample application uses the ILogger interface for logging. The snippet below demonstrates an example of structure logging. Which captures events using message template and generates information that is human and machine readable.

var result = await repository.GetTimeFromSqlAsync();
logger.LogInformation("{operation} result is {result}", nameof(repository.GetTimeFromSqlAsync), result);

When using a logging backend that understands structured logs, such as Application Insights, search instances of the example log items where “operation” is equal to “GetTimeForSqlAsync”:


Observability Application Insights structured log search

Tracing

Tracing collects required information to enable the observation of a transaction as it “walks” through the system. It must be implemented in every service taking part of the transaction to be effective.

.NET Core defines a common way in which traces can be defined through the System.Diagnostics.Activity class. Through the usage of this class, dependency implementations (i.e. HTTP, SQL, Azure, EF Core, StackExchange.Redis, etc.) can create traces in a neutral way, independent of the monitoring tool used.

It is important to notice that those activities will not be available automatically in a monitoring system. Publishing them is responsibility of the monitoring SDK used. Typically, SDKs have built-in collectors to common activities, transferring them to the destination platform automatically.

In the last quarter of 2019 OpenTelemetry was announced, promising to standardize telemetry instrumentation and collection across languages and tools. Before OpenTelemetry (or its predecessors OpenCensus and OpenTracing), adding observability would often mean adding proprietary SDKs (in)directly to the code base.

The OpenTelemetry .NET SDK is currently in alpha. The Azure Monitor Application Insights team is investing in OpenTelemetry as a next step of Azure Monitor SDKs evolution.

Quick Intro on Tracing with OpenTelemetry

In a nutshell, OpenTelemetry collects traces using spans. A span delimits an operation (HTTP request processing, dependency call). It contains start and end time (among other properties). It has a unique identifier (SpanId, 16 characters, 8 bytes) and a trace identifier (TraceId, 32 characters, 16 bytes). The trace identifier is used to correlate all spans for a given transaction. A span can contain children spans (as calls in a stack trace). If you are familiar with Azure Application Insights, the following table might be helpful to understand OpenTelemetry terms:

Application Insights OpenTelemetry
Request, PageView Span with span.kind = server
Dependency Span with span.kind = client
Id of Request and Dependency SpanId
Operation_Id TraceId
Operation_ParentId ParentId

Adding Tracing to a .NET Core Application

As mentioned previously, an SDK is needed in order to collect and publish distributed tracing in a .NET Core application. Application Insights SDK sends traces to its centralized database while OpenTelemetry supports multiple exporters (including Application Insights). When configured to use OpenTelemetry, the sample application sends traces to a Jaeger instance.

In the asynchronous distributed transaction scenario, track the following operations:

HTTP Requests between microservices

HTTP correlation propagation is part of both SDKs. With the only requirement of setting activity id format to W3C at application start:

public static void Main(string[] args)
{
    Activity.DefaultIdFormat = ActivityIdFormat.W3C;
    Activity.ForceDefaultIdFormat = true;
    // rest is omitted
}

Dependency calls (SQL, RabbitMQ)

Unlike Application Insights SDK, OpenTelemetry (in early alpha) does not yet have support for SQL Server trace collection. A simple way to track dependencies with OpenTelemetry is to wrap the call like the following example:

var span = this.tracer.StartSpan("My external dependency", SpanKind.Client);
try
{  
    return CallToMyDependency();
}
catch (Exception ex)
{
    span.Status = Status.Internal.WithDescription(ex.ToString());
    throw;
}
finally
{
    span.End();
}

Asynchronous Processing / Queued Items

There is no built-in trace correlation between publishing and processing a RabbitMQ message. Custom code is required, creating the publishing activity (optional) and referencing the parent trace during the item dequeuing.

We covered previously creating traces by wrapping the dependency call. This option allows expressing additional semantic information such as links between spans for batching and other fan-in patterns. Another option is to use System.Diagnostics.Activity, which is a SDK independent way to create traces. This option has limited set of features, however, is built-in into .NET.

These two options work well with each other and .NET team is working on making .NET Activity and OpenTelemetry spans integration better.

Creating an Operation Trace

The snippet below demonstrates how the publish operation trace can be created. It adds the trace information to the enqueued message header, which will later be used to link both operations.

Activity activity = null;
if (diagnosticSource.IsEnabled("Sample.RabbitMQ"))
{
    // Generates the Publishing to RabbitMQ trace
    // Only generated if there is an actual listener
    activity = new Activity("Publish to RabbitMQ");  
    diagnosticSource.StartActivity(activity, null);
}

// Add current activity identifier to the RabbitMQ message
basicProperties.Headers.Add("traceparent", Activity.Current.Id);

channel.BasicPublish(...)

if (activity != null)
{
     // Signal the end of the activity
     diagnosticSource.StopActivity(activity, null);
}

A collector, which subscribes to target activities, is required to publish the trace to a backend. Implementing a collector is not a straightforward task and is intended to be used by SDK implementors. The snippet below is taken from the sample application, where a simplified and not production-ready, RabbitMQ collector for OpenTelemetry was implemented:

public class RabbitMQListener : ListenerHandler
{
    public override void OnStartActivity(Activity activity, object payload)
    {
            var span = this.Tracer.StartSpanFromActivity(activity.OperationName, activity);
            foreach (var kv in activity.Tags)
                span.SetAttribute(kv.Key, kv.Value);
    }

    public override void OnStopActivity(Activity activity, object payload)
    {
        var span = this.Tracer.CurrentSpan;
        span.End();
        if (span is IDisposable disposableSpan)
        {
            disposableSpan.Dispose();
        }
    }
}

var subscriber = new DiagnosticSourceSubscriber(new RabbitMQListener("Sample.RabbitMQ", tracer), DefaultFilter);
subscriber.Subscribe();

For more information on how to build collectors, please refer to OpenTelemetry/Application Insights built-in collectors as well as this user guide.

Activity

As mentioned, HTTP requests in ASP.NET have built-in activity correlation injected by the framework. That is not the case for the RabbitMQ consumer. In order to continue the distributed transaction, we must create the span referencing the parent trace. This was injected into the message by the publisher. The snippet below uses an extension method to build the activity:

public static Activity ExtractActivity(this BasicDeliverEventArgs source, string name)
{
    var activity = new Activity(name ?? Constants.RabbitMQMessageActivityName);            

    if (source.BasicProperties.Headers.TryGetValue("traceparent", out var rawTraceParent) && rawTraceParent is byte[] binRawTraceParent)
    {
        activity.SetParentId(Encoding.UTF8.GetString(binRawTraceParent));
    }

    return activity;
}

The activity is then used to create the concrete trace. In OpenTelemetry the code looks like this:

// Note: OpenTelemetry requires the activity to be started
activity.Start();
tracer.StartActiveSpanFromActivity(activity.OperationName, activity, SpanKind.Consumer, out span);

Using Applications Insights

The snippet below creates the telemetry using Application Insights SDK:

// Note: Application Insights will start the activity
var operation = telemetryClient.StartOperation<Dependencytelemetry>(activity);

The usage of activities gives flexibility in terms of SDK used, as it is a neutral way to create traces. Once instrumented the distributed end-to-end transaction in Jaeger looks like this:


Distributed Trace in Jaeger

The same transaction in Application Insights looks like this:


Distributed Trace in Application Insights

When using single monitoring solution for traces and logs, such as Application Insights, the logs become part of the end-to-end transaction:


Observability Application Insights: traces and logs

Metrics

There are common metrics applicable to most applications, like CPU usage, allocated memory, and request time. As well as business specific like visitors, page views, sold items, and sent items. Exposing business metrics in a .NET Core application typically requires using an SDK.

Collection metrics in .NET Core happens through 3rd-party SDKs which aggregate values locally, before sending to a backend. Most libraries have built-in collection for common application metrics. However, business specific metrics need to be built in the application logic, since they are created based on events that occur in the application domain.

In the sample application we are using metric counters for: enqueued items, successfully processed items and unsuccessfully processed items. The implementation in both SDKs is similar, requiring setting up a metric, dimensions and finally, tracking the counter values.

OpenTelemetry supports multiple exporters and we will be using Prometheus exporter. Prometheus combined with Grafana, for visualization and alerting, is a popular choice for open source monitoring. Application Insights supports metrics as any other instrumentation type, requiring no additional SDK or tool.

Defining a metric and tracking values using OpenTelemetry looks like this:

// Create counter
var simpleProcessor = new UngroupedBatcher(exporter, TimeSpan.FromSeconds(5));
var meterFactory = MeterFactory.Create(simpleProcessor);
var meter = meterFactory.GetMeter("Sample App");
var enqueuedCounter = meter.CreateInt64Counter("Enqueued Item");

// Incrementing counter for specific source
var labelSet = new Dictionary<string, string>() 
                {
                    { "Source", source }
                };                
enqueuedCounter.Add(context, 1L, this.meter.GetLabelSet(labelSet));

The visualization with Grafana is illustrated in the image below:


Metrics with Grafana/Prometheus

The snippet below demonstrates how to define a metric and track its values using the Application Insights SDK:

// create counter
var enqueuedCounter = telemetryClient.GetMetric(new MetricIdentifier("Sample App", "Enqueued Item", "Source"));

// Incrementing counter for specific source
enqueuedCounter.TrackValue(metricValue, source);

The visualization in Application Insights is illustrated below:


Observability Application Insights custom metrics

Troubleshooting

Now that we have added the 3 observability pillars to a sample application, let’s use them to troubleshoot a scenario where the application is experiencing problems.

The first signals of an application problems are usually detected by anomalies in metrics. The snapshot below illustrates such a scenario, where the number of failed processed items spikes (red line).


Metrics indicating failure

A possible next step is to look for hints in distributed traces. This should help us identify where the problem is happening. In Jaeger, searching with the tag “error=true” filters the results, listing transaction where at least one error happened.


Jaeger traces with error

In Application Insights, we can search for errors in end-to-end transactions by looking in the Failures/Dependencies or Failures/Exceptions.


Search traces with error in Application Insights


Application Insights error details in trace

The problem seems to be related to the Sample.RabbitMQProcessor service. Logs of this service can help us identify the problem. When using Application Insights logging provider, log and traces are correlated, being displayed in the same view:


Observability Application Insights errors and logs

Looking at the details, we discover that the exception InvalidEventNameException is being raised. Since we are logging the message payload, details of the failed message are available in the monitoring tool. It appears the message being processed has the eventName value of “error”, which is causing the exception to be raised.

Wrapping Up Observability with .NET Core

When introducing observability into a .NET Core application, two decisions need to be taken:

  • The backend(s) where collected data will be stored and analyzed.
  • How instrumentation will be added to the application code.

Depending on your organization, the monitoring tool might already be selected. However, if you do have the chance to make this decision, consider the following:

  • Centralized: having all data in a single place makes it simple to correlate information. For example, logs, distribute traces and CPU usage. If they are split, more effort is required.
  • Manageability: how simple is to manage the monitoring tool? Is it hosted in the same machines/VMs where your application is running? In that case, shared infrastructure unavailability might leave you in the dark. When monitoring is not working, alerts won’t be triggered and metrics won’t be collected.
  • Vendor Locking: if you need to run the same application in different environments (i.e. on premises and cloud), choosing a solution that can run everywhere might be favored.
  • Application Dependencies: parts of your infrastructure or tooling that might require you to use a specific monitoring vendor. For example, Kubernetes scaling and/or progressive deployment based on Prometheus metrics.

Once the monitoring tool has been defined, choosing an SDK is limited to two options. Using the one provided by the monitoring vendor or a library capable of integrating to multiple backends.

Vendor SDKs typically yield little/no surprises regarding stability and functionality. That is the case with Application Insights, for example. It is stable with a rich feature set, including live stream, which is a feature-specific to this specific monitoring system.

OpenTelemetry

Using OpenTelemetry SDK gives you more flexibility, offering integration with multiple monitoring backends. You can even mesh them: a centralized monitoring solution for all collected data, while having a subset sent to Prometheus to fulfill a requirement. If you are unsure whether OpenTelemetry is a good fit for your project, consider the following:

  • When is your project going to production? The SDK is currently in alpha, meaning breaking changes and non-production-ready is expected.
  • Are you using vendor specific features not yet available through the OpenTelemetry SDK (specific collectors, etc.)?
  • Is your monitoring backend supported by the SDK?
  • Are you replacing a vendor SDK with OpenTelemetry? Plan some time to compare both SDKs, OpenTelemetry exporters might have differences compared to how the vendor SDK collects data.

Source code with the sample application can be found in this GitHub Repository.

The post ASP.NET Core Apps Observability appeared first on ASP.NET Blog.

Provisional Mode

$
0
0

A coworker asked me what this “PMFullGC” trigger reason he’s seeing in GCStats means. I thought it’d be useful to share the info here.

PM stands for Provisional Mode which means after a GC starts, it can change its mind about the kind of GC it’s doing. But what does that mean exactly?

So normally when we start a GC, the first things we do are-

  1. determine which generation we collet
  2. if it’s a gen2 we decide if it should be done a background or blocking GC

And after that the collection work will start and go with the decision we made.

When provisional mode is on, while we are already in the middle of a GC, we can say “hmm, it looks like collecting this generation was not a good idea, let’s go with a different generation instead”. This is to handle the cases where our prediction of how the heap would behave is very difficult to get right (or would be expensive to get it more right when we were predicting). Currently there’s only one situation that would trigger this provisional mode. In the future we might add more.

The one situation that triggers the provisional mode is when we detect high memory/high gen2 frag situation during a full blocking GC. And is turned off when we detect neither situation is true in a full blocking GC.

Before I added this provisional mode, the tuning heuristic for this particular situation, ie, high memory load and high fragmentation in gen2, would cause us to do a lot of full compacting GCs because we would think it’d be productive – after all there’s a lot of free space in gen2 and doing a compacting GC would compact it away and get the heap size down which is what we really want when the memory load is high. But if the fragmentation is due to pinning and the pins keep not going away, we could compact but the heap is not shrinking because the pins are still there. And they are in gen2 so it’s harder to use.

We can’t easily predict when the pins will go away. We do know about the pinned handles but we also need to know how much free space would result inbetween them. And it’s hard to know stack pinning unless you actually go walk the stacks. We can operate on the previous knowledge and perhaps stop doing compacting gen2’s for a while and try it again after some number of GCs.

The way I chose to handle this was when we detect this high memory/high fragmentation situation when we do a full compacting GC, we put GC in this provisional mode. And next time when the normal tuning says we are supposed to do a full blocking GC again, we would reduce it to a gen1 compacting GC. We keep doing this and compact as many gen1 survivors into the gen2 free list (so it doesn’t actually increase gen2 size) till a gen1 GC where we can’t fit gen1 survivors into gen2 free list anymore. At this point we change our mind and say we actually want to do a full compacting GC instead. So these GCs are said to be “provisioned” and the trigger reason for this full compacting GC is what you see in GCStats – PMFullGC.

This way I didn’t need to change much of the existing tuning logic. And when we change our mind during the middle of a gen1 GC, we just do a sweeping gen1 so it’ll quickly finish and immediately trigger a full compacting GC right after. We could actually discard what we’ve done so far for this gen1 and “restart” it as a full compacting GC but it doesn’t gain much and would require a much bigger code churn. Since we are discovering this right before we need to decide whether this should be a compacting or sweeping gen1 it’s trivial to just make it a sweeping gen1.

And when we trigger this full compacting GC, if we then detect we are out of the high memory load/high fragmentation situation, most likely because the pins were gone so we were able to compact and reduce the memory load, we could take GC out of the provisional mode.

Of course we hope that normally you don’t have a bunch of pins in gen2 that keep not going away which was why we had our previous tuning logic. And that logic worked well if there wasn’t high fragmentation created by pinning. But we did want to handle this so we could accommodate more customer scenarios. There was a team that hit exactly this situation and before the provisional mode was added they saw many full compacting GCs which made % pause time in GC very high. With this provisional mode they saw the % pause time in GC reduced dramatically because they were doing much fewer full compacting GCs since most of them got converted to gen1s, and still maintained the same heap size.

I also explained provisional mode during my meetup talk in Prague last year. It was made available in 4.7.x on .NET and 3.0 on .NET Core.

The post Provisional Mode appeared first on .NET Blog.

AVX-512 Auto-Vectorization in MSVC

$
0
0

In Visual Studio 2019 version 16.3 we added AVX-512 support to the auto-vectorizer of the MSVC compiler. This post will show some examples and help you enable it in your projects.

What is the auto vectorizer?

The compiler’s auto vectorizer analyzes loops in the user’s source code and generates vectorized code for a vectorization target where feasible and beneficial.

static const int length = 1024 * 8;
static float a[length];
float scalarAverage() {
    float sum = 0.0;
    for (uint32_t j = 0; j < _countof(a); ++j) {
        sum += a[j];
    }

    return sum / _countof(a);
}

For example, if I build the code above using cl.exe /O2 /fp:fast /arch:AVX2 targeting AVX2, I get the following assembly. The lines 11-15 are the vectorized loop using ymm registers. The lines 16-21 are to calculate the scalar value sum from vector values coming out of the vector loop. Please note the number of iterations of the vector loop is only 1/8 of the scalar loop, which usually translates to improved performance.

?scalarAverage@@YAMXZ (float __cdecl scalarAverage(void)):
00000000: push ebp
00000001: mov ebp,esp
00000003: and esp,0FFFFFFF0h
00000006: sub esp,10h
00000009: xor eax,eax
0000000B: vxorps xmm1,xmm1,xmm1
0000000F: vxorps xmm2,xmm2,xmm2
00000013: nop dword ptr [eax]
00000017: nop word ptr [eax+eax]
00000020: vaddps ymm1,ymm1,ymmword ptr ?a@@3PAMA[eax]
00000028: vaddps ymm2,ymm2,ymmword ptr ?a@@3PAMA[eax+20h]
00000030: add eax,40h
00000033: cmp eax,8000h
00000038: jb 00000020</span>
0000003A: vaddps ymm0,ymm2,ymm1
0000003E: vhaddps ymm0,ymm0,ymm0
00000042: vhaddps ymm1,ymm0,ymm0
00000046: vextractf128 xmm0,ymm1,1
0000004C: vaddps xmm0,xmm1,xmm0
00000050: vmovaps xmmword ptr [esp],xmm0</span>
00000055: fld dword ptr [esp]
00000058: fmul dword ptr [__real@39000000]
0000005E: vzeroupper
00000061: mov esp,ebp
00000063: pop ebp
00000064: ret

What is AVX-512?

AVX-512 is a family of processor extensions introduced by Intel which enhance vectorization by extending vectors to 512 bits, doubling the number of vector registers, and introducing element-wise operation masking. You can detect support for AVX-512 using the __isa_available variable, which will be 6 or greater if AVX-512 support is found. This indicates support for the F(Foundational) instructions, as well as instructions from the VL, BW, DQ, and CD extensions which add additional integer vector operations, 128-bit and 256-bit operations with the additional AVX-512 registers and masking, and instructions to detect address conflicts with scatter stores. These are the same instructions that are enabled by /arch:AVX512 as described below. These extensions are available on all processors with AVX-512 that Windows officially supports. More information about AVX-512 can be found in the following blog posts that we published before.

How to enable AVX-512 vectorization?

/arch:AVX512 is the compiler switch to enable AVX-512 support including auto vectorization. With this switch, the auto vectorizer may vectorize a loop using instructions from the F, VL, BW, DQ, and CD extensions in AVX-512.

To build your application with AVX-512 vectorization enabled:

  • In the Visual Studio IDE, you can either add the flag /arch:AVX512 to the project Property Pages > C/C++ > Command Line > Additional Options text box or turn on /arch:AVX512 by choosing Advanced Vector Extension 512 following Project Properties > Configuration Properties > C/C++ > Code Generation > Enable Enhanced Instruction Set > Advanced Vector Extension 512 (/arch:AVX512). The second approach is available in Visual Studio 2019 version 16.4.
  • If you compile from the command line using cl.exe, add the flag /arch:AVX512 before any /link options.

If I build the prior example again using cl.exe /O2 /fp:fast /arch:AVX512, I’ll get the following assembly targeting AVX-512. Similarly, the lines 7-11 are the vectorized loop. Note the loop is vectorized with zmm registers instead of ymm registers. With the expanded width of zmmx registers, the number of iterations of the AVX-512 vector loop is only half of its AVX2 version.

?scalarAverage@@YAMXZ (float __cdecl scalarAverage(void)):
00000000: push ecx
00000001: vxorps xmm0,xmm0,xmm0
00000005: vxorps xmm1,xmm1,xmm1
00000009: xor eax,eax
0000000B: nop dword ptr [eax+eax]
00000010: vaddps zmm0,zmm0,zmmword ptr ?a@@3PAMA[eax]
0000001A: vaddps zmm1,zmm1,zmmword ptr ?a@@3PAMA[eax+40h]
00000024: sub eax,0FFFFFF80h
00000027: cmp eax,8000h
0000002C: jb 00000010
0000002E: vaddps zmm1,zmm0,zmm1
00000034: vextractf32x8 ymm0,zmm1,1
0000003B: vaddps ymm1,ymm0,ymm1
0000003F: vextractf32x4 xmm0,ymm1,1
00000046: vaddps xmm1,xmm0,xmm1
0000004A: vpsrldq xmm0,xmm1,8
0000004F: vaddps xmm1,xmm0,xmm1
00000053: vpsrldq xmm0,xmm1,4
00000058: vaddss xmm0,xmm0,xmm1
0000005C: vmovss dword ptr [esp],xmm0
00000061: fld dword ptr [esp]
00000064: fmul dword ptr [__real@39000000]
0000006A: vzeroupper
0000006D: pop ecx
0000006E: ret

Closing remarks

For this release, we aim at achieving parity with /arch:AVX2 in terms of vectorization capability. There are still many things that we plan to improve in future releases. For example, our next AVX-512 improvement will take advantage of the new masked instructions. Subsequent updates will support embedded broadcast, scatter, and 128-bit and 256-bit AVX-512 instructions in the VL extension.

As always, we’d like to hear your feedback and encourage you to download Visual Studio 2019 to try it out. If you encounter any issue or have any suggestion for us, please let us know through Help > Send Feedback > Report A Problem / Suggest a Feature in Visual Studio IDE, or via Developer Community, or or Twitter @visualc.

The post AVX-512 Auto-Vectorization in MSVC appeared first on C++ Team Blog.


What’s New in Visual Studio Online

$
0
0

TL;DR

Last November, we unveiled the public preview of Visual Studio Online, which provides managed, on-demand development environments that can be accessed from anywhere using either Visual Studio Code, Visual Studio IDE (in private preview), or the included browser-based editor. Since then, the Visual Studio Online team hasn’t slowed down and we’re excited to bring you several new features ranging from enhanced environment configuration with custom Dockerfile support to enabling setting changes to environments. Your feedback in surveys, phone calls, and on our GitHub have been invaluable to us in defining and prioritizing these updates.


Take environment customization to the next level

Environments are as unique as the projects within them and we heard from many of you that our current customization options weren’t enough. To give you greater control over your environment setup and improve repeatability, we’ve enabled support for Docker images and Dockerfiles and provided more insight into environment creation with our new progress screen. Additionally, you can also specify a GitHub pull request or branch URL, allowing you to jump directly into a pull request review or particular branch after the environment is created.

Webview showing the completion progress and terminal output of environment creation steps from the Visual Studio Online browser experience
Environment creation leveraging a Dockerfile with new progress indicators.


Support for more projects out of the box

In our initial release, we did our best to provide a default environment setup that addressed some of the most popular development scenarios, in case your repository didn’t have a specified setup. Based on your feedback we’ve expanded our default environment configuration to include  PowerShell, Azure CLI, native debugging for Go and C++, updated .NET Core SDKs, and improved Python support. Try it out with a project today and let us how it goes!


Activate turbo mode

One thing we’ve been considering is how we provide the power you need at the specific times you need it. With this release, we’ve enabled the ability to change your environment settings after creation. Start out with a standard instance for editing code and when you’re ready to build or run, switch your environment to a premium instance for more power (it’s like jumping into turbo mode)! When you’re done with intensive operations, switch back to standard to minimize your costs. You can also change your suspension policy to give you more flexible control over the lifetime of your environment.

Environment card with drop down menus that allows for changing environment settings
Easily change your environment settings from the portal…


User activating the command palate, finding the Change Environment Settings command, and then selecting the options to change.
…or from with the Visual Studio Code command palette.


Clean up your plans

As you’ve tried out Visual Studio Online, I’ll bet you created a plan or two just to see how the process works and now you might have a plan you don’t really need anymore. Instead of going to the Azure portal to delete your plan, you can now also delete plans through both the browser and in Visual Studio Code.

Deleting a plan via the Settings Pane in Visual Studio Online
Delete a plan directly from the Visual Studio Online portal…


Delete plan via the Delete Plan command in the Visual Studio Code command palette
…or from within Visual Studio Code!


Turn on the latest features from Visual Studio Code in the browser

For those of you who like to live life on the cutting edge, we’ve enabled Visual Studio Code Insiders in the browser so you can try out the latest and greatest Visual Studio Code has to offer, whether that’s on your local machine or on the web.

Turnign on Visual Studio Code Insiders via the Settings pane on Visual studio Online
Turn on Insiders via the Settings Pane.


Let us know how it goes!

Many of these features have been driven directly from feedback from you, whether that was helping us prioritize work or determine the right customer experience for a feature. Be sure to give these new additions a whirl and let us know how we can continue to improve them or what features we should work on next on our GitHub!


The post What’s New in Visual Studio Online appeared first on Visual Studio Blog.

Using Docker in Windows for Linux Subsystem (WSL) 2

Azure HDInsight and Azure Database for PostgreSQL news

$
0
0

I’ve been committed to open source software for over a decade because it fosters a deep collaboration across the developer community, resulting in ground-breaking innovation. At the heart of open source is the freedom to learn from each other and share ideas, empowering the brightest minds to work together on the cutting edge of software development.

Over the last decade, Microsoft has become one of the largest open source contributors in the world, adding to Hadoop, Linux, Kubernetes, Python, and more. Not only did we release our own technologies like Visual Studio Code as open source, we have also collaborated and contributed to existing open source projects. One of our proudest moments was when we became the release masters for YARN in late 2018, having open sourced over 150,000 lines of code, which enabled YARN to run on clusters 10x larger than before. We're actively growing our community of open source committers within Microsoft.

We’re constantly exploring new ways to better serve our customers in their open source journey. Our commitment is to combine the innovation open source has to offer with the global reach and scale of Azure. Today, we're excited to share a few important updates to accelerate our customers’ open source innovation.

Microsoft supported distribution of Apache Hadoop

Microsoft has been an early supporter of the Hadoop ecosystem since the launch of HDInsight in 2013. With HDInsight, we have been focused on delivering seamless integration of key Azure services like Azure Data Factory and Azure Data Lake Storage, with the power of the most popular open source frameworks to enable comprehensive analytics pipelines. To accelerate this momentum, we're pleased to share a Microsoft supported distribution of Apache Hadoop and Spark for our new and existing HDInsight customers. This distribution of Apache Hadoop is 100 percent open source and compatible with the latest version of Hadoop. Users can now provision a new HDInsight cluster based on Apache code that is built and wholly supported by Microsoft.

By providing a Microsoft supported distribution of Apache Hadoop and Spark, our customers will benefit from enterprise-grade security features like encryption, and native integration with key Azure stores and services like Azure Synapse Analytics and Azure Cosmos DB. Best of all, given that Microsoft directly supports this distribution, we can quickly provide support and upgrades to our customers and deliver the latest innovation from the Hadoop ecosystem. All of this will enable customers to innovate faster, without being restricted to proprietary technology just to use our support and features. Additionally, Azure will continue to develop a vibrant marketplace of open source vendors

“We at Cloudera welcome the commitment from Microsoft to Apache Hadoop and Spark. Open-source is key to our mutual customers’ success. Microsoft’s initiative represents a strong endorsement of open-source for the enterprise and we are excited to continue our partnership with Cloudera Data Platform for Microsoft Azure.” Mick Hollison, Chief Marketing Officer at Cloudera

This is part of our strong commitment to Hadoop, open source analytics, and the HDInsight service. In addition to our deeper engagement in supporting open source Hadoop and Spark, in the coming months, we’ll enable the most requested features on HDInsight that lower costs and accelerate time to value. These include an improved provisioning and management experience, reserved instance pricing, low-priority virtual machines, and auto-scale.

We have always sought to meet customers where they are, from our decision four years ago to support HDInsight solely on Linux, to our recent migration of clusters distribution in-house. Customers don't need to take any specific actions to benefit from these changes. These upcoming improvements to HDInsight will be seamless and automatic, with no business interruption or pricing changes.

Welcome new PostgreSQL committers

Since the Citus Data acquisition, we have doubled down on our PostgreSQL investment based on the tremendous customer demand and developer enthusiasm for one of the most versatile databases in the world. Today, Azure Database for PostgreSQL Hyperscale is generally available, and it’s one of our first Azure Arc-enabled services.

The innovation and ingenuity of PostgreSQL continue to inspire us, and it would not be possible without the contribution and passion of a dedicated community. We will continue to contribute to PostgreSQL. Recently, we contributed pg_autofailover to the community to share our learnings of operating PostgreSQL at cloud scale.

To build on our investment in PostgreSQL, we're excited to welcome Andres Freund, Thomas Munro, and Jeff Davis to the team. Together, they bring a decade of collective experience and a leading track record as core committers to PostgreSQL. They, like the rest of the team, are engaging with and listening to the global Postgres community, as we work to deliver the best of cloud scale, security, and manageability to open source innovation.      

We're committed to actively engaging the open source community and providing our customers with choice and flexibility. The true open source spirit is about collaboration, and we’re excited to combine the best of open source software with the breadth of Azure. Most importantly, we are bringing together the best minds and talented visionaries, both at Microsoft and in the broader open source community, to constantly improve our open source products and deliver the newest features to our customers. Here’s to open source!

Additional resources

Working remotely during challenging times

.NET Framework February 2020 Preview of Quality Rollup for Windows 10 1909, Windows 10 1903, Windows Server, version 1909 and Windows Server, version 1903

$
0
0

Today, we are releasing the February 2020 Preview of Quality Rollup for Windows 10 1909, Windows 10 1903, Windows Server, version 1909 and Windows Server, version 1903.

Quality and Reliability

This release contains the following quality and reliability improvements.

CLR1

  • Addresses an issue with rare crashes or deadlocks that could occur if a GC occurs while another thread is running NGen’ed code which makes the initial call into a static method within the same module where one or more parameter types involve type-forwarded value types.
  • Addresses rare crashes that could occur if Server GC is enabled and a GC occurs while another thread is running NGen’ed code which is making the initial call into NGen’ed code in a 2nd module where one or more parameter types involve valuetypes defined in a 3rd module.
  • The PAUSE instruction latency increased dramatically on the Intel Skylake processor (documented in “Section 2.2.4 Pause Latency in Skylake Microarchitecture” of the Intel 64 and IA-32 Architectures Optimization Reference Manual). As such places in the runtime that call YieldProcessor (which translates to this instruction) in a loop needed to adjust the number of iterations to call it. GC now takes a scale factor (provided by testing how long the instruction takes and scaling it down) and uses that to adjust the number of iterations so the total time approximates what happened on previous processors. A common symptom is in Server GC where GC spends a much larger percentage in CPU time inclr!SVR::t_join::join and with this change you should see the time go down to the previous percentage.
  • Addresses an issue with a crash that could occur in some configurations involving either hot-added CPUs or multi-group machines where per-group CPU count is not consistent across all groups.
  • Addresses an issue with a rare crash that can occur during the first call that native code makes into the managed portion of a mixed-mode DLL.

WCF2

  • Addresses an issue when using the WCFNetTcp binding. If a client stops responding during the connection handshake, sometimes a service will use the binding receive timeout instead of the open timeout. This update ensures that the correct open timeout is used during the entire handshake.

Workflow2

  • Addresses an accessibility issue where text inside a Windows Workflow Foundation Visual Basic Editor would use the wrong colors in high contrast themes.

Winforms

  • Addresses an issue with interaction between WPF user control and hosting WinForms app when processing keyboard input.
  • Addresses an issue getting accessible objects for PropertyGridView ComboBox property items – adding the verification for item existence and validity.
  • Addresses an issue with WinForms ComboBox control reinitialization in AD FS MMC UI.

1 Common Language Runtime (CLR)
2 Windows Communication Foundation (WCF)

Getting the Update

The Preview of Quality Rollup is available via Windows Update, Windows Server Update Services, and Microsoft Update Catalog.

Microsoft Update Catalog

You can get the update via the Microsoft Update Catalog. For Windows 10, NET Framework 4.8 updates are available via Windows Update, Windows Server Update Services, Microsoft Update Catalog. Updates for other versions of .NET Framework are part of the Windows 10 Monthly Cumulative Update.

Note: Customers that rely on Windows Update and Windows Server Update Services will automatically receive the .NET Framework version-specific updates. Advanced system administrators can also take use of the below direct Microsoft Update Catalog download links to .NET Framework-specific updates. Before applying these updates, please ensure that you carefully review the .NET Framework version applicability, to ensure that you only install updates on systems where they apply.

The following table is for Windows 10 and Windows Server 2016+ versions.

Product Version Cumulative Update
Windows 10 1909 and Windows Server, version 1909
.NET Framework 3.5, 4.8 Catalog 4537572
Windows 10 1903 and Windows Server, version 1903
.NET Framework 3.5, 4.8 Catalog 4537572

Previous Monthly Rollups

The last few .NET Framework Monthly updates are listed below for your convenience:

The post .NET Framework February 2020 Preview of Quality Rollup for Windows 10 1909, Windows 10 1903, Windows Server, version 1909 and Windows Server, version 1903 appeared first on .NET Blog.

Viewing all 5971 articles
Browse latest View live


<script src="https://jsc.adskeeper.com/r/s/rssing.com.1596347.js" async> </script>