With schools and daycares closed the world over, and so many of us working remotely, the lines between work and home have blurred.
The post 5 tips for working from home with children appeared first on Microsoft 365 Blog.
With schools and daycares closed the world over, and so many of us working remotely, the lines between work and home have blurred.
The post 5 tips for working from home with children appeared first on Microsoft 365 Blog.
We looked back to see what data could teach us from China.
The post Key findings about remote work: lessons from our colleagues in China appeared first on Microsoft 365 Blog.
With retail locations closed, this customer-obsessed team continues to make an impact.
The post How nearly 2,000 Microsoft Store employees pivoted to remote work appeared first on Microsoft 365 Blog.
At Microsoft Ignite 2019, we announced the preview of more than 15 new features. This blog provides an update for the features that are now generally available to our customers.
As the world comes together to combat COVID-19, and remote work becomes a critical capability for many companies, it’s extremely important to maintain the security posture of your cloud assets while enabling more remote workers to access them.
Azure Security Center can help prioritize the actions you need to take to protect your security posture and provide threat protection for all your cloud resources.
Azure Security Center continues to extend its threat protection capabilities to counter sophisticated threats on cloud platforms:
Azure Security Center can scan container images in Azure Container Registry (ACR) for vulnerabilities.
The image scanning works by parsing through the packages or other dependencies defined in the container image file, then checking to see whether there are any known vulnerabilities in those packages or dependencies (powered by a Qualys vulnerability assessment database).
The scan is automatically triggered when pushing new container images to Azure Container Registry. Found vulnerabilities will surface as Security Center recommendations and be included in the Secure Score together with information on how to patch them to reduce the attack surface they allowed.
Since we launched the preview at Ignite 2019, registered subscriptions initiated over 1.5 million container image scans. We have carefully analyzed the feedback we received and incorporated it into this generally available version. We have added scanning status to reflect the progress of the scan (Unscanned, Scan in progress, Scan error, and Completed) and improved the user experience based on the feedback we've received from you.
The popular, open source, platform Kubernetes has been adopted so widely that it is now an industry standard for container orchestration. Despite this widespread implementation, there’s still a lack of understanding regarding how to secure a Kubernetes environment. Defending the attack surfaces of a containerized application requires expertise. You need to ensure the infrastructure is configured securely, and constantly monitor for potential threats. Support for Security Center Azure Kubernetes Service (AKS) is now generally available.
The capabilities include:
For the generally available release, we've added new alerts (for the full list please visit Alerts for Azure Kubernetes Service clusters and Alerts for containers - host level sections of the alerts reference table), and alert details were fine tuned to reduce false positives.
Misconfiguration is the most common cause of security breaches for cloud workloads. Azure Security Center provides you with a bird’s eye security posture view across your Azure environment, enabling you to continuously monitor and improve your security posture using the Azure Secure Score. Security Center helps manage and enforce your security policies to identify and fix such misconfigurations across your different resources and maintain compliance. We continue to expand our resource coverage and the depth insights that are available in security posture management.
Our customers have been wanting to extend their current security assessments coverage in Security Center with their own security assessments based on policies that they create in Azure Policy. With support for custom policies, this is now possible.
We're also announcing that Azure Security Center’s support for custom policies is generally available. These new policies will be part of the Azure Security Center recommendations experience, Secure Score, and the regulatory compliance standards dashboard. With the support for custom policies, you are now able to create a custom initiative in Azure policy and add it as a policy in Azure Security Center through a simple click-through onboarding experience and visualize them as recommendations.
For this release, we've added the ability to edit the custom recommendation metadata to include severity, remediation steps, threat information, and more.
We are introducing a new API to get Azure Security Center recommendations with information and provide you the reason why assessments failed. The new API includes two APIS:
We advise that our customers using the existing Tasks API should use the new Assessments API for their reporting.
You can now add ‘dynamic compliance packages,’ or additional standards beyond the ‘built-in’ compliance packages in regulatory compliance.
The regulatory compliance dashboard in Azure Security Center provides insights into your compliance posture relative to a set of industry standards, regulations, and benchmarks. Assessments continually monitor the security state of your resources and are used to analyze how well your environment is meeting the requirements for specific compliance controls. Those assessments also include actionable recommendations for how to remediate the state of your resources and thus improve your compliance status.
Initially, the compliance dashboard included a very limited set of standards that were ‘built-in’ to the dashboard and relied on a static set of rules included with Security Center. With the dynamic compliance packages feature, you can add new standards and benchmarks that are important to you to your dashboard. Compliance packages are essentially initiatives defined in Azure Policy. When you add a compliance package to your subscription or management group from the ASC Security Policy, that essentially assigns the regulatory initiative to your selected scope (subscription or management group). You can see that standard or benchmark appear in your compliance dashboard with all associated compliance data mapped as assessments.
In this way, you can track newly published regulatory initiatives as compliance standards in your Security Center regulatory compliance dashboard, Additionally, when Microsoft releases new content for the initiative (new policies that map to more controls in the standard), the additional content appears automatically in your dashboard. You are also able to download a summary report for any of the standards that have been onboarded to your dashboard.
There are several supported regulatory standards and benchmarks that can be onboarded to your dashboard. The newest one is the Azure Security Benchmark, which is the Microsoft-authored Azure-specific guidelines for security and compliance best practices based on common compliance frameworks. Additional standards will be supported by the dashboard as they become available.
For more information about dynamic compliance packages, see the documentation here.
Organizations with centrally managed security and IT operations implement internal workflow processes to drive required action within the organization when discrepancies are discovered in their environments. In many cases, these workflows are repeatable processes and automation can greatly reduce overhead streamline processes within the organization.
Workflow automation in Azure Security Center, now generally available, allows customers to create automation configurations leveraging Azure Logic Apps and to create policies that will automatically trigger them based on specific Security Center findings such as Recommendations or Alerts. Azure Logic App can be configured to do any custom action supported by the vast community of Logic App connectors or use one of the templates provided by Security Center such as sending an email. In addition, users are now able to manually trigger a Logic App on an individual alert or recommendation directly from the recommendation (with a ‘quick fix’ option) or alert page in Azure Security Center.
The continuous export feature of Azure Security Center, which supports the export of your security alerts and recommendations, is now generally available, also via policies. Use it to easily connect the security data from your Security Center environment to the monitoring tools used by your organization, by exporting to Azure Event Hubs or Azure Log Analytics workspaces.
This capability supports enterprise-scale scenarios, among others, via the following integrations:
For more information, read about continuous export.
With these additions, Azure continues to provide a secure foundation and gives you built-in native security tools and intelligent insights to help you rapidly improve your security posture in the cloud. Azure Security Center strengthens its role as the unified security management and advanced threat protection solution for your hybrid cloud.
Security can’t wait. Get started with Azure Security Center today and visit Azure Security Center Tech Community, where you can engage with other security-minded users like yourselves.
This blog post was co-authored by Chad Raynor, Principal Program Manager, Azure Maps.
Updates to Azure Maps services include new and recently added features, including the general availability of Azure Maps services on Microsoft Azure Government cloud. Here is a rundown of the new and recently added features for Azure Maps services:
The general availability of Azure Maps for Azure Government cloud allows you to easily include geospatial and location intelligence capabilities in solutions deployed on Azure Government cloud with the quality, performance, and reliability required for enterprise grade applications. Microsoft Azure Government delivers a cloud platform built upon the foundational principles of security, privacy and control, compliance, and transparency. Public sector entities receive a physically isolated instance of Microsoft Azure that employs world-class security and compliance services critical to the US government for all systems and applications built on its architecture.
Azure Maps Batch capabilities available through Search and Route services are now generally available. Batch services allows customers to send batches of queries using just a single API request.
Batch capabilities are supported by the following APIs:
Users have now an option to submit synchronous (sync) request, which is designed for lightweight batch requests. When the service receives a request, it will respond as soon as the batch items are calculated instead of returning a 202 along with a redirect URL. With sync API there will be no possibility to retrieve the results later. When Azure Maps receives sync request, it responds as soon as the batch items are calculated. For large batches, we recommend continuing to use the Asynchronous API that is appropriate for processing big volumes of relatively complex route requests.
For Search APIs, the Asynchronous API allows developers to batch up to 10,000 queries and sync API up to 100 queries. For Route APIs, the Asynchronous API allows developers to batch up to 700 queries and sync API up to 100 queries.
The Matrix Routing API is now generally available. The service allows calculation of a matrix of route summaries for a set of routes defined by origin and destination locations. For every given origin, the service calculates the travel time and distance of routing from that origin to every given destination.
For example, let's say a food delivery company has 20 drivers and they need to find the closest driver to pick up the delivery from the restaurant. To solve this use case, they can call Matrix Route API.
The team worked to improve the Matrix Routing performance and added support to submit synchronous request like for the batch services described above. The maximum size of a matrix for asynchronous request is 700 and for synchronous request it's 100 (the number of origins multiplied by the number of destinations).
For Asynchronous API calls we introduced new waitForResults parameter. If this parameter is set to be true, user will get a 200 response if the request is finished under 120 seconds. Otherwise, user will get a 202 response right away and async API will return users an URL to check the progress of async request in the location header of the response.
Like Azure Maps Get Map Tiles API v1, our new Get Map Tile version 2 API, in preview, allows users to request map tiles in vector or raster format typically to be integrated into a map control or SDK. The service allows to request various map tiles, such as Azure Maps road tiles or real-time Weather Radar tiles. By default, Azure Maps uses vector map tiles for its SDKs.
The new version will offer users more consistent way to request data. The new version introduces a concept of tileset, a collection of raster or vector data that are further broken up into a uniform grid of square tiles at preset zoom levels. Every tileset has a tilesetId to request a specific tileset. For example, microsoft.base.
Also, Get Map Tile v2now supports the option to call imagery data that was earlier only available through Get Map Imagery Tile API. In addition, Azure Maps Weather Service radar and infrared map tiles are only available through the version 2.
In addition to serve the Azure Maps dark grey map style through our SDKs, customers can now also access it through Get Map Tile APIs (version 1 and version 2) and Get Map Image API in vector and raster format. This empowers customers to create rich map visualizations, such as embedding a map image into a web page.
Azure Maps dark grey map style.
The Azure Maps team has continued to make improvements to the Routing APIs. We have added new parameter value avoid=borderCrossings to support routing scenarios where vehicles are required to avoid country/region border crossings, and keep the route within one country.
To offer more advanced vehicle routing capabilities, customers can now include areas to avoid in their POST Route Directions API request. For example, a customer might want to avoid sending their vehicles to a specific area because they are not allowed to operate in the area without a permission form the local authority. As a solution, users can now pass in the route request POST body polygons in GeoJSON format as a list of areas to avoid.
Through Azure Maps map control, users have now option to render 2.5D building models on the map. By default, all buildings are rendered as just their footprints. By setting showBuildingModels to true, buildings will be rendered with their 2.5D models. Try the feature now.
Display building models.
To improve the user experience and give more detailed views, we reduced the boundary data simplification reduction to offer better visual experience at higher zoom levels. User can now see more detailed polygon boundary data.
 Left: Before boundary data simplification reduction. Right: After boundary data simplification reduction.
Based on feedback from our users, we simplified labels for scatters polygons by reducing the number of labels. Also, National park and National Forest labels are displayed already on zoom level 6.
National Park and National Forest labels displayed on zoom level 6.
We always appreciate feedback from the community. Feel free to comment below, post questions to Stack Overflow, or submit feature requests to the Azure Maps Feedback UserVoice.
Announcing a fully interactive Yammer app called “Communities” that brings your communities and conversations directly into Microsoft Teams.
The post Connect people across the entire organization through communities in Microsoft Teams appeared first on Microsoft 365 Blog.
 It's hard. Now, to be clear, if you're working at all in these times, you're very fortunate. I am very fortunate to have a job that lets me work from home. Many of my coworkers, friends, and colleagues have been thrown into remote work - some in a frantic "get your laptop and you're now working from home" moment.
I have written a lot about Remote Work and done a number of podcasts on the topic. I've been working from my home now, full time, for 13 years. It's fair to say that I am an experienced Remote Worker if not an expert.
If you're new to Remote Work and you're feeling some kind of way, I want to say this as an expert in remote working - This thing we are doing now isn't remote work.
Know that and absorb that and know that you're OK and this thing you're feeling - wow, Remote Works SUCKS! - is normal. You're not alone.
Just look at the replies to this tweet:
Quarantine work !== Remote work.
— Scott Hanselman (@shanselman) April 20, 2020
I’ve been working remotely with success for 13 years, and I’ve never been close to burn out.
I’ve been working quarantined for over a month and I’m feeling a tinge if burn out for the first time in my life. Take care of yourself folks. Really.
People are overwhelmed, afraid, and stressed. There's a background pressure - a psychic weight or stress - that is different in these times. This isn't a problem you can fix with a new webcam or a podcasting mic.
Working from home feels freeing and empowering. Working while quarantined is a luxurious prison.
I've got two kids at home suddenly, one who's had their last year before high school cut short and now we struggle as a couple to work our jobs AND educate the kids in an attempt to create some sense of normalcy and continuity. I applaud the single parents and folks trying to work outside the home AND take care of little ones in these times.
We also feel the guilt of working from home at all. We appreciate the front line workers (my wife is a nurse, my brother a firefighter) who don't have this luxury. The garbagemen and women, the grocery store stockers, truck drivers, food processors, and farmers. We do our best to be thankful for their work while still getting our own jobs done.
What's the point of this post? To remind you, the new remote worker, that this isn't normal. This isn't really representative of remote work. Hang in there, things will hopefully go back to some kind of normal and if we're lucky, perhaps you and I will be able to try out remote working and feel ok about it.
Here's some more resources. Be safe.
Sponsor: Have you tried developing in Rider yet? This fast and feature-rich cross-platform IDE improves your code for .NET, ASP.NET, .NET Core, Xamarin, and Unity applications on Windows, Mac, and Linux.
Since launching Azure Archive Storage, we've seen unprecedented interest and innovative usage from a variety of industries. Archive Storage is built as a scalable service for cost-effectively storing rarely accessed data for long periods of time. Cold data, including application backups, healthcare records, autonomous driving recordings, and other data sets that might have been previously deleted could be stored in Azure Storage’s Archive tier in an offline state, then rehydrated to an online tier when needed.
With your usage and feedback, we’ve made our archive improvements generally available, making our service even better.
Priority retrieval allows you to flag the rehydration of your data from the offline archive tier back into an online hot or cool tier as a high priority action. By paying a little bit more for the priority rehydration operation, your archive retrieval request is placed in front of other requests and your offline data is expected to be returned online in less than one hour.
The two archive retrieval options are:
Priority retrieval is recommended to be used for emergency requests for a subset of an archive dataset. For the majority of use cases, our customers plan for and utilize standard archive retrievals which complete in less than 15 hours. On rare occasions, a retrieval time of an hour or less is required for business continuity. Priority retrieval requests can deliver archive data in a fraction of the time of a standard retrieval operation, allowing our customers to quickly resume business as usual. For more information, please see the Azure Blob rehydration documentation.
You can upload your blob data using PutBlob or PutBlockList directly to the access tier of your choice using the optional parameter x-ms-access-tier. This allows you to upload your object directly into the hot, cool, or archive tier regardless of your account’s default access tier setting. This capability makes it simple for customers to upload objects directly to Azure Archive in a single transaction. Then, as data usage patterns change, you would change the access tier of the blob manually with the Set Blob Tier API or automate the process with blob lifecycle management rules. For more information, please see the Azure Blob storage access tiers documentation.
In certain scenarios, you may want to keep your original data untouched but work on a temporary copy of the data. The Copy Blob API is now able to support the archive access tier; allowing you to copy data into and out of the archive access tier within the same storage account. With our access tier of choice enhancement, you can set the optional parameter x-ms-access-tier to specify which destination access tier you would like your data copy to inherit. If you are copying a blob from the archive tier, you can also specify the x-ms-rehydrate-priority of how quickly you want the copy created in the destination hot or cool tier. Please see the Azure Blog rehydration documentation for more information.
All of the features discussed today (upload blob direct to access tier, priority retrieval from archive, and Copy Blob enhancements) are supported by the most recent releases of the Azure Portal, AzCopy, .NET Client Library, Java Client Library, Python Client Library, and Storage Services REST API (version 2019-02-02 or higher). In general, we always recommend using the latest version of our tools and SDKs.
In addition to our first party tools, Archive Storage has an extensive network of partners who can help you discover and retain value from your data. As we improve our service with new features, we're also working to build our ecosystem and onboard additional partners. Please visit the Azure update to see the latest additions to our partner network.
We will continue to improve our Archive and Blob Storage services and are looking forward to hearing your feedback about these features through email. As a reminder, we love hearing all of your ideas and suggestions about Azure Storage, which you can post at Azure Storage feedback forum.
Microsoft 365 Personal and Family subscriptions are now generally available, including robust features for Skype, Office, PowerPoint, Excel, and more.
The post Microsoft 365 helps you and your family connect, work, and learn from home appeared first on Microsoft 365 Blog.
Here’s how some of Microsoft Japan’s customers are adjusting to this new normal.
The post Learning from our customers in Japan appeared first on Microsoft 365 Blog.
I’m Hong Ooi, data scientist with Microsoft Azure Global, and maintainer of the checkpoint package. The checkpoint package makes it easy for you freeze R packages in time, drawing from the daily snapshots of the CRAN repository that have been archived on a daily basis at MRAN since 2014.
Checkpoint has been around for nearly 6 years now, helping R users solve the reproducible research puzzle. In that time, it’s seen many changes, new features, and, inevitably, bug reports. Some of these bugs have been fixed, while others remain outstanding in the too-hard basket.
Many of these issues spring from the fact that it uses only base R functions, in particular install.packages, to do its work. The problem is that install.packages is meant for interactive use, and as an API, is very limited. For starters, it doesn’t return a result to the caller—instead, checkpoint has to capture and parse the printed output to determine whether the installation succeeded. This causes a host of problems, since the printout will vary based on how R is configured. Similarly, install.packages refuses to install a package if it’s in use, which means checkpoint must unload it first—an imperfect and error-prone process at best.
In addition to these, checkpoint’s age means that it has accumulated a significant amount of technical debt over the years. For example, there is still code to handle ancient versions of R that couldn’t use HTTPS, even though the MRAN site (in line with security best practice) now accepts HTTPS connections only.
I’m happy to announce that checkpoint 1.0 is now in beta. This is a major refactoring/rewrite, aimed at solving these problems. The biggest change is to switch to pkgdepends for the backend, replacing the custom-written code using install.packages. This brings the following benefits:
In addition, checkpoint 1.0 features experimental support for a checkpoint.yml manifest file, to specify packages to include or exclude from the checkpoint. You can include packages from sources other than MRAN, such as Bioconductor or Github, or from the local machine; similarly, you can exclude packages which are not publicly distributed (although you’ll still have to ensure that such packages are visible to your checkpointed session).
The overall interface is still much the same. To create a checkpoint, or use an existing one, call the checkpoint() function:
library(checkpoint)
checkpoint("2020-01-01")
This calls out to two other functions, create_checkpoint and use_checkpoint, reflecting the two main objectives of the package. You can also call these functions directly. To revert your session to the way it was before, call uncheckpoint().
One difference to be aware of is that function names and arguments now consistently use snake_case, reflecting the general style seen in the tidyverse and related frameworks. The names of ancillary functions have also been changed, to better reflect their purpose, and the package size has been significantly reduced. See the help files for more information.
There are two main downsides to the change, both due to known issues in the current pkgdepends/pkgcache chain:
r_version argument to create_checkpoint to install binaries intended for a different R version.file:// URL). You must either use the standard MRAN site, or have an actual webserver hosting a mirror of MRAN.It’s anticipated that these will both be fixed before pkgdepends is released to CRAN.
You can get the checkpoint 1.0 beta from GitHub:
remotes::install_github("RevolutionAnalytics/checkpoint")Any comments or feedback will be much appreciated. You can email me directly, or open an issue at the repo.
Deep learning is a subset of machine learning used for tasks such as image classification, object detection, and natural language processing. It uses algorithms known as neural networks to learn and make predictions on image, sound, or text data.
Neural networks learn from experience, just like we do as humans. Similar to how we may try an activity and adjust our actions based on the outcome, these algorithms perform a task repeatedly and tweak various actions or variables each time to improve their results, making them very powerful and intelligent.
We’d love to learn more about your current or prospective usage of deep learning in .NET through the quick 10-minute survey below. Whether you’re already implementing deep learning or just starting to learn about it now, we want to hear from you. We’ll use your feedback to drive the direction of deep learning support in .NET!

The post Help us shape the future of deep learning in .NET appeared first on .NET Blog.
We are pleased to announce that the April 2020 release of the Python Extension for Visual Studio Code is now available. You can download the Python extension from the Marketplace, or install it directly from the extension gallery in Visual Studio Code. If you already have the Python extension installed, you can also get the latest update by restarting Visual Studio Code. You can learn more about Python support in Visual Studio Code in the documentation.
This was a short release where we addressed 43 issues, including ipywidgets support in Jypyter Notebooks and debugger support for Django and Flask auto-reload. You can check the full list of improvements in our changelog.
ipywidgets support has been one of our top requested features on GitHub since the release of Jupyter Notebook support in the Python Extension. Today we’re excited to announce that we now support all ipywidgets (including custom ones) in Jupyter Notebooks in VS Code. This means that you can bring all your favorite interactive plotting libraries such as beakerX, bqplot, and many more, to visualize and interact with data in Notebooks and VS Code!
In the March release of the Python extension, we introduced our new Python debugger, debugpy. We’re happy to announce that it supports live reloading of web applications, such as Django and Flask. Now when you make edits to your application, you don’t need to restart the debugger to get them applied anymore. The web server is automatically reloaded in the same debugging session once the changes are saved.
To try it out, open a web application and add a debug configuration (by clicking on Run > Add Configuration…, or by opening the Run view and clicking on create launch.json file).
Then select the framework used in your web application. In this example, we selected Django.
This will create a launch.json file and add a run/debug configuration to it. To get live reloading working, simply remove the “–no-reload” flag in the args property:
This configuration will now look like this:
      {
            "name": "Python: Django",
            "type": "python",
            "request": "launch",
            "program": "${workspaceFolder}\manage.py",
            "args": [
                "runserver",
            ],
            "django": true
        },
Now when you start debugging (F5), make changes to the application and save them, the server will automatically reload.
We have also added small enhancements and fixed issues requested by users that should improve your experience working with Python in Visual Studio Code. Some notable changes include:
We’re constantly A/B testing new features. If you see something different that was not announced by the team, you may be part of the experiment! To see if you are part of an experiment, you can check the first lines in the Python extension output channel. If you wish to opt-out of A/B testing, you can open the user settings.json file (View > Command Palette… and run Preferences: Open Settings (JSON)) and set the “python.experiments.enabled” setting to false.
Be sure to download the Python extension for Visual Studio Code now to try out the above improvements. If you run into any problems, please file an issue on the Python VS Code GitHub page.
The post Python in Visual Studio Code – April 2020 Release appeared first on Python.
OData Connected Service 0.9.0 has been released and is now available on Visual Studio Marketplace. This release adds the following features and bug fixes:
You can get the extension from Visual Studio Marketplace
Prior to this release, the service metadata would be emitted as a long unwieldy string in the C# or VB proxy class generated on the client. The service metadata will now be emitted to an XML file named Csdl.xml located under ConnectedService<Service Name> directory. Since the service metadata is required when initializing a DataServiceContext, the file is embedded in the assembly during the build process. This ensures that if the executable is moved around or packaged for distribution the file will be loaded as a manifest resource.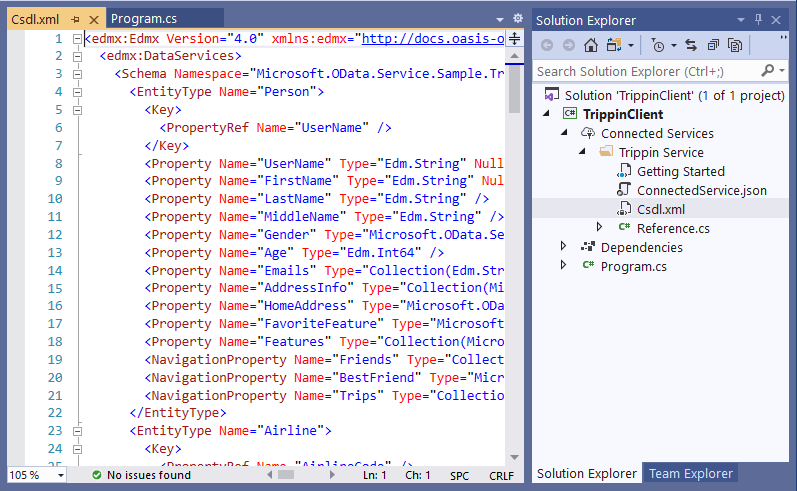
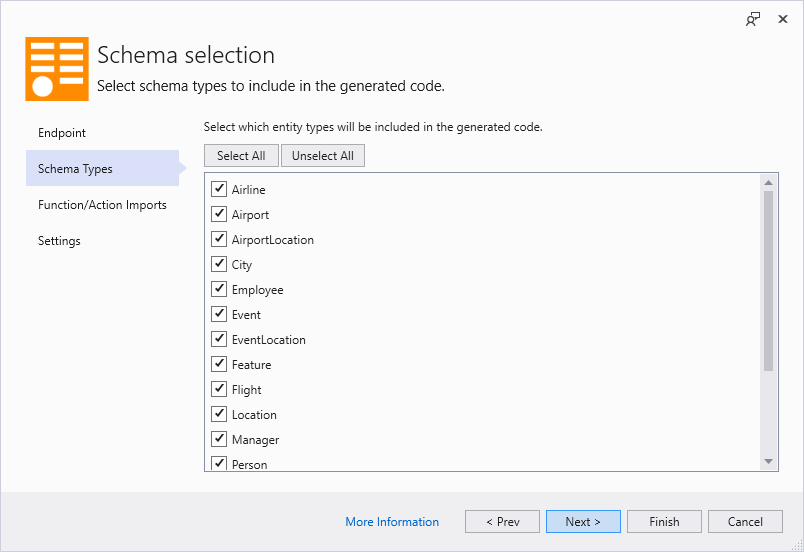
Support for excluding operation imports was introduced in 0.7.0 release. The idea behind that feature was to help you control the size of the generated proxy. In this release, we have enhanced that to support exclusion of schema types – enum, complex and entity types. The user is able to deselect schema types that they do not wish to have emitted on the Connected Service proxy. However, to guarantee that the auto-generated code always builds, if a user deselects a schema type that another selected schema type depends on, the user will be alerted about it and the dependency included automatically. For the same reason, when a user selects a structured type, all its dependencies also get selected automatically.
The post OData Connected Service 0.9.0 Release appeared first on OData.
Exchange-traded financial products—like stocks, treasuries, and currencies—have had the benefit of a tremendous wave of technological innovation in the past 20 years, resulting in more efficient markets, lower transaction costs, and greater transparency to investors.
However, large parts of the capital markets have been left behind. Valuation of instruments composing the massive $500 trillion market in over-the-counter (OTC) derivatives—such as interest rate swaps, credit default swaps, and structured products—lack the same degree of immediate clarity that is enjoyed by their more straightforward siblings.
In times of increased volatility, traders and their managers need to know the impacts of market conditions on a given instrument as the day unfolds to be able to take appropriate action. Reports reflecting the conditions at the previous close of business are only valuable in calm markets and even then, firms with access to fast valuation and risk sensitivity calculations have a substantial edge in the marketplace.
Unlike exchange-traded instruments, where values can be observed each time the instrument trades, values for OTC derivatives need to be computed using complex financial models. The conventional means of accomplishing this is through traditional Monte Carlo—a simple but computationally expensive probabilistic sweep through a range of scenarios and resultant outcomes- or finite-difference analysis.
Banks spend tens of millions of dollars annually to calculate the values of their OTC derivatives portfolios in large, nightly batches. These embarrassingly parallel workloads have evolved directly from the mainframe days to run on on-premise clusters of conventional, CPU-bound workers—delivering a set of results good for a given day.
Using conventional algorithms, real-time pricing, and risk management is out of reach. But as the influence of machine learning extends into production workloads, a compelling pattern is emerging across scenarios and industries reliant on traditional simulation. Once computed, the output of traditional simulation can be used to train DNN models that can then be evaluated in near real-time with the introduction of GPU acceleration.
We recently collaborated with Riskfuel, a startup developing fast derivatives models based on artificial intelligence (AI), to measure the performance gained by running a Riskfuel-accelerated model on the now generally available Azure ND40rs_v2 (NDv2-Series) Virtual Machine instance powered by NVIDIA GPUs against traditional CPU-driven methods.
Riskfuel is pioneering the use of deep neural networks to learn the complex pricing functions used to value OTC derivatives. The financial instrument chosen for our study was the foreign exchange barrier option.
The first stage of this trial consisted of generating a large pool of samples to be used for training data. In this instance, we used conventional CPU-based workers to generate 100,000,000 training samples by repeatedly running the traditional model with inputs covering the entire domain to be approximated by the Riskfuel model. The traditional model took an average of 2250 milliseconds (ms) to generate each valuation. With the traditional model, the valuation time is dependent on the maturity of the trade.
The histogram in Figure 1 shows the distribution of valuation times for a traditional model:
Figure 1: Distribution of valuation times for traditional models.
Once the Riskfuel model is trained, valuing individual trades is much faster with a mean under 3 ms, and is no longer dependent on maturity of the trade:
Figure 2: Riskfuel model demonstrating valuation times with a mean under 3 ms.
These results are for individual valuations and don’t use the massive parallelism that the Azure ND40rs_v2 Virtual Machine can deliver when saturated in a batch inferencing scenario. When called upon to value portfolios of trades, like those found in a typical trading book, the benefits are even greater. In our study, the combination of a Riskfuel-accelerated version of the foreign exchange barrier option model and with an Azure ND40rs_v2 Virtual Machine showed a 20M+ times performance improvement over the traditional model.
In Figure 3 shows the throughput, as measured in valuations per second, of the traditional model running on a non-accelerated Azure Virtual Machine versus the Riskfuel model running on an Azure ND40rs_v2 Virtual Machine (in blue):
Figure 3: Model comparison of traditional model running versus the Riskfuel model.
For portfolios with 32,768 trades, the throughput on an Azure ND40rs_v2 Virtual Machine is 915,000,000 valuations per second, whereas the traditional model running on CPU-based VMs has a throughput of just 32 valuations per second. This is a demonstrated improvement of more than 28,000,000x.
It is critical to point out here that the speedup resulting from the Riskfuel model does not sacrifice accuracy. In addition to being extremely fast, the Riskfuel model effectively matches the results generated by the traditional model, as shown in Figure 4:
Figure 4: Accuracy of Riskfuel model.
These results clearly demonstrate the potential of supplanting traditional on-premises high-performance computing (HPC) simulation workloads with a hybrid approach: using traditional methods in the cloud as a methodology to produce datasets used to train DNNs that can then evaluate the same set of functions in near real-time.
The Azure ND40rs_v2 Virtual Machine is a new addition to the NVIDIA GPU-based family of Azure Virtual Machines. These instances are designed to meet the needs of the most demanding GPU-accelerated AI, machine learning, simulation, and HPC workloads, and the decision to use the Azure ND40rs_v2 Virtual Machine was to take full advantage of the massive floating point performance it offers to achieve the highest batch-oriented performance for inference steps, as well as the greatest possible throughput for model training.
The Azure ND40rs_v2 Virtual Machine is powered by eight NVIDIA V100 Tensor Core GPUs, each with 32 GB of GPU memory, and with NVLink high-speed interconnects. When combined, these GPUs deliver one petaFLOPS of FP16 compute.
Riskfuel’s Founder and CEO, Ryan Ferguson, predicts the combination of Riskfuel accelerated valuation models and NVIDIA GPU-powered VM instances on Azure will transform the OTC market:
“The current market volatility demonstrates the need for real-time valuation and risk management for OTC derivatives. The era of the nightly batch is ending. And it’s not just the blazing fast inferencing of the Azure ND40rs_v2 Virtual Machine that we value so much, but also the model training tasks as well. On this fast GPU instance, we have reduced our training time from 48 hours to under four! The reduced time to train the model coupled with on-demand availability maximizes the productivity of our AI engineering team.”
Scotiabank recently implemented Riskfuel models into their leading-edge derivatives platform already live on the Azure GPU platform with NVIDIA GPU-powered Azure Virtual Machine instances. Karin Bergeron, Managing Director and Head of XVA Trading at Scotiabank, sees the benefits of Scotia’s new platform:
“By migrating to the cloud, we are able to spin up extra VMs if something requires some additional scenario analysis. Previously we didn’t have access to this sort of compute on demand. And obviously the performance improvements are very welcome. This access to compute on demand helps my team deliver better pricing to our customers.”
Shorter meetings. Scheduled social time. So many instant messages. We dug into the data to see how remote work is changing the way we collaborate.
The post How remote work impacts collaboration: findings from our team appeared first on Microsoft 365 Blog.
Since everyone started working remotely, I've personally needed to Remote Desktop into more computers lately than ever before. More this week than in the previous decade.
I wrote recently about to How to remote desktop fullscreen RDP with just SOME of your multiple monitors which is super useful if you have, say, 3 monitors, and you only want to use 2 and 3 for Remote Desktop and reserve #1 for your local machine, email, etc.
IMHO, the Remote Desktop Connection app is woefully old and kinda Windows XP-like in its style.
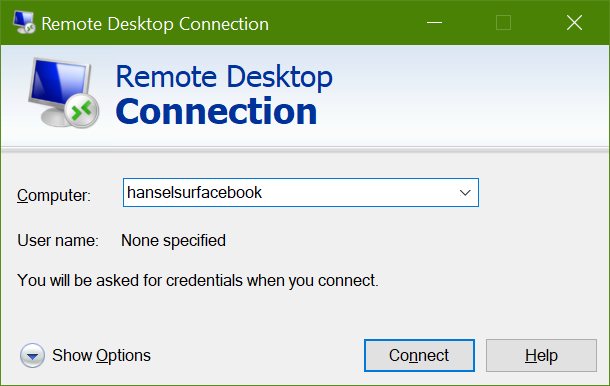
There is a Windows Store Remote Desktop app at https://aka.ms/urdc and even a Remote Desktop Assistant at https://aka.ms/RDSetup that can help set up older machines (earlier than Windows 10 version 1709 (I had no idea this existed!)
The Windows Store version is nicer looking and more modern, but I can't figure out how to get it to Remote into an Azure Active Directory (AzureAD) joined computer. I don't see if it's even possible with the Windows Store app. Let me know if you know how!

So, back to the old Remote Desktop Connection app. Turns out for whatever reason, you need to save the RDP file and open it in a text editor.
Add these two lines at the end (three if you want to save your username, then include the first line there)
username:s:.AzureADYOURNAME@YOURDOMAIN.com

enablecredsspsupport:i:0

authentication level:i:2
Note that you have to use the style .AzureADemail@domain.com
The leading .AzureAD is needed - that was the magic in front of my email for login. Then enablecredsspsupport along with authentication level 2 (settings that aren't exposed in the UI) was the final missing piece.
Add those two lines to the RDP text file and then open it with Remote Desktop Connection and you're set! Again, make sure you have the email prefix.
Given that the client is smart enough to show an error from the remote machine that it's Azure AD enabled, IMHO this should Just Work.
More over, so should the Microsoft Store Remote Desktop client. It's beyond time for a refresh of these apps.
NOTE: Oddly there is another app called the Windows Desktop Client that does some of these things, but not others. It allows you to access machines your administrators have given you access to but doesn't allow you (a Dev or Prosumer) to connect to arbitrary machine. So it's not useful to me.
There needs to be one Ultimate Remote Windows Desktop Client that lets me connect to all flavors of Windows machines from anywhere, is smart about DPI and 4k monitors, remotes my audio optionally, and works for everything from AzureAD to old school Domains.
Between these three apps there's a Venn Diagram of functionality but there's nothing with the Union of them all. Yet.
Until then, I'm editing RDP files which is a bummer, but I'm unblocked, which is awesome.
Sponsor: Couchbase gives developers the power of SQL with the flexibility of JSON. Start using it today for free with technologies including Kubernetes, Java, .NET, JavaScript, Go, and Python.
C++ Build Insights offers more than one way to investigate your C++ build times. In this article, we discuss two methods that you can use to identify bottlenecks in your builds: manually by using the vcperf analysis tool, or programmatically with the C++ Build Insights SDK. We present a case study that shows how to use these tools to speed up the Git for Windows open source project. We hope these tutorials will come in handy when analyzing your own builds.
Getting started with vcperf
vcperf allows you to capture a trace of your build and to view it in the Windows Performance Analyzer (WPA) tool. Follow these steps to get started:
vcperf /start MySessionNamevcperf /stop MySessionName outputFile.etl. This will save a trace of your build in outputFile.etl.If you don’t wish to enroll in the Windows Insider program, another way to obtain a compatible WPA is by following the steps listed on the vcperf GitHub repository’s README page. While you’re there, consider building your own version of vcperf!
Using the Build Explorer view in WPA
The first thing you’ll want to do when first opening your trace in WPA is to open the Build Explorer view. You can do so by dragging it from the Graph Explorer pane to the Analysis window, as shown below.
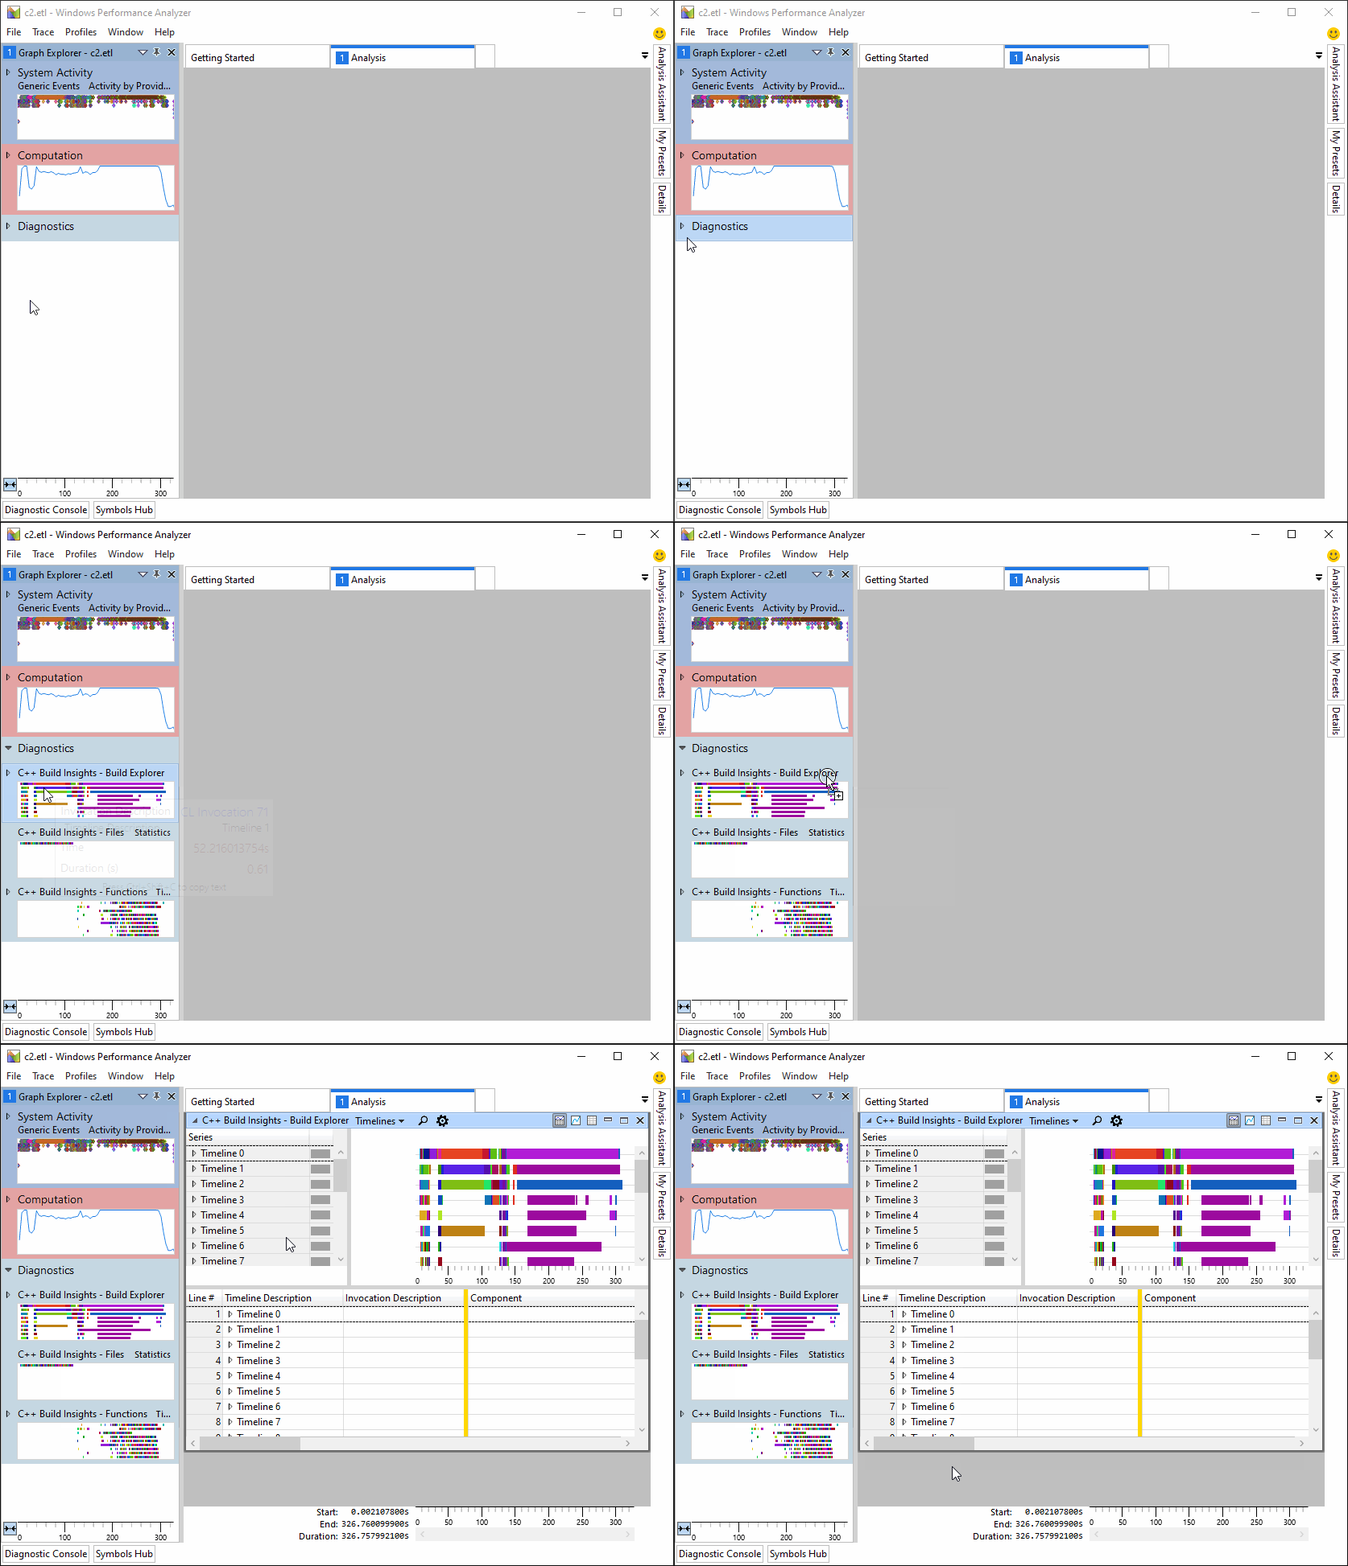
The Build Explorer view offers 4 presets that you can select from when navigating your build trace:
Click on the drop-down menu at the top of the view to select the one you need. This step is illustrated below.
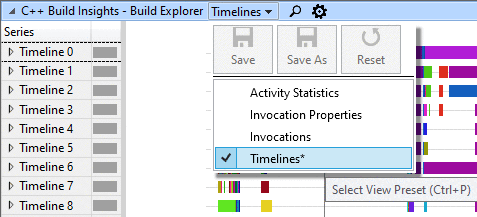
In the next 4 sections, we cover each of these presets in turn.
Preset #1: Timelines
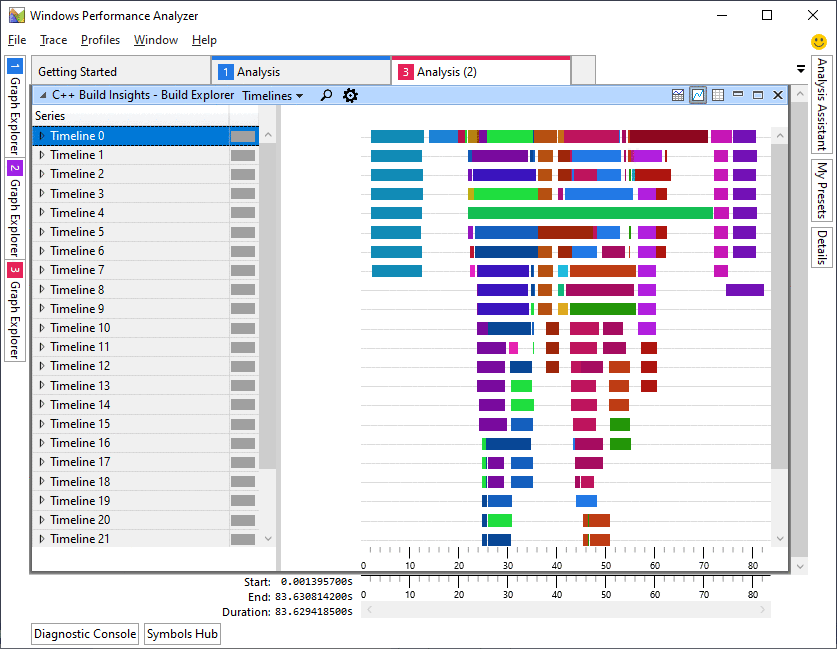
The Timelines preset shows how parallel invocations are laid out in time over the course of your build. Each timeline represents a virtual thread on which work happens. An invocation that does work on multiple threads will occupy multiple timelines.
N.B. Accurate parallelism for code generation is only available starting with Visual Studio 2019 version 16.4. In earlier versions, all code generation for a given compiler or linker invocation is placed on one timeline.
When viewing the Timelines preset, hover over a colored bar to see which invocation it corresponds to. The following image shows what happens when hovering over a bar on the 5th timeline.
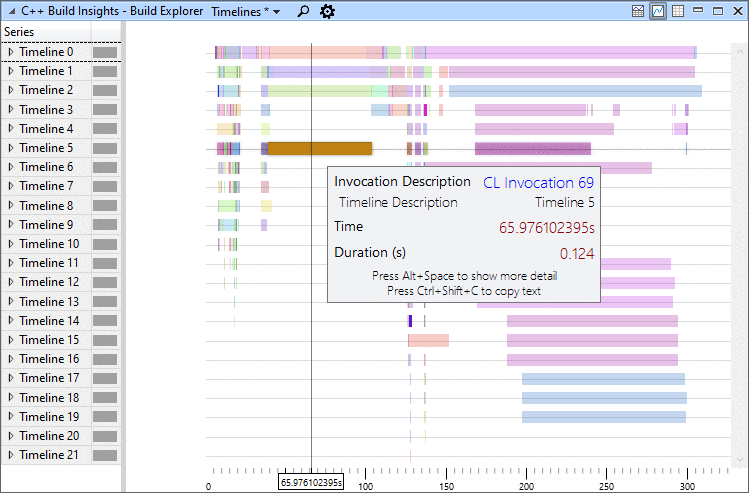
Preset #2: Invocations
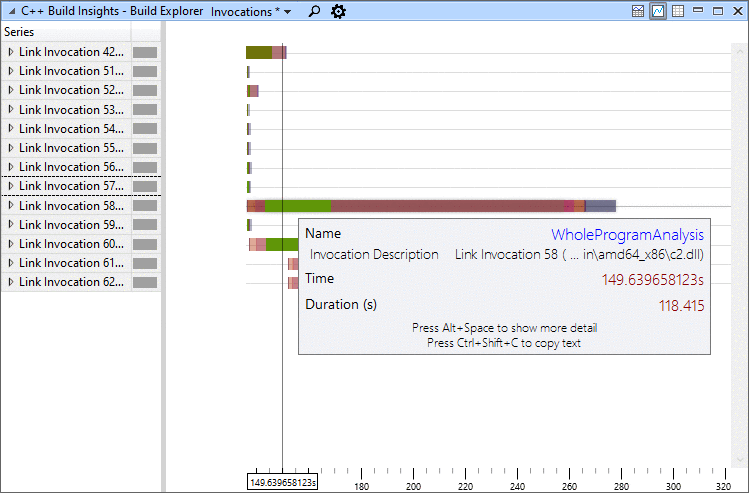
The Invocations preset shows each invocation on its own timeline, regardless of parallelism. It gives a more detailed look into what’s happening within the invocations. With this preset, hovering over a colored bar displays the activity being worked on by an invocation at any point in time. In the example below, we can see that the green bar in Linker 58 corresponds to the whole program analysis activity, a phase of link time code generation. We can also see that the output for Linker 58 was c2.dll.
Preset #3: Invocation Properties
The Invocation Properties preset shows various properties for each invocation in the table at the bottom of the view. Find the invocation you are interested in to see miscellaneous facts about it such as:
N.B. Command line or environment variables are sometimes shown in multiple entries if they are too long.

Preset #4: Activity Statistics
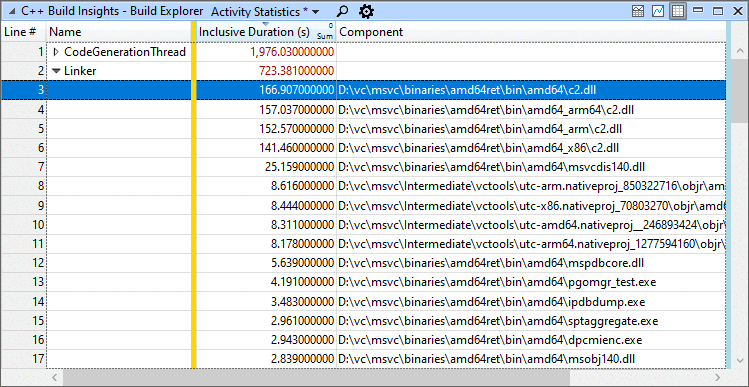
The Activity Statistics preset shows aggregated statistics for all build activities tracked by the Build Explorer view. Use it to learn, for example, the total duration of all linker and compiler invocations, or if your build times are dominated by parsing or code generation. Under this preset, the graph section of the view shows when each activity was active, while the table section shows the aggregated duration totals. Drill down on an activity to see all instances of this activity. The graph, table, and drill-down visuals are show in the sequence of images below. View the official C++ Build Insights event table for a description of each activity.


Putting it all together: a bottleneck case study
In this case study, we use a real open source project from GitHub and show you how we found and fixed a bottleneck.
Use these steps if you would like to follow along:
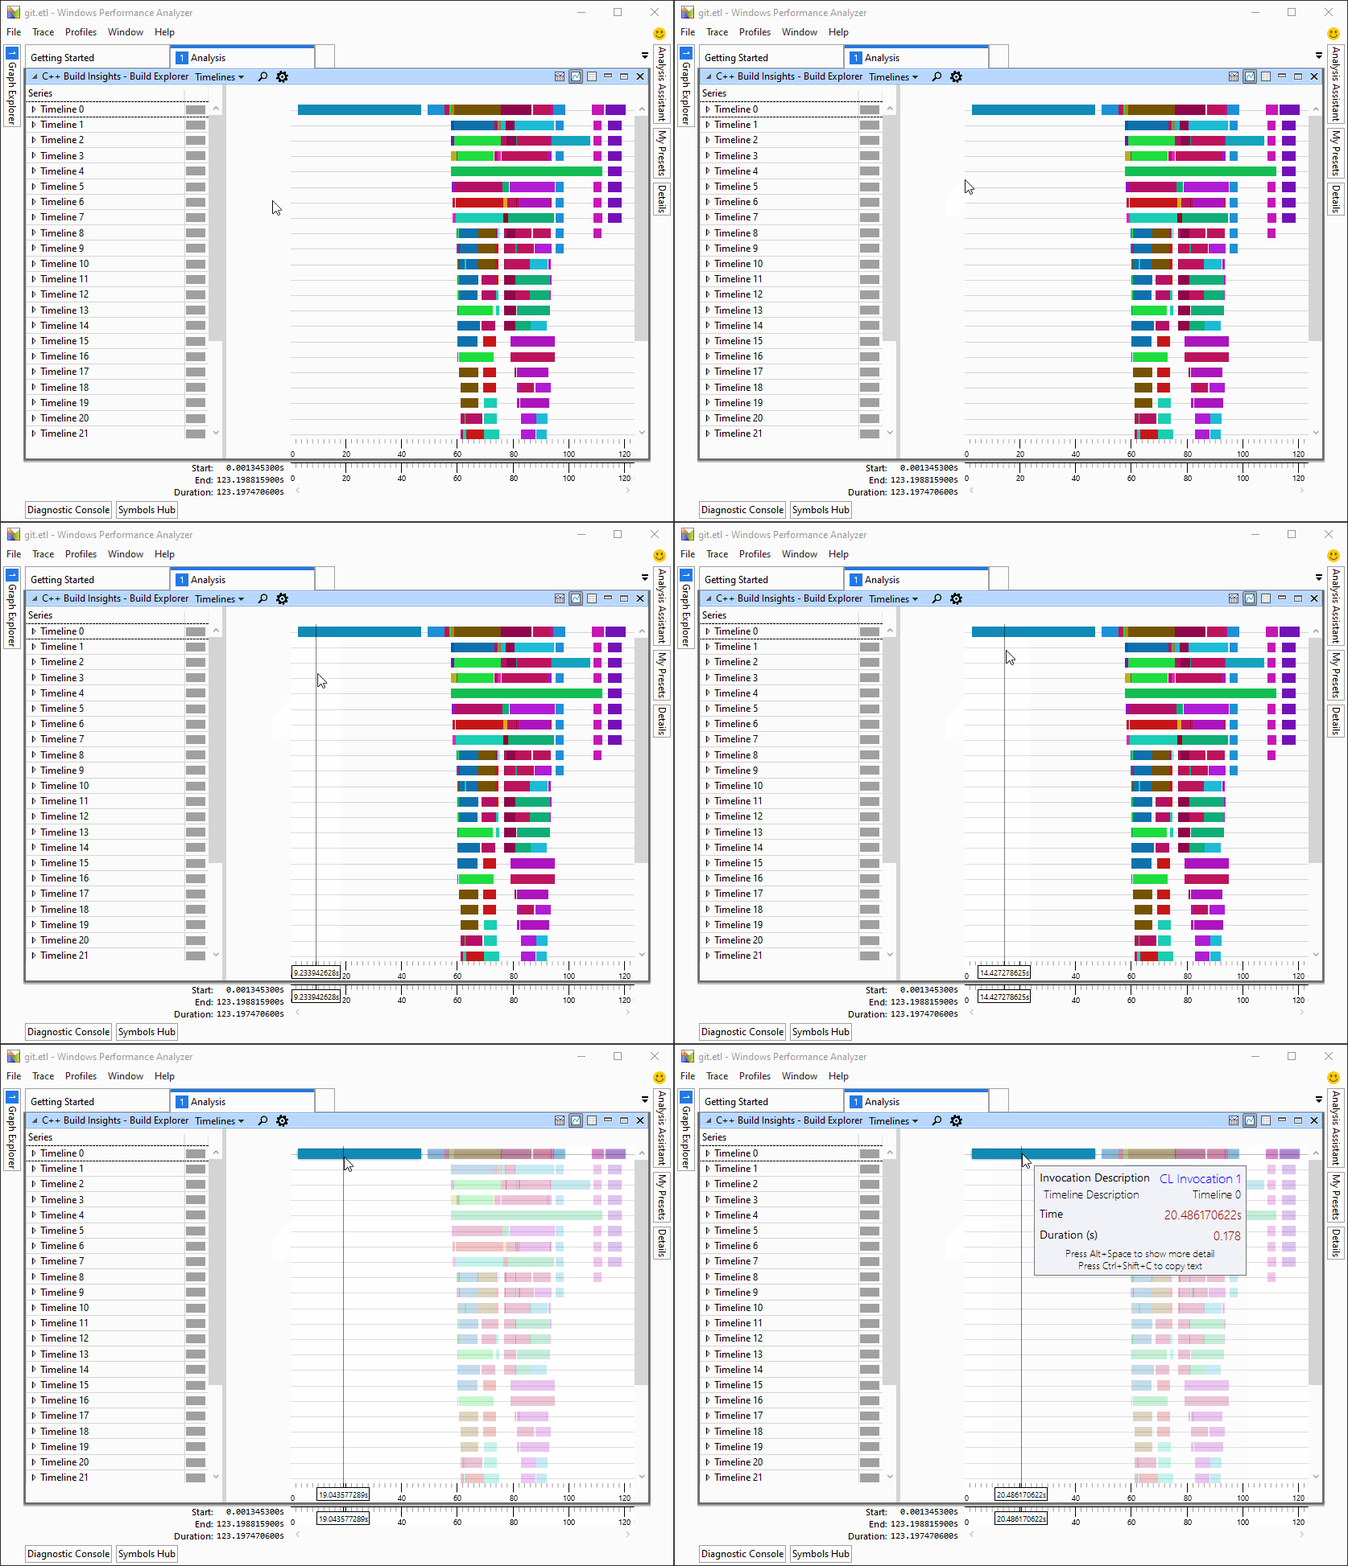
vcperf /start Gitvcperf /stop Git git.etl. This will save a trace of the build in git.etl.We use the Timelines preset of the Build Explorer view, and immediately notice a long-running invocation that seems to be a bottleneck at the beginning of the build.
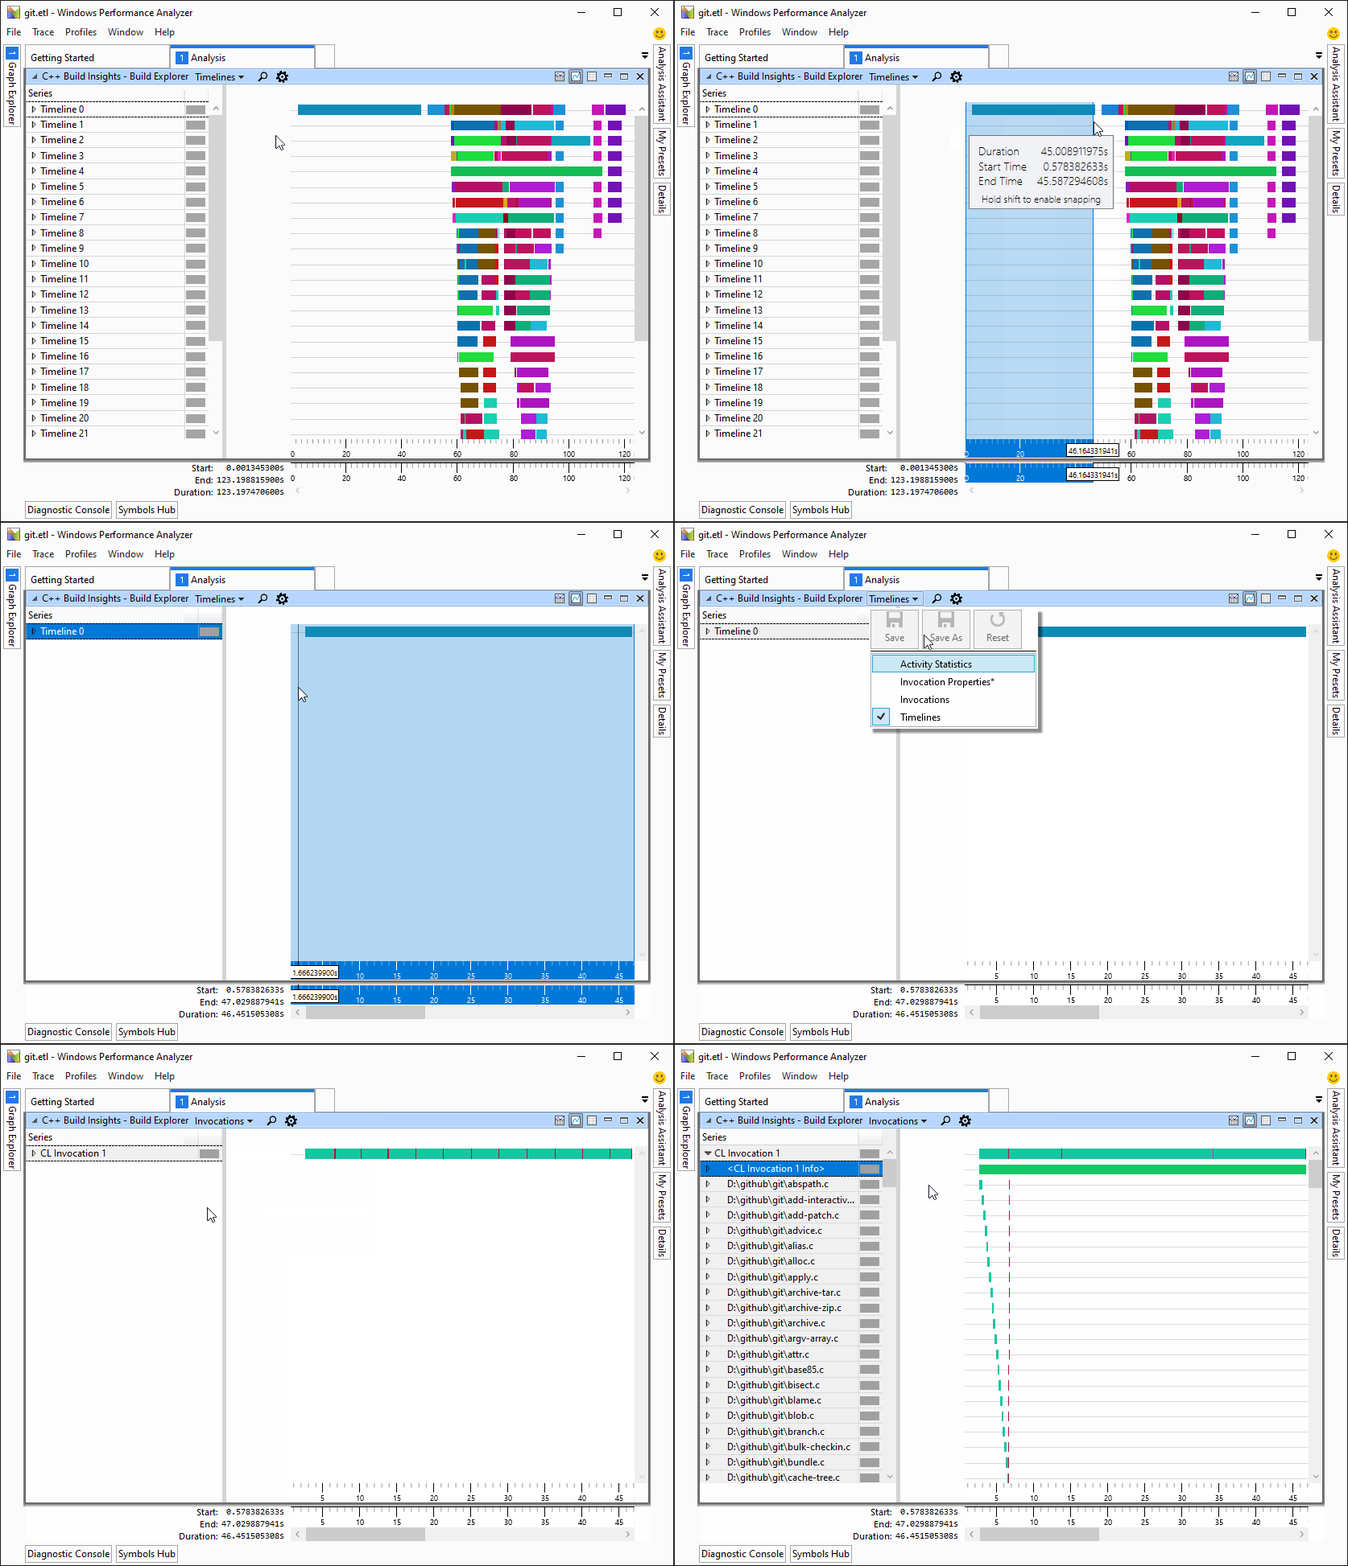
We switch over to the Invocations preset to drill down on that particular invocation. We notice that all files are compiled sequentially. This can be seen by the small teal-colored bars appearing one after the other on the timeline, instead of being stacked one on top of the other.
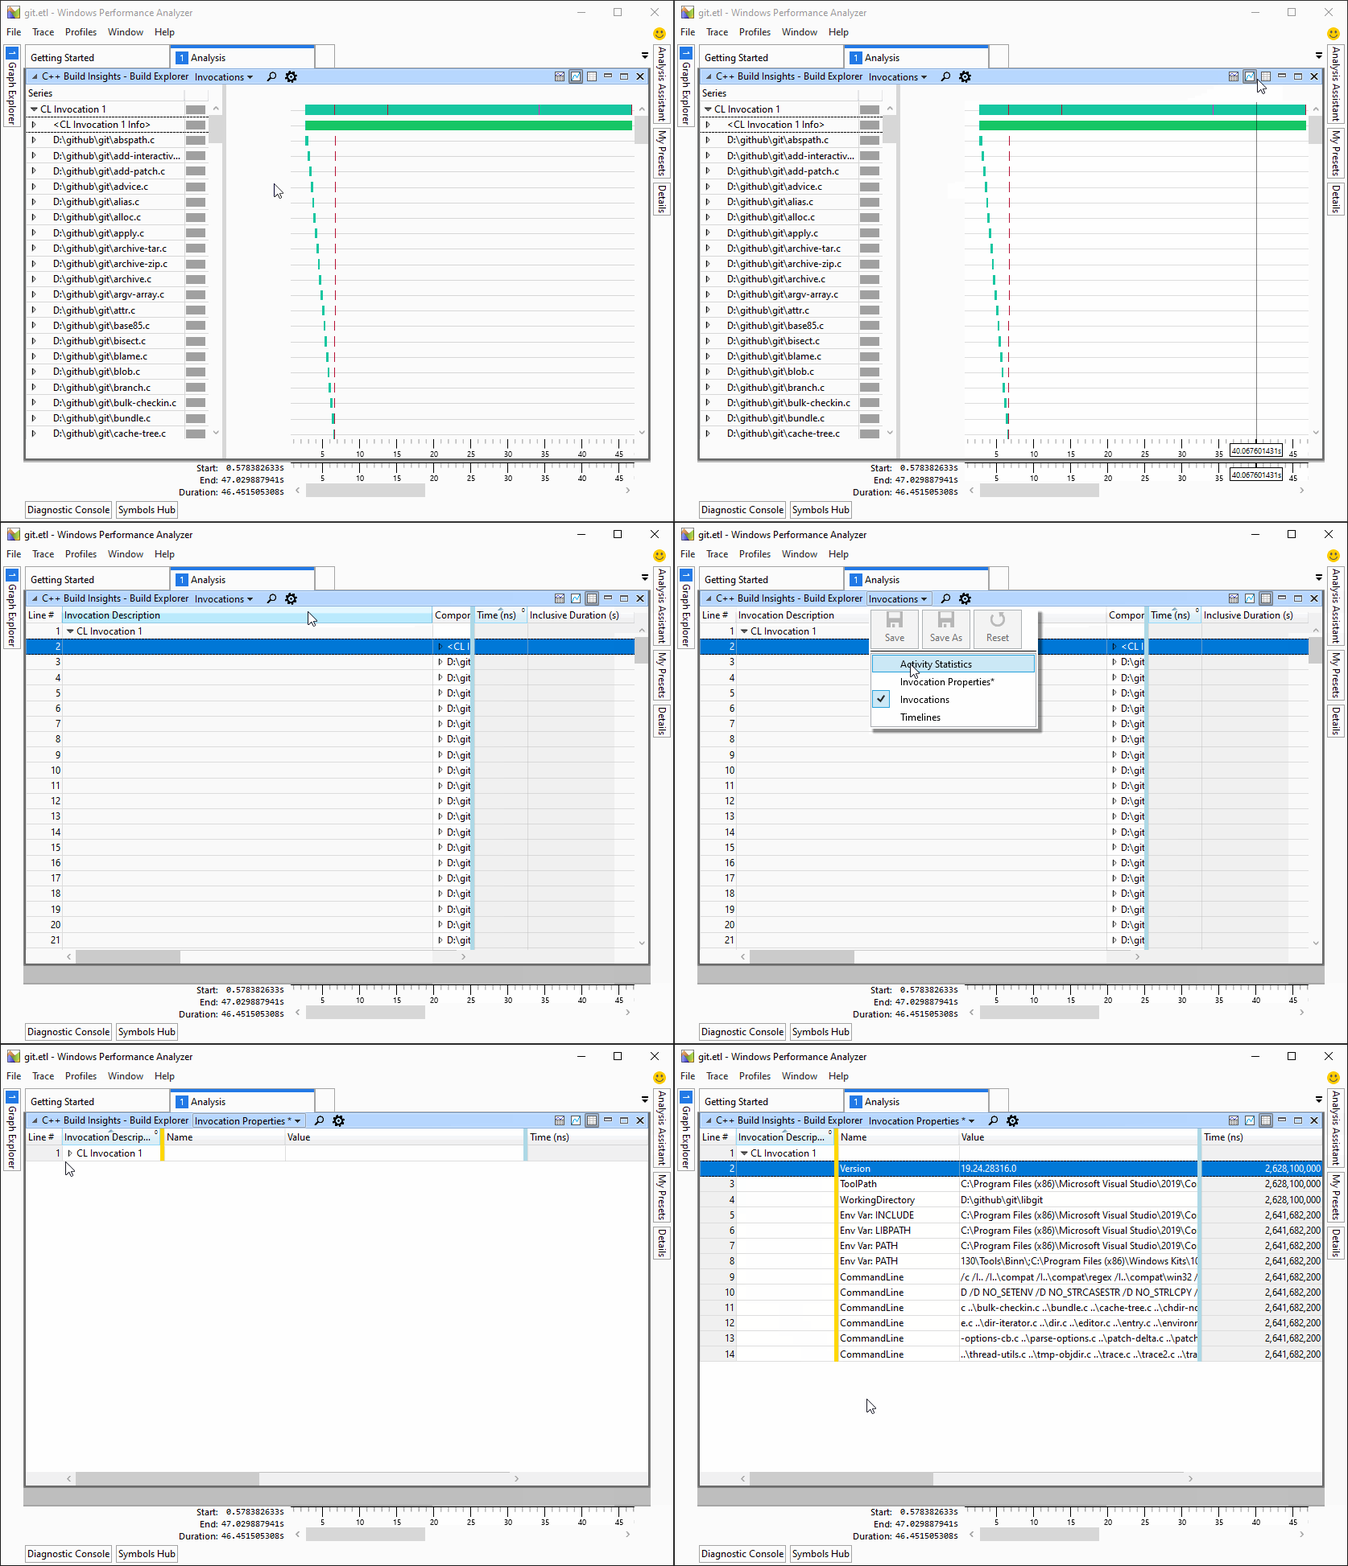
We look at the Invocation Properties for this invocation, and notice that the command line does not have /MP, the flag that enables parallelism in CL invocations. We also notice from the WorkingDirectory property that the project being built is called libgit.
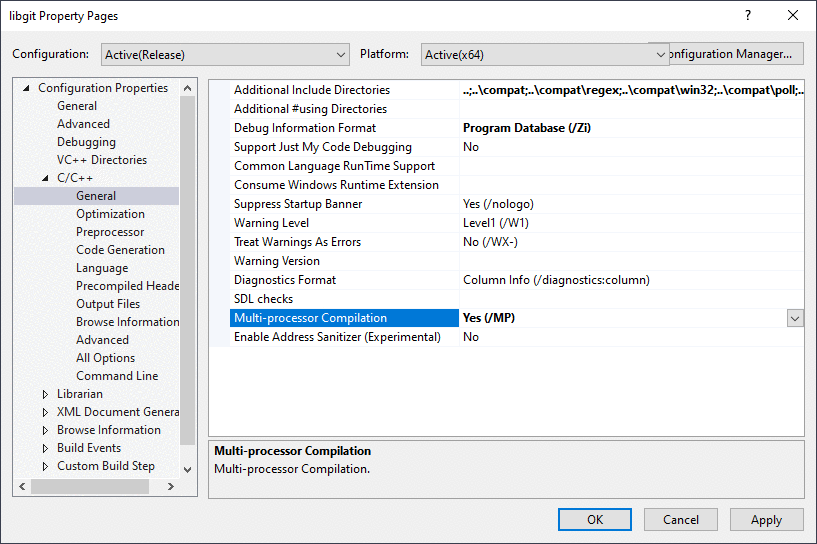
We enable the /MP flag in the properties page for the libgit projet in Visual Studio.
We capture another full build trace using the steps at the beginning of this section to confirm that we mitigated the issue. The build time was reduced from around 120 seconds to 80 seconds, a 33% improvement.
Identifying bottlenecks using the C++ Build Insights SDK
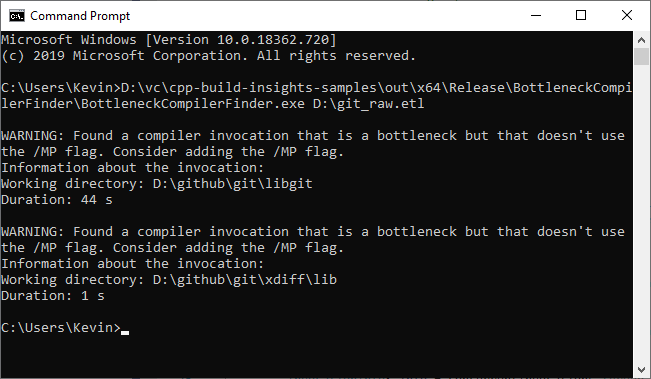
Most analysis tasks performed manually with vcperf and WPA can also be performed programmatically using the C++ Build Insights SDK. To illustrate this point, we’ve prepared the BottleneckCompileFinder SDK sample. It emits a warning when it finds a bottleneck compiler invocation that doesn’t use the /MP switch. An invocation is considered a bottleneck if no other compiler or linker invocation is ever invoked alongside it.
Let’s repeat the Git for Windows case study from the previous section, but this time by using the BottleneckCompileFinder to see what it finds. Use these steps if you want to follow along:
out/{architecture}/{configuration}/BottleneckCompileFinder folder, starting from the root of the repository.As shown below, BottleneckCompileFinder correctly identifies the libgit project and emits a warning. It also identifies one more: xdiff, though this one has a small duration and doesn’t need to be acted upon.
Going over the sample code
We first filter all start activity, stop activity, and simple events by asking the C++ Build Insights SDK to forward what we need to the OnStartInvocation, OnStopInvocation, and OnCompilerCommandLine functions. The name of the functions has no effect on how the C++ Build Insights SDK will filter the events; only their parameters matter.
AnalysisControl OnStartActivity(const EventStack& eventStack)
    override
{
    MatchEventStackInMemberFunction(eventStack, this,
        &BottleneckCompileFinder::OnStartInvocation);

    return AnalysisControl::CONTINUE;
}

AnalysisControl OnStopActivity(const EventStack& eventStack)
    override
{
    MatchEventStackInMemberFunction(eventStack, this,
        &BottleneckCompileFinder::OnStopInvocation);

    return AnalysisControl::CONTINUE;
}

AnalysisControl OnSimpleEvent(const EventStack& eventStack)
    override
{
    MatchEventStackInMemberFunction(eventStack, this,
        &BottleneckCompileFinder::OnCompilerCommandLine);

    return AnalysisControl::CONTINUE;
}
Our OnCompilerCommandLine function keeps track of all compiler invocations that don’t use the /MP flag. This information will be used later to emit a warning about these invocations if they are a bottleneck.
void OnCompilerCommandLine(Compiler cl, CommandLine commandLine)
{
    auto it = concurrentInvocations_.find(cl.EventInstanceId());

    if (it == concurrentInvocations_.end()) {
        return;
    }

    // Keep track of CL invocations that don't use MP so that we can
    // warn the user if this invocation is a bottleneck.

    std::wstring str = commandLine.Value();

    if (str.find(L" /MP ") != std::wstring::npos ||
        str.find(L" -MP ") != std::wstring::npos)
    {
        it->second.UsesParallelFlag = true;
    }
}
Our OnStartInvocation and OnStopInvocation functions keep track of concurrently running invocations by adding them in a hash map on start, and by removing them on stop. As soon as 2 invocations are active at the same time, we consider all others to no longer be bottlenecks. If a compiler invocation is marked a bottleneck once we reach its stop event, it means there never was another invocation that started while it was running. We warn the user if these invocations do not make use of the /MP flag.
void OnStartInvocation(InvocationGroup group)
{
    // We need to match groups because CL can
    // start a linker, and a linker can restart
    // itself. When this happens, the event stack
    // contains the parent invocations in earlier
    // positions.

    // A linker that is spawned by a previous tool is
    // not considered an invocation that runs in
    // parallel with the tool that spawned it.
    if (group.Size() > 1) {
        return;
    }

    // An invocation is speculatively considered a bottleneck
    // if no other invocations are currently running when it starts.
    bool isBottleneck = concurrentInvocations_.empty();

    // If there is already an invocation running, it is no longer
    // considered a bottleneck because we are spawning another one
    // that will run alongside it. Clear its bottleneck flag.
    if (concurrentInvocations_.size() == 1) {
        concurrentInvocations_.begin()->second.IsBottleneck = false;
    }

    InvocationInfo& info = concurrentInvocations_[
        group.Back().EventInstanceId()];

    info.IsBottleneck = isBottleneck;
}

void OnStopInvocation(Invocation invocation)
{
    using namespace std::chrono;

    auto it = concurrentInvocations_.find(invocation.EventInstanceId());

    if (it == concurrentInvocations_.end()) {
        return;
    }

    if (invocation.Type() == Invocation::Type::CL &&
        it->second.IsBottleneck &&
        !it->second.UsesParallelFlag)
    {
        std::cout << std::endl << "WARNING: Found a compiler invocation that is a " <<
            "bottleneck but that doesn't use the /MP flag. Consider adding " <<
            "the /MP flag." << std::endl;

        std::cout << "Information about the invocation:" << std::endl;
        std::wcout << "Working directory: " << invocation.WorkingDirectory() << std::endl;
        std::cout << "Duration: " << duration_cast<seconds>(invocation.Duration()).count() <<
            " s" << std::endl;
    }

    concurrentInvocations_.erase(invocation.EventInstanceId());
}
Tell us what you think!
We hope the information in this article has helped you understand how you can use the Build Explorer view from vcperf and WPA to diagnose bottlenecks in your builds. We also hope that the provided SDK sample helped you build a mental map of how you can translate manual analyses into automated ones.
Give vcperf a try today by downloading the latest version of Visual Studio 2019, or by cloning the tool directly from the vcperf Github repository. Try out the BottleneckCompileFinder sample from this article by cloning the C++ Build Insights samples repository from GitHub, or refer to the official C++ Build Insights SDK documentation to build your own analysis tools.
Have you found bottlenecks in your builds using vcperf or the C++ Build Insights SDK? Let us know in the comments below, on Twitter (@VisualC), or via email at visualcpp@microsoft.com.
The post Finding build bottlenecks with C++ Build Insights appeared first on C++ Team Blog.
In this post we will cover how you can create a .NET Standard library and then share that with other developers via NuGet. We will be demonstrating this with Visual Studio for Mac, but you can also follow along with Visual Studio, or Visual Studio Code when using the dotnet CLI. If you are on macOS, and haven’t already download Visual Studio for Mac you can download it here. We will create a new .NET Standard library from scratch, configure it for NuGet and then publish to nuget.org. The sample library will be a logging package.
When developing your applications, it is common to create some code that you’d like to share with other applications. In cases where the consuming code is near the library code (e.g. in the same repo) you can share the project with a Project Reference. In cases where the consuming code is not near the library or a different team/org needs to consume it, a Project Reference may not be the correct choice. In these cases you can package your library as a NuGet package and then share it using that.
When using NuGet there are different models of how you can share that NuGet package. You can share the library at nuget.org to the entire community or you can create your own NuGet feed so that you can have better control over who has access to your library. For this post we will be using nuget.org. Most of the content of this post will be relevant no matter how you decided to distribute the package. Let’s get started on creating a sample library project.
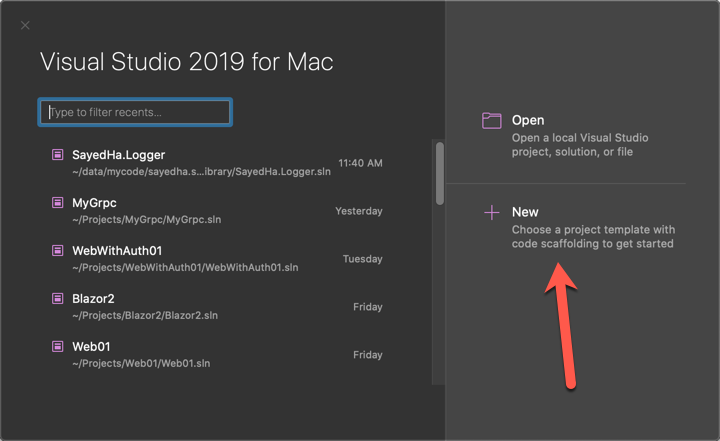
The first thing you’ll do when creating a library is to create a library project that will contain the code. In Visual Studio for Mac you can create a new .NET library project. To do this, after launching Visual Studio for Mac you should see the dialog below, click New to get started.
This will launch the New Project Dialog, shown below. On the left hand side select .NET Core > Library.
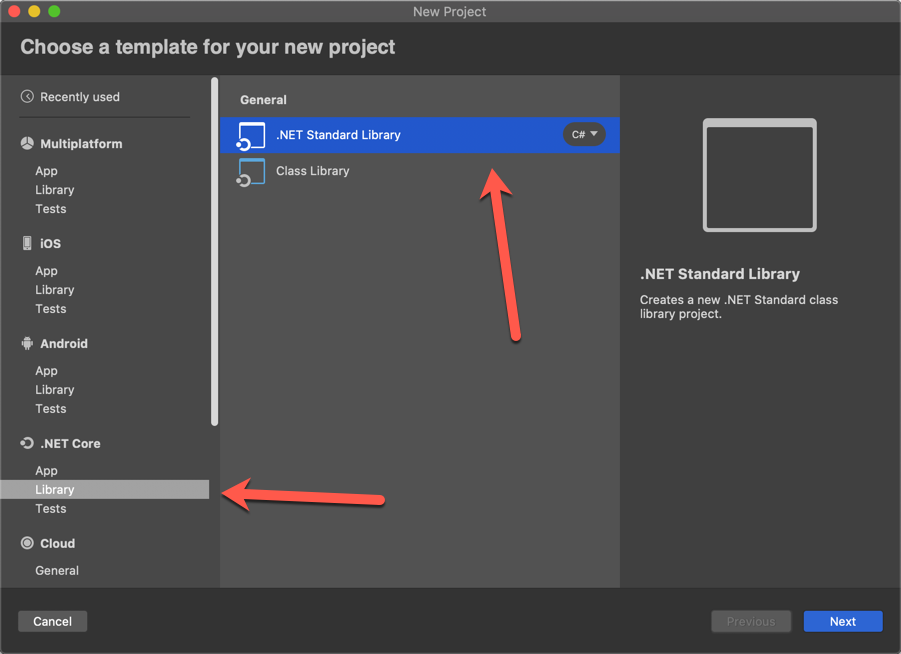
Note: the .NET Core node on the left-hand side of the New Project Dialog is changing to Web and Cloud and will be moved to the top of the list in the next release.
From here you’ll select the .NET Standard template.
A .NET Standard Library is a class library that targets .NET Standard. .NET Standard is a formal specification of .NET APIs that are intended to be available on all .NET implementations. The motivation behind .NET Standard is to establish greater uniformity in the .NET ecosystem.
Click Next to proceed. You’ll be prompted to select the Target Framework. After selecting a Target Framework, or going with the default, click Next. You’ll then be prompted to provide a name and location for the project. In this example I specified SayedHa.Log as the name of the project to create. Click Create after you have supplied those values. When the project, and solution, are created you’ll see the IDE editor open. It should look like the following image.
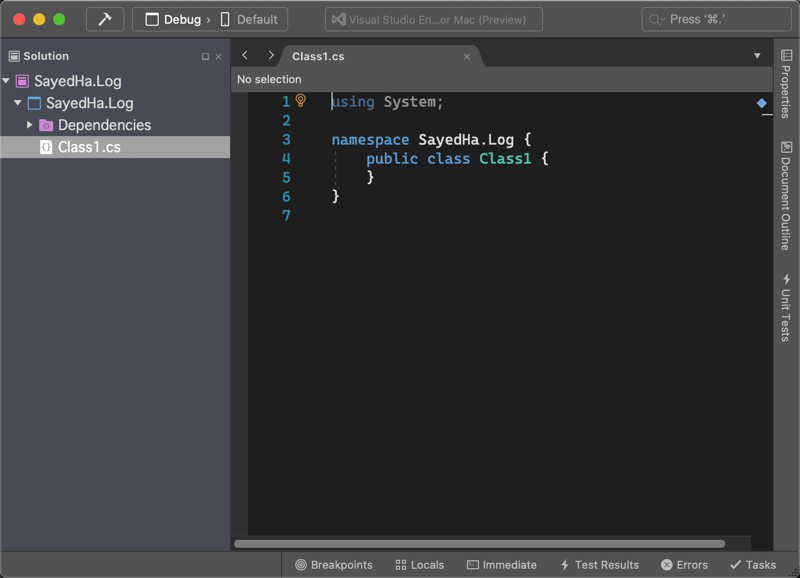
The template will create a class named Class1. You can either rename this file, or simply delete and add a new class with the correct name. I’ll take the latter approach.
To add the new class, right click on the project and select Add > Add Class, give the class the name Logger. You can also use Add > Add File, but you’ll need to select the Empty Class template. Add > Add Class is a shortcut with that template pre-selected. Now we need to add some code to this logger class.
Since this is just an example, the Logger class is going to be very basic. The code for it is below.
using System;
using System.Net.Security;

namespace SayedHa.Log {
    public class Logger {
        private Logger() { }
        public void Debug(object message) { LogIt("Debug", message, null); }
        public void Debug(object message, Exception ex) { LogIt("Debug", message, ex); }

        public void Info(object message) { LogIt("Info", message, null); }
        public void Info(object message, Exception ex) { LogIt("Info", message, ex); }

        public void Error(object message) { LogIt("Error", message, null); }
        public void Error(object message, Exception ex) { LogIt("Error", message, ex); }

        public void Fatal(object message) { LogIt("Fatal", message, null); }
        public void Fatal(object message, Exception ex) { LogIt("Fatal", message, ex); }

        public void Verbose(object message) { LogIt("Verbose", message, null); }
        public void Verbose(object message, Exception ex) { LogIt("Verbose", message, ex); }

        protected void LogIt(string prefix, object message, Exception ex) {
            string formatstr = ex == null ? "{0}:t{1}" : "{0}:t{1}tException:{2}";

            Console.WriteLine(string.Format(formatstr, prefix, message, ex));
        }

        public static Logger GetNewLogger() {
            return new Logger();
        }
    }
}
We have now created the Logger class with the methods that we would like to support. Since we are going to distribute this and it will be used by a variety of apps we should create an interface for this so that we can have more flexibility in the future. To create an interface from this class we can use the Extract Interface feature in Visual Studio for Mac. Put your cursor on the name of the class and then right click and select Quick Fix. See below.
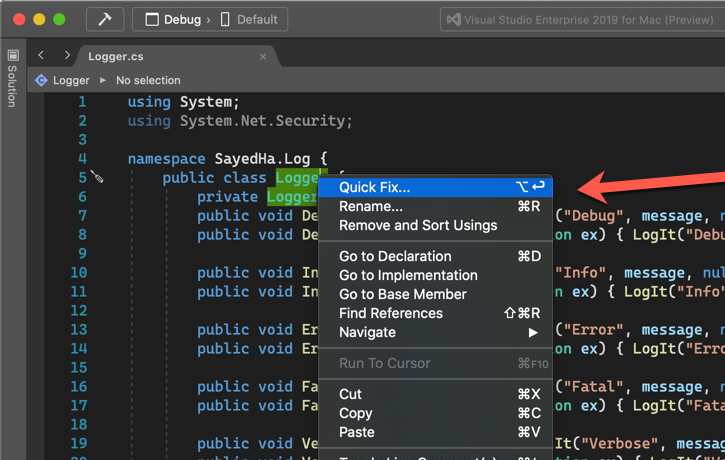
After selecting Quick Fix on the class you’ll be prompted to select the quick fix you’d like to apply. In this case we will use Extract Interface.
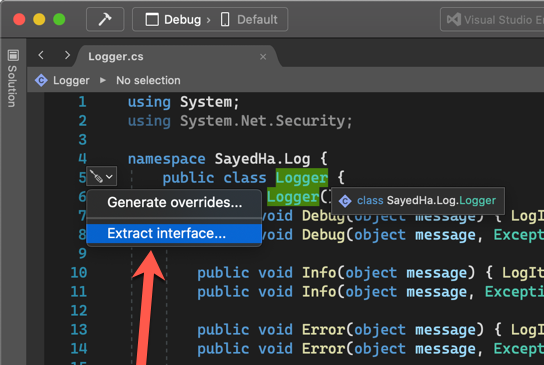
After selecting Extract Interface a dialog will appear in which you can name the new interface and which methods should be included. By default all methods and properties will be included in the interface, and the proposed name of the interface will be the name of your class prefixed with “I”. For this case we will go with the defaults.

Now the interface has been generated, added to the project and the Logger class has been modified to implement that interface. One additional change that I made to the Logger class was to modify the GetLogger static method to return ILogger instead of Logger. We are done with the code portion, so let’s move on to configure this as a NuGet package.
Creating a NuGet package from a .NET Standard Library project is very easy. We will use Pack to create a package from this. You could do this now, but it’s best to add some metadata to the project before distributing it. These properties will be shown in nuget.org, and other NuGet servers. We will add some properties to the project file, the .csproj file. To get started, right click on the project and select Edit Project File.
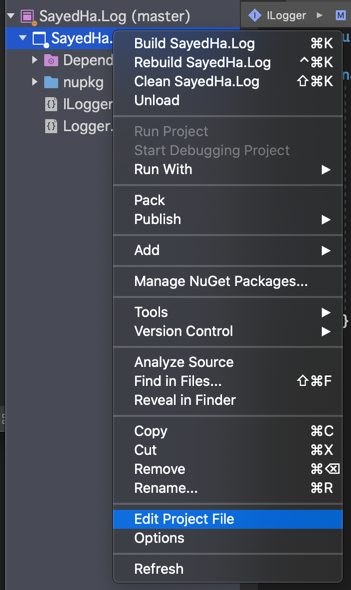
Note: in previous versions of Visual Studio for Mac Edit Project File was nested under Tools in the project context menu.
This will open up the project file for editing. We will add several properties to this file. The final result is shown in the snippet that follows, we will explain the properties after the code.
<Project Sdk="Microsoft.NET.Sdk">

  <PropertyGroup>
    <TargetFramework>netstandard2.0</TargetFramework>
  </PropertyGroup>

 <PropertyGroup>
    <!-- where should the nuget package be created at -->
    <PackageOutputPath>./nupkg</PackageOutputPath>

    <!-- nuget related properties -->
    <Authors>Sayed Ibrahim Hashimi</Authors>
    <Description>Sample library showing how to create a .NET library.</Description>
    <Version>1.0.0</Version>
    <Copyright>Copyright 2020 © Sayed Ibrahim Hashimi. All rights reserved.</Copyright>
    <PackageLicenseExpression>Apache-2.0</PackageLicenseExpression>
    <RepositoryUrl>https://github.com/sayedihashimi/sayedha.samplelibrary</RepositoryUrl>
    <RepositoryType>git</RepositoryType>
    <PackageIconUrl>https://raw.githubusercontent.com/sayedihashimi/sayedha.samplelibrary/master/assets/icon-120x120.png</PackageIconUrl>
    <PackageIcon>icon-120x120.png</PackageIcon>
  </PropertyGroup>
  <ItemGroup>
    <None Include="icon-120x120.png" Pack="true" PackagePath=""/>
  </ItemGroup>
</Project>
These are the properties that I typically set when creating a NuGet package. Descriptions for the properties that I used are below. You can see the full list of NuGet related properties that can be set over at NuGet metadata properties.
| Property name | Description |
| PackageOutputPath | Path to where the .nupkg file should be placed. |
| Authors | Name of the author(s) of the project. |
| Description | Description that will be shown in nuget.org and other places. |
| Version | Version of the NuGet package. For each release to nuget.org this must be unique. |
| Copyright | Copyright declaration. |
| PackageLicenseExpression | An SPDX license identifier or expression. |
| RepositoryUrl | Specifies the URL for the repository where the source code for the package resides and/or from which it’s being built. |
| RepositoryType | Repository type. Examples: git, tfs. |
| PackageIconUrl | URL for the package icon. This property is being deprecated in favor for PackageIcon. For now it is advised to declare both properties for maximum compatibility, see this doc. |
| PackageIcon | Icon to be shown for the package. |
In addition to these properties we also have an item for the Icon.
After adding this content to your project, you can save and close that file. We are now ready to package this an upload it to nuget.org.
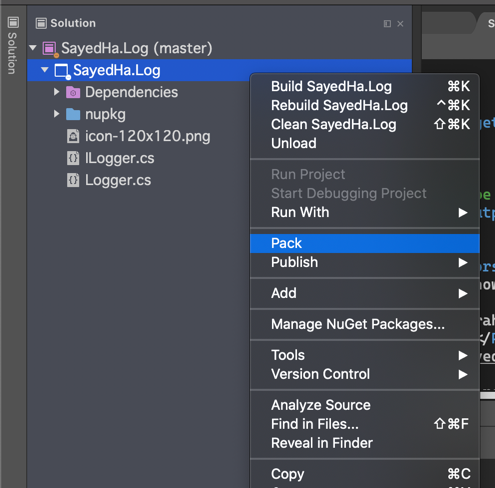
To create the NuGet package, right click on the project in the Solution and select Pack. This will pack your project and put it in the folder specified in the PackageOutputPath property. If you did not set this property, the .nupkg file will be located in a folder under the bin folder. If you are following along using the dotnet CLI execute the dotnet pack command to create the NuGet package.
Now we are ready to publish this to nuget.org. We will briefly go over that here, but for more details you can read more in the docs at Publishing packages. To publish a package to nuget.org, you’ll need to create and account and sign in. After signing in, click on your profile on the top right and select Upload Package.
Yes, Visual Studio for Mac uses the “Pad” term for the equivalent of what Visual Studio (Windows) calls “Tool Windows”. There’s discussion about changing that term to align with Windows, but it’s the correct term at this point.
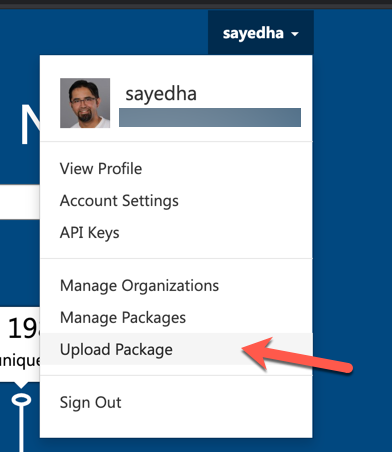
You’ll be prompted to upload the .nupkg file. You can find this file in the nupkg folder under the project. If you have customized the PackageOutputPath project property different from the sample, then the file will be located at the path you specified. After you upload the package, the metadata will be presented. It’s good to carefully verify that there are no errors because you cannot change a package version which has been published. After verifying the info, scroll down to the bottom of the package and click Submit.

Your package has now been published to NuGet. After a few minutes your package will be index and ready to . Now that it has been published users can add this package to their projects to develop against the API. In Visual Studio for Mac, to add a NuGet package first right click the project in the Solution Pad and select Manage NuGet Packages. This will open a dialog that can be used to search and install packages. See the following image.
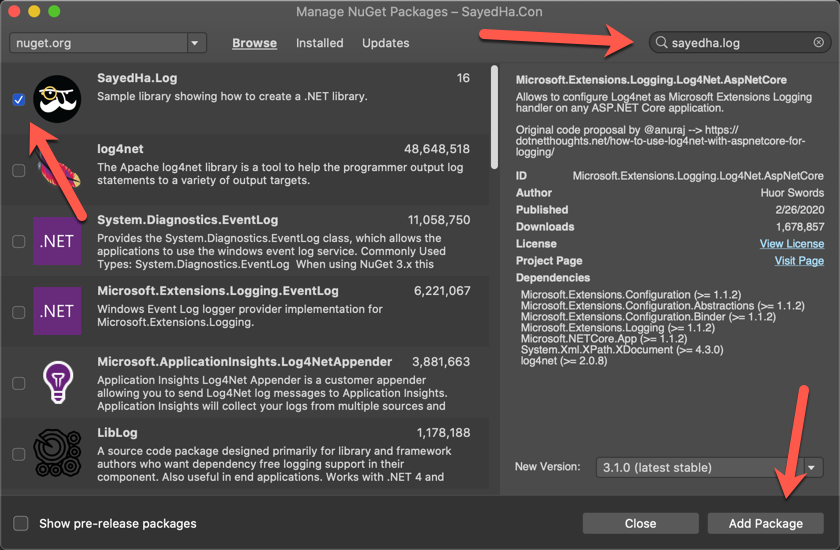
In this search box on the top right search for the package, sayedha.log in this case, then check the checkbox next to the package to install and finally click Add Package. When using Visual Studio the process is similar but with a different UX. When using the command line you can use dotnet add package. In the image below you’ll find some sample code of using the package and the output when running the it.
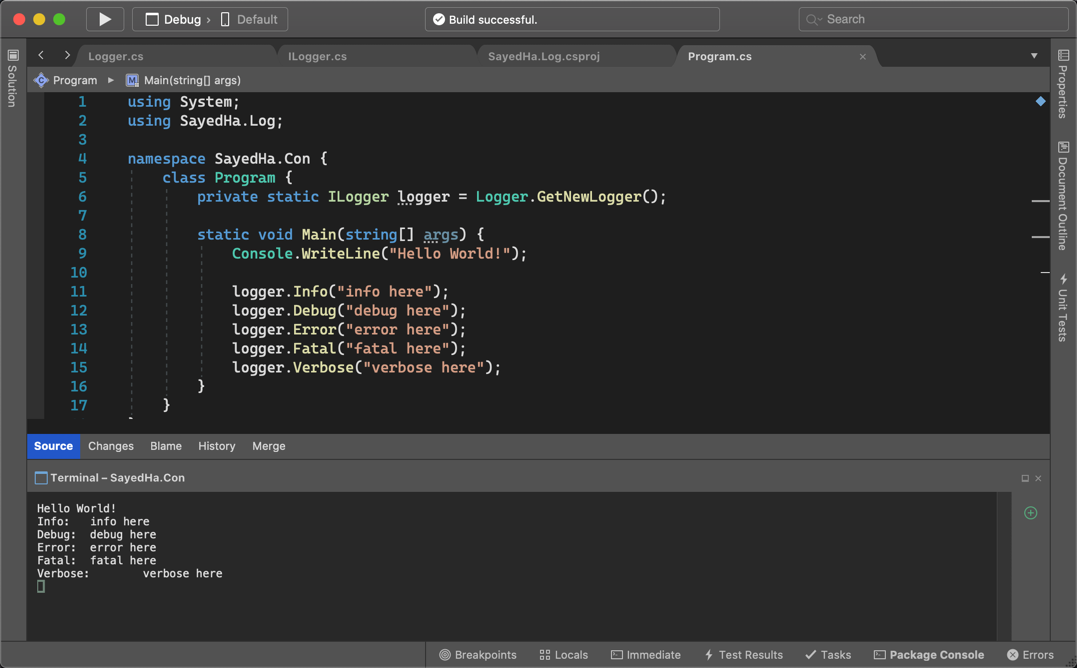
In this post we have created a simple .NET Standard library, modified it to be a NuGet package and published it to nuget.org. This was a very basic library, when creating more realistic libraries there may be additional things to consider. For example, if you want to support multiple frameworks you will need to make some changes. For more details on that see Cross-platform targeting for how to get started with that.
Make sure to follow us on Twitter at @VisualStudioMac and reach out to the team. Customer feedback is important to us and we would love to hear your thoughts. Alternatively, you can head over to Visual Studio Developer Community to track your issues, suggest a feature, ask questions, and find answers from others. We use your feedback to continue to improve Visual Studio 2019 for Mac, so thank you again on behalf of our entire team.
The post Creating and Packaging a .NET Standard library appeared first on Visual Studio Blog.