Quantcast
Channel: Category Name
Viewing all 5971 articles
Browse latest View live

Accelerating digital transformation in manufacturing

$
0
0

Digital transformation in manufacturing has the potential to increase annual global economic value by $4.5 trillion according to the IDC MarketScape.iWith so much upside, manufacturers are looking at how technologies like IoT, machine learning, and artificial intelligence (AI) can be used to optimize supply chains, improve factory performance, accelerate product innovation, and enhance service offerings.

Digital transformation starts by collecting data from machines on the plant floor, assets in the supply chain, or products being used by customers. This data can be combined with other business data and then modeled and analyzed to gain actionable insights.

Manufacturers start by connecting equipment to the cloud.

Let’s take a look at three manufacturers—Festo, Kao, and AkzoNobel—and see how each one is using technologies like IoT, machine learning, and AI to accelerate their digital transformation.

Providing predictive maintenance as a service

Based in Germany, Festo sells electric and pneumatic drive solutions to 300,000 customers in 176 countries. The company’s goal is to increase uptime for customers by providing predictive maintenance offerings as software as a service (SaaS) offerings. Festo’s strategy is to connect machines to the cloud with Azure IoT and then enable customers to visualize data along the entire value chain.

One of the first SaaS offerings is Festo Dashboards built on Azure. Festo Dashboards provides a clear and intuitive status of equipment like sensor temperatures and valve switches. With Festo Dashboards, manufacturers can more easily monitor energy consumption, quickly diagnose faults, and optimize production availability.

Anticipating consumer trends for better manufacturing forecasting

Kao, one of Japan’s leading consumer brands, sees the consumer market evolving. Today, consumers prioritize their product experience over product quality. They also look to social media for purchasing guidance. These behaviors lead to forecasting challenges. To keep up with these changes, Kao sought to better understand individual customers and categorize trends into micro-segments. The company terms this approach “small mass marketing.” Kao designed a data analysis platform using Microsoft Azure Synapse Analytics and Microsoft Power BI to predict consumer trends for their detergent, cosmetic, and toiletry products. The Kao team combined data from real-time purchases, social media, and historical sales. Kao competes more effectively using predictive models, and chain store employees are empowered with real-time information for selling.

Reducing the development time of new paint colors

Dutch paint and coatings leader, AkzoNobel, is active in more than 100 countries. The company has honed the art of color matching for two centuries for cars, buildings, and interiors. One of the company’s businesses is developing the paint to repair cars when drivers have an accident. Manufacturers in the car and other industries constantly dream up new finishes to give their models an edge on the competition.

To keep up with rapid rate of change, AkzoNobel introduced Azure Machine Learning into its color prediction process. Previously, scientists labored painstakingly in labs to adjust, recalibrate, and tweak a color until it was just right. The company worked with its scientist and technicians to integrate machine mearning into their development process. The main impact is seen in the lab, where teams are now able to create more color recipes, more accurately, in less time. Previously, it could take up to two years to get a car color ready. Now AkzoNobel is seeing new paint colors ready in one month.

Data is modeled and analyzed to gain actionable insights.

Next steps

For ideas on accelerating your digital transformation journey download, The Road to Intelligent Manufacturing: Leveraging a Platform, co-authored by Microsoft and Capgemini.


i IDC MarketScape: Worldwide Industrial IoT Platforms in Manufacturing 2019 Vendor Assessment


Next Generation SAP HANA Large Instances with Intel® Optane™ drive lower TCO

$
0
0

At Microsoft Ignite 2019, we announced general availability of the new SAP HANA Large Instances powered by the 2nd Generation Intel Xeon Scalable processors, formally Cascade Lake, supporting Intel® Optane™ persistent memory (PMem).

Microsoft’s largest SAP customers are continuing to consolidate their business functions and growing their footprint. S/4 HANA workloads demand increasingly larger nodes as they scale up. Some scenarios for high availability/disaster recovery (HA/DR) and multi-tier data needs are adding to the complexity of operations.

In partnership with Intel and SAP, we have worked to develop the new HANA Large Instances with Intel Optane PMem offering higher memory density and in-memory data persistence capabilities. Coupled with 2nd Generation Intel Xeon Scalable processors, these instances provide higher performance and higher memory to processor ratio.

For SAP HANA solutions, these new offerings help lower total cost of ownership (TCO), simplify the complex architectures for HA/DR and multi-tier data, and offer 22 times faster reload times. The new HANA large instances extend the broad array of the existing large instances offering with the purpose built capabilities critical for running SAP HANA workloads.

Available now

The new S224 HANA Large Instances support 3 TB to 9 TB of memory with four socket 224 vCPUs. The new instances support both DRAM-only and DRAM plus Intel® Optane™ persistent memory combinations.

SKU list  of Intel Optane persistent memory combinations.

The variety of SKUs gives our customers the ability to choose the best solution for their SAP HANA in-memory workload needs, with higher memory capacity and lower cost as compared to DRAM-only instances. S224 SKUs with a higher core to working memory ratio are performance-optimized for OLAP while higher working memory to core ratio are better priced for OLTP.

The S224 instances with Intel Optane PMem come in 1:1, 1:2, and 1:4 ratios. Each ratio indicates the size of DRAM memory paired with Intel Optane memory. The architecture options available with these offerings are discussed in the next section. The new HANA Large Instances are available in several Azure regions where HANA Large Instances are available.

Key benefits of deploying S224 instances

Platform consolidation

SAP HANA is an in-memory data platform and its hybrid structure for processing both OLTP and OLAP workloads in real-time with low latency is a major benefit for enterprises using SAP HANA. The 2nd Generation Intel Xeon Scalable processors offer 50 percent higher performance and higher memory to processor ratioi  compared to the previous generation processors. Coupled with Intel Optane, the new instances offer even higher memory densities with >3TB per socket.

SAP HANA uses Intel Optane PMem as an extension to DRAM memory by selectively placing the data structures in persistent memory, in a mode called app direct. The column store data which attributes for majority of the data in most HANA systems is enabled for placement in Intel Optane persistent memory where-as working DRAM memory is used for delta merges, row store and cache data.

For organizations with growing data needs, the higher memory densities enable a deployment to scale up or scale out with fewer of the S224 SKU’s (seen in Figure 1) as compared to a larger number of DRAM-only nodes on previous generation processors. This enables organizations to consolidate their platform footprint and reduce operational complexity, realizing reduced TCO.

Platform consolidation with higher memory density nodes from larger scale out to fewer scale up

Figure 1: Platform consolidation with higher memory density nodes from larger scale out to fewer scale up.

Faster reload times

The data stored in the Intel Optane PMem is persistent. This means for SAP HANA deployments using the new instances with Optane PMem, there is no need to load data from disks or slower storage tiers in the event of system reboot. As mentioned previously, SAP HANA leverages app direct mode to store most of the database into Optane persistent memory. When system reboot occurs during upgrades as an example, the data reload time is cut down dramatically, enabling a faster return to normal operations as compared to DRAM-only systems.

In recent testing conducted using two S224 instances, a DRAM-only system running 6 TB of memory, and a system with 9 TB of memory consisting of 3 TB DRAM and 6 TB of Optane PMem in a 1:2 ratio, the data reload time on the Optane system was 22 times faster as compared to the reload time on the DRAM-only system. The load time on the DRAM system post system reboot is around 44 minutes versus 2 minutes on the Optane node.

Internal testing using 3 TB HANA dataset Shows 22x improvement in DB restart times on the new SAP HANA large instances using Intel Optane

Figure 2: Internal testing using 3 TB HANA dataset Shows 22x improvement in DB restart times on the new SAP HANA large instances using Intel Optane.

The faster reload and recovery times may help some deployments to run without HA for non-production workloads with reduced service windows, and remove clustering complexity and downtimes needed for upgrades and/or patches. Each SAP HANA large instance region comes with hot spares to cover the scenario of complete system failure and recover the DB using hot spares.

Lower TCO for HA/DR

The higher memory density offered with the new instances also enable new deployment options available to enterprises for business continuity purposes. The smaller DRAM-only node at the primary site can replicate the data into a larger Intel Optane node offered in 1:2 and 1:4 ratios, with the data preloaded in persistent memory. Higher density Optane node can be used as a dual-purpose node (as seen in Figure 3) for QA testing and also act as primary node in the event of a failover at the primary site, thereby lowering cost by eliminating the need for standalone instances for QA and DR. The data on the larger Optane node is pre-loaded into Optane PMem, which eliminates the need to load the data from disks and cuts the downtime, thus achieving better RTO and RPO times.

Lower TCO with a dual-purpose node at DR site serving the needs for QA/Dev test and DR.

Figure 3: Lower TCO with a dual-purpose node at DR site serving the needs for QA/Dev test and DR.

Similarly, HSR replicated configurations in a scale out S/4 HANA setup can be replicated into a single shared HA Optane node in a 1:4 ratio (as seen in Figure 4), reducing the complexity of managing multiple HA instances, thereby lowering TCO and achieving reduced service windows.

Lower TCO for HA and DR using shared higher memory node for scale out deployments

Figure 4: Lower TCO for HA and DR using shared higher memory node for scale out deployments.

Enabling SAP HANA on Intel Optane

Supported OS versions

Below is the guidance on the supported OS and HANA versions for using Intel Optane persistent memory technology (PMem).

Following OS versions support Intel Optane in App direct mode:

  • RHEL 7.6 or later
  • SLES* 12 SP4 or later
  • SLES 15 or later

SAP HANA support

SAP HANA 2.0 SPS 03 is the first SAP HANA version to support Intel Optane in app direct mode. The recommended version is SAP HANA 2.0 SPS 04 (or a later version) for customers using Optane nodes. SAP HANA can leverage Intel Optane in app direct mode by configuring PMem regions, namespaces, and file system. The HANA large instance operations team will drive the configuration setup before handing over the Optane node to customers.

SAP HANA configuration

SAP HANA needs to recognize the new Intel Optane PMem DIMMs. The directory that SAP HANA uses as base path must mount onto the file system that were created for PMem. SAP HANA SPS04 or a later version is a requirement for Optane usage. Below is the specific command to set up the base path for the PMem volumes:

In the [persistence]section of the global.ini file, provide a line with a comma-separated list of all mounted PMem volumes by running the following command. Following this, SAP HANA recognizes the PMem devices and loads column store data into the modules.

[persistence]
basepath_persistent_memory_volumes=/hana/pmem/nvmem0; /hana/pmem/nvmem1; /hana/pmem/nvmem2; /hana/pmem/nvmem3

Learn more

If you are interested in learning more about the S224 SKUs, please contact your Microsoft account team. To learn more about running SAP solutions on Azure, visit SAP on Azure or download a free SAP on Azure implementation guide.


iIntel Shows 1.59x Performance Improvement in Upcoming Intel Xeon Processor Scalable Family

Remote work trend report: meetings

OData Connected Service v0.8.0 Release

$
0
0

OData Connected Service 0.8.0 has been released and is now available on the Visual Studio Marketplace.

The new version adds the following features:

  1. Add support for loading configuration settings from an existing configuration file
  2. Saving the configuration wizard state when navigating through the pages


  1. Add support for loading configuration settings from an existing configuration file 

There  instances where you want to re-use same configuration settings across multiple projects. Manually supplying the same settings every time you spin up a new project is redundant.

This feature enables one to load code generation values to the OData Connected Service wizard from a json file.

This means that you can either type these values or you can load them from a json file. 

To use this feature:

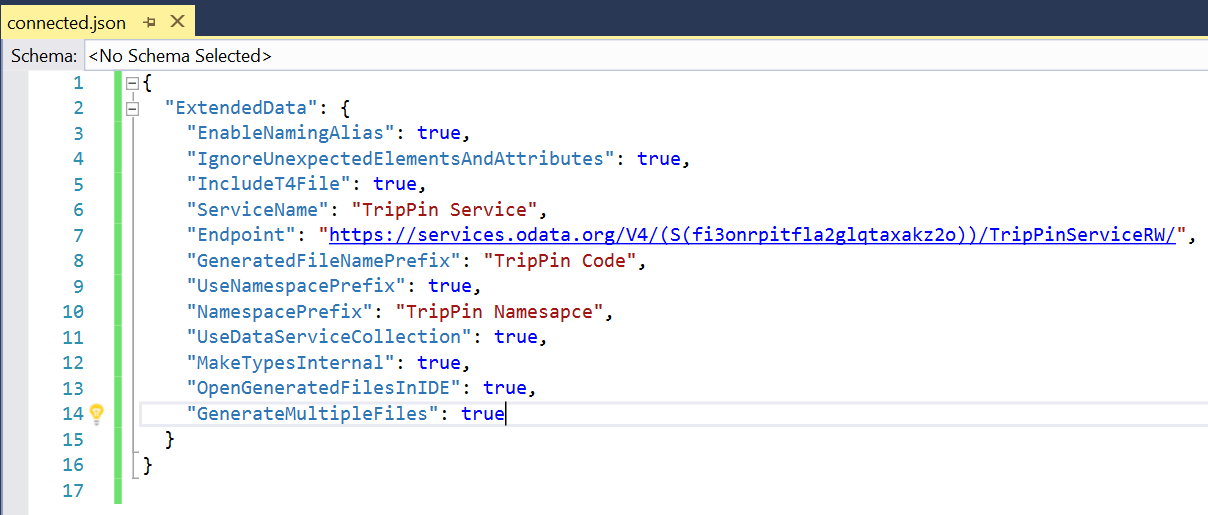
Create a new json file using the following structure and save it to local storage: 

Image connected

If you have OData Connected Service extension installed, 

Right-click on the project you are working on from the Solution Explorer.

Select Add->Connected Service from the context menu.

From the Connected Service Window that opens, select the Microsoft OData Connected Service.

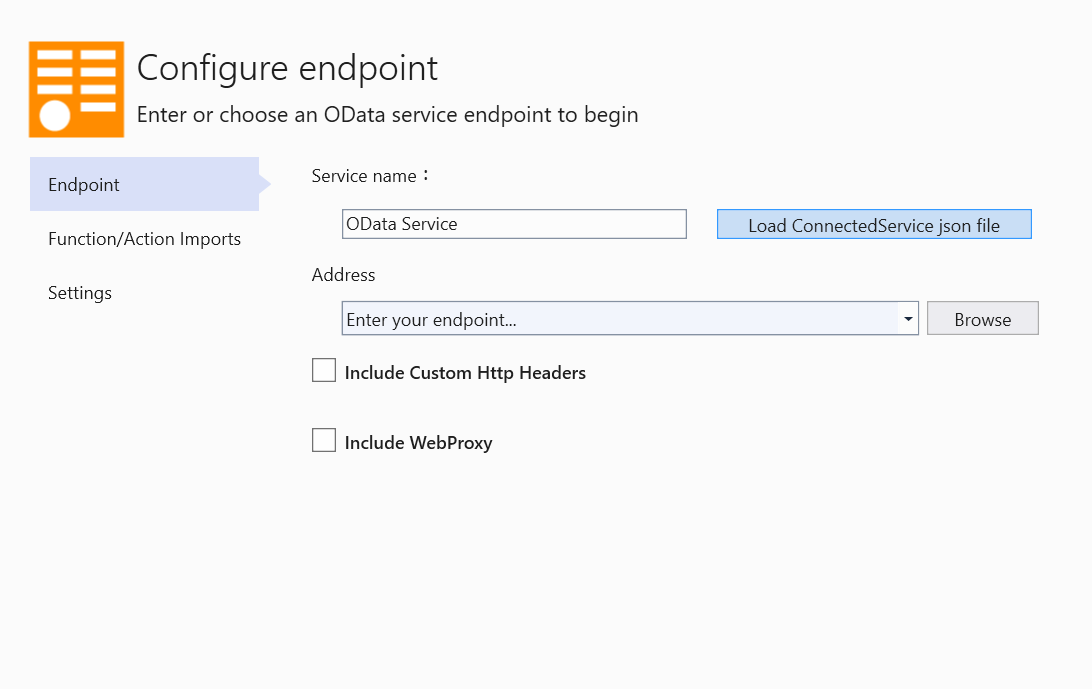
On the wizard window that opens, click on the “Load ConnectedService json file” button to select the json file that you created.

Image load config1

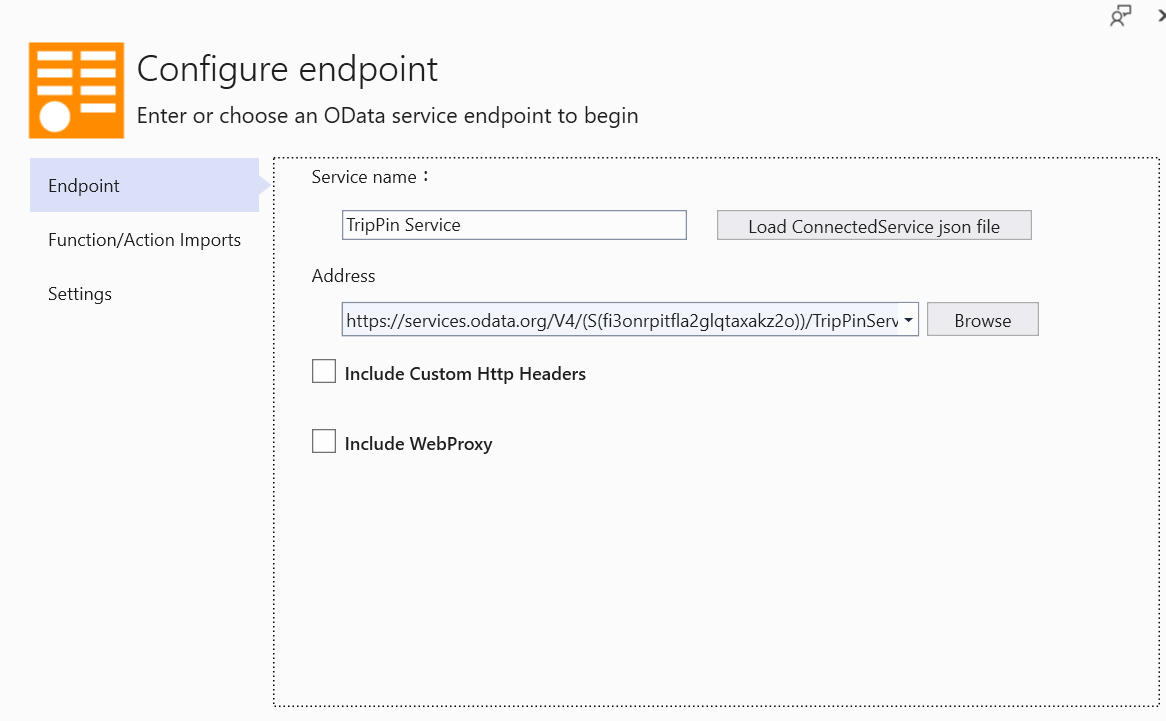
The values from the json file will be populated to the wizard fields.

Image load config2

2. Save the wizard pages state

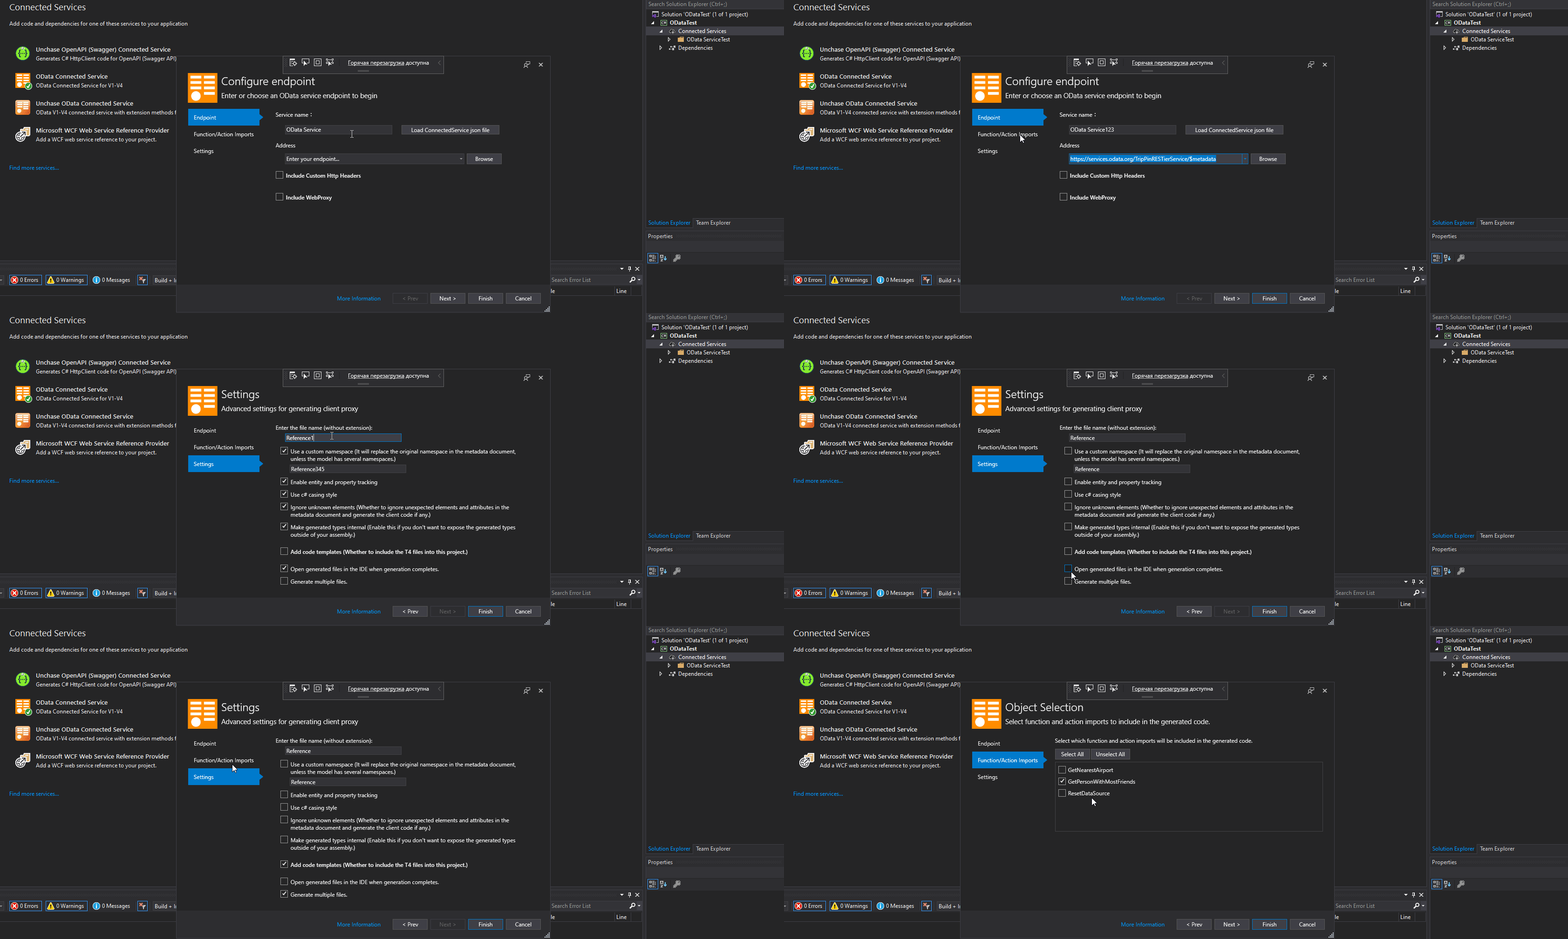
We have added the ability to save the state of the wizard pages when a user navigates from page to page.

We have added the ability to save the state of the wizard pages when a user navigates from page to page.

For example, when the user selects options in the Function/Action imports page then switches to the Settings page, and then decides to go back to the Function/Action imports page, selected options in both pages should persist.

Image 78256983 f1c72a00 7501 11ea 8d1f f1fabc6574dc


The post OData Connected Service v0.8.0 Release appeared first on OData.

Microsoft Receives 2020 SAP® Pinnacle Award: Public and Private Cloud Provider Partner of the Year

$
0
0

SAPI’m pleased to share that SAP recently named Microsoft its Partner of the Year for the 2020 SAP® Pinnacle Award category of Public and Private Cloud Provider. SAP presents these awards annually to the top partners that have excelled in developing and growing their partnership with SAP and helping customers run better. Winners and finalists in multiple categories were chosen based on recommendations from the SAP field, customer feedback and performance indicators.

Microsoft and SAP have a long history of partnership to serve our mutual customers with enterprise-class products, service, and support they rely on to run their most mission-critical business processes. Customers like CONA Services have increased agility and performance to handle over 160,000 sales orders a day by running a 28 TB SAP HANA® system on Azure. Daimler AG reduced operational costs by 50 percent and increased agility by spinning up resources on-demand in 30 minutes with SAP S/4HANA® and Azure, empowering 400,000 global suppliers. Carlsberg modernized its infrastructure and optimized its SAP production landscape by migrating everything, 1,600 TB of data, to Azure within six months.

In October 2019 we deepened this relationship even more by announcing the Embrace initiative, whereby Microsoft and SAP signed a unique go-to-market partnership. As part of this initiative, SAP, Microsoft and our joint partner ecosystem have been working together to give our customers a well-defined path to migrate their SAP ERP to SAP S/4HANA® to the cloud, where they can harness the power of their applications to truly drive innovation. Specifically, our teams have been working on:

  • A simplified migration from on-premises editions of SAP ERP to SAP S/4HANA® for customers with integrated product and industry solutions. Industry market bundles will create a roadmap to the cloud for customers in focused industries, with a singular reference architecture and path to streamline implementation.
  • Collaborative support model for simplified resolution. In response to customer feedback, a combined support model for Azure and SAP Cloud Platform will help ease migration and improve communication.
  • Jointly developed market journeys to support customer needs. Designed in collaboration with SAP, Microsoft and system integrator partners will provide roadmaps to the digital enterprise with recommended solutions and reference architectures for customers. These offer a harmonized approach by industry for products, services, and practices across Microsoft, SAP and system integrators.

The past few months I had the privilege of working even closer with my colleagues in SAP marketing to really make the promise of the Embrace initiative real for our customers. This promise is all about bringing value to accelerate customers’ transformation to the intelligent enterprise. But I am not alone! Sales, marketing, engineering and support teams across the two organizations have been teaming up to make it easier and clearer for customers to build and run their mission-critical SAP solutions on Azure. In these current times of global disruptions and uncertainty, I believe both companies feel a bigger responsibility to help our customers reduce complexity, empower their employees, drive innovation, and run their businesses more efficiently.

SAP and Microsoft have been partners for more than 25 years. In fact, Microsoft is the only cloud provider that’s been running SAP for its own finance, HR and supply chains for the last 20+ years, including SAP S/4HANA®. Our Microsoft IT team will share their experience of migrating and running our SAP business applications in the cloud in this upcoming virtual session on April 22, 2020. Likewise, SAP has chosen Azure to run a growing number of its own internal system landscapes, also including those based on SAP S/4HANA®. Our commitment to work together to deliver a world-class experience for our customers has grown stronger over the years. I truly believe in and see every day how this partnership is taking a more unified approach to accelerate the value customers get in the cloud and open up new opportunities for growth, innovation and business transformation.

Learn more about SAP solutions on Azure.

Bring your own machine to Visual Studio Online

$
0
0

Today Visual Studio Online provides fully-managed, on-demand, ready-to-code development environments in the cloud, but did you know you can also register your own machines and access them remotely from Visual Studio Code or our web editor? This is a great option for developers that want to cloud-connect an already configured work or home machine for anywhere access, or take advantage of the Visual Studio Online developer experience for specialized hardware we don’t currently support. We’ve made several improvements to streamline the self-hosted registration process and expand supported scenarios.

Register your machine with our CLI (Preview)

Previously, registering your machine required you to be able to launch and interact with Visual Studio Code. If you only had SSH access or didn’t want to install and setup RDP, cloud-connecting your machine with Visual Studio Online was simply impossible. With the preview release of our CLI, we’ve expanded our support to include server and headless OS scenarios across macOS, Linux, and Windows. To help get you started quickly, we’ve published our CLI to Homebrew and APT, with chocolatey coming soon.

On Windows:

Install via Powershell by download and executing our script.

On macOS:

brew install microsoft/vsonline/vso

On Linux:

apt install vso

Once you have the CLI installed, run vso start to register your machine.

Updated Registration Experience in Visual Studio Code

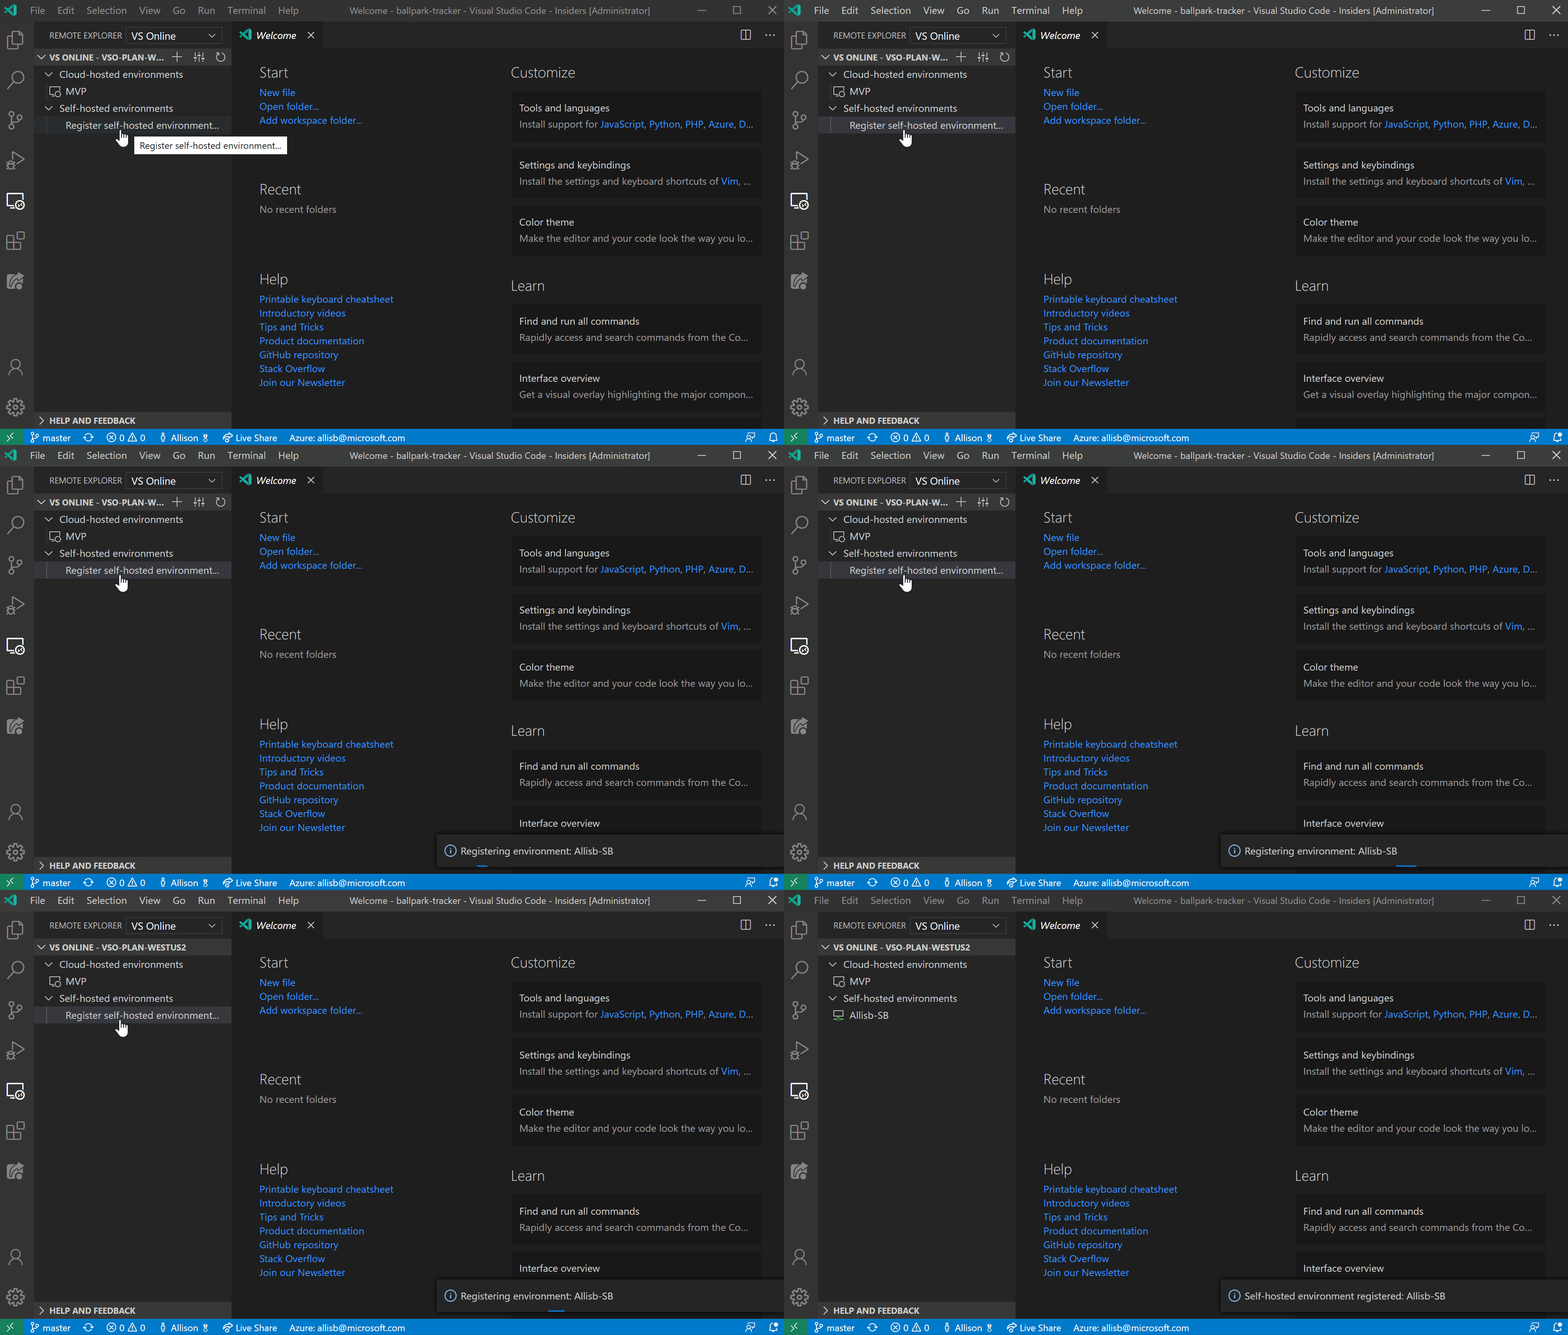
For those of you who prefer using Visual Studio Code to connect your environment, we updated our extension to get you started with just one click! If you don’t have any self-hosted machines, you’ll now find a “Register self-hosted environment…” command in the Visual Studio Online viewlet that will walk you through the steps required to register your environment. You can also still access the registration command via the command palette.

GIF of registering a self-hosted environment in Visual Studio Code
Register a self-hosted environment in Visual Studio Code


Try it today!

Find out more about the CLI in our docs or update your Visual Studio Online extension to try out these improvements today! If you have any feedback or issues, you can always reach us on our GitHub page.

The post Bring your own machine to Visual Studio Online appeared first on Visual Studio Blog.

Enhancing VPN performance to enable remote work

Work flow of diagnosing memory performance issues – Part 1

$
0
0

Work flow of diagnosing memory performance issues – Part 0

In this blog post I’ll talk a bit about contributing to PerfView and then continue with the GCStats analysis. You can skip to the analysis part directly if you like.

One of the frustrating things for me when it comes to tooling is there are a lot of memory perf tools out there but very few are targeting the common types of customers I normally work with. Every tool does the basics; very few do intermediate and advanced analysis. I know folks have complained about the usability of PerfView – and I do think some of the complaints are valid. None the less I love PerfView because it’s often the only tool that can get the job done. I hope folks understand that 1) we have very limited resource for PerfView (we don’t have a whole tooling team like in the Visual Studio org; we have part time from a few individuals) so it’s hard to satisfy nearly all user requests; 2) when it comes to advanced analysis, since it can be so diverse, it naturally means the usability is not going to be as straightforward – when there are so many ways to look at things, the permutation quickly becomes very large.

Contributing to something like PerfView is an excellent way to contribute to .NET core. It doesn’t have as steep of a learning curve as the runtime itself but your contribution could potentially save people a ton of time. You can start by cloning the repo and building it. And then you can step through the code – IMO if you could actually step through the code, this is always the best way to understand something new. The code that affects what I talk about here mostly lives in 2 files – srcTraceEventComputersTraceManagedProcess.cs and srcPerfViewGcStats.cs. If you search for things like Clr.EventName (eg, Clr.GCStart, Clr.GCStop), that’s where the events are analyzed (you don’t have to be concerned with the actual parsing the trace part – that’s handled elsewhere). So the GC analysis done in this file is what we call our GLAD (GC Latency Analysis and Diagnostics) library. And GcStats.cs uses it to display what you see in the GCStats view which is an html file. If you’d like to display the GC related info in your own tools, GCStats.cs would serve as an excellent example how to use GLAD.

Continuing the analysis

In the last post we talked about collecting a GCCollectOnly trace and inspecting the GCStats view in PerfView that’s enabled by the GC events collected. And I should note that you can do this on Linux as well with dotnet-trace. From its doc: one of the built in profiles it offers is what’s equivalent to the /GCCollectOnly arg to PerfView’s collect command:

 --profile

   [omitted]

   gc-collect   Tracks GC collection only at very low overhead

You can collect a trace with dotnet-trace on Linux with this commandline

dotnet trace collect -p <pid> -o <outputpath> --profile gc-collect

and view it on Windows with PerfView. The only difference from the user’s POV when you view the GCStats view is, with the trace collected on Windows you will see all the managed processes whereas the trace collected on Linux only has the process with the pid you specified.

In this blog post I will focus on the tables you see in GCStats. I’m showing an example here. The 1st table for a process is the “GC Rollup By Generation” table –

GC Rollup By Generation
Gen Count Max Pause Max Peak MB Max Alloc MB/sec Total Pause Total Alloc MB Alloc MB/ MSec GC Survived MB/ MSec GC Mean Pause Induced
ALL 130 173.2 13,073.7 1,131.804 4,336.1 167,910.9 38.7 24.686 33.4 0
0 60 51.0 12,992.7 806.553 1,410.8 88,958.3 0.0 23.5 0
1 62 48.3 13,073.7 422.930 1,585.0 77,866.1 0.0 25.6 0
2 8 173.2 12,730.3 1,131.804 1,340.3 1,086.5 0.0 4,169.493 167.5 0

I ignore the Alloc MB/MSec GC and Survived MB/MSec GC columns – they existed before I started working on PerfView and it’d be good to fix these up to have them make more sense but I never got around to.

Now, if you were doing a general analysis, meaning there’s no immediate complaints and you just want to see if there’s anything to improve, you can start with this rollup table.

If we look at the table above, right off the bat we notice that gen2 mean pause is a lot larger than gen0/1 GCs’. We can guess that these gen2s are probably not blocking because the Max Peak MB is around 13GB and if we were to go through all that memory it’s probably going to take more than 167ms. So these are likely BGCs and that’s confirmed by the “Gen 2 for pid: process_name” table below the rollup table (I deleted some columns from the table so it’s not too wide) –

GC Pause Trigger Gen Suspend Pause Peak After Ratio Promoted Gen2 Gen2 Gen2 LOH LOH LOH
Index Start Reason Msec MSec MB MB Peak/After MB MB Survival Frag MB Survival Frag
Rate % % Rate % %
9101 27,487.00 AllocLarge 2B 0.12 161.67 12,015.06 11,955.12 1.01 6,227.54 4,319.97 97 13.19 7,211.27 29 65.91
9118 152,419.36 AllocLarge 2B 0.1 169.81 12,153.84 12,108.31 1 6,245.36 4,319.97 98 12.81 7,213.29 29 66.05
9134 269,587.92 AllocLarge 2B 0.061 165.74 12,730.31 11,772.57 1.08 6,271.16 4,319.97 97 12.35 7,142.26 29 65.67
9150 388,039.73 AllocLarge 2B 0.045 161.05 12,367.15 12,263.51 1.01 6,255.25 4,319.97 97 12.97 7,203.40 29 65.88
9166 490,877.35 AllocLarge 2B 0.047 172.56 12,217.70 12,180.20 1 6,255.52 4,320.00 97 12.57 7,233.93 29 66.02
9183 587,126.19 AllocLarge 2B 0.039 171.76 12,026.77 11,921.34 1.01 6,253.19 4,320.00 97 12.93 7,174.79 29 65.64
9200 688,030.60 AllocLarge 2B 0.132 164.5 12,472.19 12,487.77 1 6,257.01 4,320.00 97 12.86 7,247.72 29 66
9217 789,274.32 AllocLarge 2B 0.066 173.21 12,182.76 12,200.48 1 6,268.88 4,320.00 97 12.84 7,211.30 29 65.63

2B means generation 2 and Background. If you want to see what other combinations there are, simply hover over the column header that says “Gen” and you will see this text:

N=NonConcurrent, B=Background, F=Foreground (while background is running) I=Induced i=InducedNotForced

So for gen2 this could also be 2N, 2NI, 2Ni or 2Bi. If you are using GC.Collect to induce a GC, there’s 2 overloads that take this parameter –

bool blocking

Unless you specify false for this parameter it means the induced GC is always going to be blocking. That’s why there’s no 2BI.

The rollup table always says there’s 0 induced GCs. But if this is not 0, especially if this is a fairly significant number compared to the total number of GCs, it’s always a good idea to figure out who’s inducing these GCs. This is described in this blog entry.

So we know these are all BGCs but for BGC these pauses are very long! Note that I show the pause for BGC as one pause but it really consists of 2 pauses. This picture from the GC MSDN page shows the 2 pauses during one BGC (where the blue arrows are). But the pause time you see in GCStats is the sum of these 2 pauses. The reason was the initial pause is usually very short (the arrows in the picture are merely for illustration purposes – they do not represent how long the time periods actually are). In this case we want to take a look how long each individual pauses are – I’m thinking to just provide the individual BGC pause info in GLAD but before that happens, this is how you can figure out for yourself.

In this blog entry I described the actual event sequence of a BGC. So we are really just looking for the 2 SuspendEE/RestartEE event pairs. To do this you can open the Events view in PerfView and start from the “Pause Start”. Let’s take GC#9217 as an example, its Pause Start is 789,274.32 which you can enter into the “Start” textbox. For Filter type “gc/” to filter to just the GC events, and select the SuspendEE/RestartEE/GCStart/GCStop events and press enter. Below is an example picture of what you would see at this point (I erased the process name for privacy reasons) –

BGC pauses

If you select the timestamp for the 1st SuspendEEStart and the 1st RestartEEStop, this is the 1st pause. We can see the status bar of this view shows you the diff of these 2 timestamps is 75.902. That’s very long – in general the initial pause should be no longer than a couple/few ms. At this point you could basically hand this over to me because this is totally not by design. However, if you are interested to diagnose further on your own, the next step would be to capture a trace with more events to show us what’s going on during this suspension period. Usually we capture a trace with CPU sample events + GC events. The CPU samples showed us clearly what the culprit was which was not actually in GC and was in fact something else in the runtime which we have since fixed and this perf issue only shows up when you have many modules in your process (in this particular case the customer had a few thousand modules).

The 2nd pause for this BGC starts with a SuspendEEStart event whose reason is “SuspendForGCPrep”, different from the 1st SuspendEEStart whose reason is “SuspendForGC”. When suspension is done for GC purpose these are the only 2 possible reasons and the “SuspendForGCPrep” is only used during BGC after the initial pause. Normally there are only 2 pauses in one BGC but if you enable events with the GCHeapSurvivalAndMovementKeyword, you will be adding a 3rd pause during a BGC because in order to fire these events the managed threads have to be pauses. If that’s the case the 3rd pause would also have the “SuspendForGCPrep” reason and is usually much longer than the other 2 pauses because it takes long time to fire events if you have a big heap. I have seen this quite a few times when folks didn’t even need those events were seeing an artificially long pause for BGC due to this exact reason. You might ask why would someone accidently collect these events if they didn’t need them. It’s because these are included in the Default when you collect the runtime events (you can see which keywords Default includes in srcTraceEventParsersClrTraceEventParser.cs, just search for default. And you can see there are many keywords included in Default). In general I think PerfView’s philosophy is the default should collect enough events for you to do all sorts of investigations. And in general this is a good policy as you may not have another repro. But you need to be able to tell what’s caused by collecting the events themselves and what’s due to the product. This of course assumes if you can afford to collect this many events. Sometimes it’s definitely not the case which is why I generally ask folks to start with lightweight tracing to indicate to us whether there is a problem and if so what other events we should collect.

Another thing we notice from the gen2 table is all of the BGCs were triggered by AllocLarge. Possible Trigger reasons are defined as GCReason in srcTraceEventParsersClrTraceEventParser.cs:

public enum GCReason
{
    AllocSmall = 0x0,
    Induced = 0x1,
    LowMemory = 0x2,
    Empty = 0x3,
    AllocLarge = 0x4,
    OutOfSpaceSOH = 0x5,
    OutOfSpaceLOH = 0x6,
    InducedNotForced = 0x7,
    Internal = 0x8,
    InducedLowMemory = 0x9,
    InducedCompacting = 0xa,
    LowMemoryHost = 0xb,
    PMFullGC = 0xc,
    LowMemoryHostBlocking = 0xd
}

The most common reason is AllocSmall which means your allocation on the SOH triggered this GC. AllocLarge means an LOH allocation triggered this GC. In this particular case the team was already aware they were doing a lot of LOH allocations – they just didn’t know they caused BGCs this frequently. If you look at the “Gen2 Survival Rate %” column you’ll notice that the surv rate for gen2 is very high (97%) but the “LOH Survival Rate %” is very low – 29%. This tells us that there are a lot LOH allocations that are fairly long lived.

We do adjust the LOH budget based on the gen2 budget so for cases like this we don’t triggered too many gen2 GCs. If we wanted to have LOH surv rate to be higher we’d need to trigger BGCs more often than this. If you know your LOH allocations are generally temporary a good thing to do is to make the LOH threshold larger via the GCLOHThreshold config.

That’s all for today. Next time we’ll talk more about tables in the GCStats view.


The post Work flow of diagnosing memory performance issues – Part 1 appeared first on .NET Blog.


Updates to Azure Maps Web SDK includes powerful new features

$
0
0

Today, we are announcing updates to the Azure Maps Web SDK, which adds support for common spatial file formats, introduces a new data driven template framework for popups, includes several OGC services, and much more.

Spatial IO module


With as little as three lines of code this module makes it easy to integrate spatial data with the Azure Maps Web SDK. The robust features in this module allow developers to:

  • Read and write common spatial data files to unlock great spatial data that already exists without having to manually convert between file types. Supported file formats include: KML, KMZ, GPX, GeoRSS, GML, GeoJSON, and CSV files containing columns with spatial information.
  • Use new tools for reading and writing Well-Known Text (WKT). Well-Known Text is a standard way to represent spatial geometries as a string and is supported by most GIS systems. (Docs)
  • Connect to Open Geospatial Consortium (OGC) services and integrate with Azure Maps web SDK.
    • Overlay Web Map Services (WMS) and Web Map Tile Services (WMTS) as layers on the map. (Docs)
    • Query data in a Web Feature Service (WFS). (Docs)
  • Overlay complex data sets that contain style information and have them render automatically using minimal code. For example, if your data aligns with the GitHub GeoJSON styling schema, many of these will automatically be used to customize how each shape is rendered. (Docs)
  • Leverage high-speed XML and delimited file reader and writer classes. (Docs)

Try out these features in the sample gallery.

WMS overlay of world geological survey.

WMS overlay of world geological survey.

Popup templates

Popup templates make it easy to create data driven layouts for popups. Templates allow you to define how data should be rendered in a popup. In the simplest case, passing a JSON object of data into a popup template will generate a key value table of the properties in the object. A string with placeholders for properties can be used as a template. Additionally, details about individual properties can be specified to alter how they are rendered. For example, URLs can be displayed as a string, an image, a link to a web page or as a mail-to link. (Docs | Samples)

A popup template displaying data using a template with multiple layouts.

A popup template displaying data using a template with multiple layouts.

Additional Web SDK enhancements

  • Popup auto-anchor—The popup now automatically repositions itself to try and stay within the map view. Previously the popup always opened centered above the position it was anchored to. Now, if the position it is anchored to is near a corner or edge, the popup will adjust the direction it opens so that is stays within the map view. For example, if the anchored position is in the top right corner of the map, the popup would open down and to the left of the position.
  • Drawing tools events and editing—The drawing tools module now exposes events and supports editing of shapes. This is great for triggering post draw scenarios, such as searching within the area the user just drew. Additionally, shapes also support being dragged as a whole. This is useful in several scenarios, such as copying and pasting a shape then dragging it to a new location. (Docs | Samples)
  • Style picker layout options—The style picker now has two layout options. The standard flyout of icons or a list view of all the styles. (Docs | Sample)

Style picker icon layout.

Style picker icon layout.

Code sample gallery

The Azure Maps code sample gallery has grown to well over 200 hundred samples. Nearly every single sample was created as a response to a technical query we had from a developer using Azure Maps.

An Azure Maps Government Cloud sample gallery has also been created and contains all the same samples as the commercial cloud sample gallery, ported over to the government cloud.

Here are a few of the more recently added samples:

The Route along GeoJSON network sample loads a GeoJSON file of line data that represent a network of paths and calculates the shortest path between two points. Drag the pins around on the map to calculate a new path. The network can be any GeoJSON file containing a feature collection of linestrings, such as a transit network, maritime trade routes, or transmission line network. Try the feature out.

Map showing shortest path between points along shipping routes.

Map showing shortest path between points along shipping routes.

The Census group block analysis sample uses census block group data to estimate the population within an area drawn by the user. Not only does it take into consideration the population of each census block group, but also the amount of overlap they have with the drawn area as well. Try the feature out.

Map showing aggregated population data for a drawn area.

Map showing aggregated population data for a drawn area.

The Get current weather at a location sample retrieves the current weather for anywhere the user clicks on the map and displays the details in a nicely formatted popup, complete with weather icon. Try the feature out.

Map showing weather information for Paris.

Map showing weather information for Paris.

Send us your feedback

We always appreciate feedback from the community. Feel free to comment below, post questions to Stack Overflow, or submit feature requests to the Azure Maps Feedback UserVoice.

Nothing can stop a team

Join the Bing Maps Team at Microsoft’s ISV Partner Day

$
0
0

Bing Maps EMEA Distributor, Grey Matter, is holding a live online event for ISVs and developers on April 21 from 9:30 am to 4:30 pm (UK BST). The event will include a keynote from leaders of Microsoft UK and Grey Matter plus six sessions, covering Bing Maps, Azure DevOps, Visual Studio Online, Azure tools and more. Register for the session of your choice and be sure not to miss out on our session led by Justine Coates with the Bing Maps team.

Microsoft mapping, intelligent tools and geospatial services

Speaker: Justine Coates, Senior Program Manager, Microsoft

Date and Time: April 21, 2020 at 3:45 pm – 4:30 pm (UK BST)

Learn how to get started with the Microsoft Bing Maps Platform. Our customers improve business performance with powerful location intelligence and geospatial insights offered through the Bing Maps APIs. There will also be a pre-recorded session available demoing the interactive SDK for our V8 Web Control and also outlining how to get started with Bing Maps.

Register for the Microsoft ISV Partner Day

Full Day Agenda

The live online event will include sessions covering topics including GitHub, Azure DevOps, Visual Studio Online, Azure tools and more. See the full agenda below:

9:30 – 10:00 am Keynote with Joe Macri, Microsoft, and Matthew Whitton, Grey Matter

10:05 – 10:50 am Collaborative Development with GitHub – Richard Erwin, GitHub
GitHub makes it easier for developers to be developers: to work together, to solve challenging problems, and to create the world’s most important technologies. We foster a collaborative community that can come together—as individuals and in teams—to create the future of software and make a difference in the world.

10:55 – 11:40 am Implementing Azure DevOps for continuous delivery and automation – April Edwards, Microsoft
In this session, we’ll start with the basics, discussing the practices of DevOps and then move into discussing automated operations that developers and operations teams can control. We will then deploy a new solution into the cloud using DevOps Project, showing how you can automate the deployment of an application and integrate it into Azure DevOps.

11:50 – 12:35 pm Developing together with Visual Studio Online – Giles Davies, Microsoft
Visual Studio Online (no, not VSTS/Azure DevOps, this is something new reusing the name) provides hosted development environments to make this easier and faster. This session will introduce the new Visual Studio Online and demonstrate how it can be used from Visual Studio Code and the Visual Studio IDE.

14:00 – 14:45 pm Rearchitecting for Azure. A smarter way to deploy – Justin Davies, Microsoft
Adopting the Cloud on its own isn’t enough, you need to know how to harness this enabler to really help you work more quickly and more efficiently at scale. In this session we will go through exactly how you can utilize Azure to achieve your goals faster in a more agile way, to drive business outcomes.

14:50 – 15:35 pm Understanding Azure Data Services and Azure Migration Tools – David Stewart, Grey Matter
Providing an overview of Azure Data Services and showcasing the technical capabilities of Azure assessment and migration tools such as for SQL Server to Azure SQL database.

15:45 – 16:30 pm Microsoft mapping, intelligent tools and geospatial services – Justine Coates, Microsoft
Learn how easy it is to get started with Bing Maps and leverage this worldwide platform for your mapping and location aware scenarios.

We look forward to connecting with you on April 21! To learn more about the Bing Maps APIs portfolio of services, visit https://www.microsoft.com/maps.

- Bing Maps Team

Forecasting Best Practices, from Microsoft

$
0
0

Microsoft has released a GitHub repository to share best practices for time series forecasting. From the repo:

Time series forecasting is one of the most important topics in data science. Almost every business needs to predict the future in order to make better decisions and allocate resources more effectively.

This repository provides examples and best practice guidelines for building forecasting solutions. The goal of this repository is to build a comprehensive set of tools and examples that leverage recent advances in forecasting algorithms to build solutions and operationalize them. Rather than creating implementations from scratch, we draw from existing state-of-the-art libraries and build additional utilities around processing and featurizing the data, optimizing and evaluating models, and scaling up to the cloud.

The repository includes detailed examples of various time series modeling techniques, as Jupyter Notebooks for Python, and R Markdown documents for R. It also includes Python notebooks to fit time series models in the Azure Machine Learning service, and then operationalize the forecasts as a web service.

The R examples demonstrate several techniques for forecasting time series, specifically data on refrigerated orange juice sales from 83 stores (sourced from the the bayesm package). The forecasting techniques vary (mean forecasting with interpolation, ARIMA, exponential smoothing, and additive models), but all make extensive use of the tidyverts suite of packages, which provides "tidy time series forecasting for R". The forecasting methods themselves are explained in detail in the book (readable online) Forecasting: Principles and Practice by Rob J Hyndman and George Athanasopoulos (Monash University).

Juice

You can try out the examples yourself by cloning the repository and knitting the RMarkdown files in R. If you have git installed, a quick and easy way to do this in with RStudio. Choose File > New Project > Version Control > Git, and enter https://github.com/microsoft/forecasting in the Repository URL field. (You might prefer to fork the repository first.)

Gitclone

Open each .Rmd file in turn, accept the prompt to install packages, and click the Knit button to generate the document. The computations can take a while (particularly the Prophet Models example), but if you have a multi-core machine the notebooks do use the parallel package to speed things up. If you don't want to wait, the repository does include HTML versions of the rendered documents. Github doesn't render RMarkdown files, but the rendered HTML files are included in the repository. They're hard to read within GitHub, so to make thing easier I used the trick of creating a gh-pages branch in my fork so I could link to them directly below:

This repository will be updated over time, and contributions are welcome as pull requests to the repository linked below.

GitHub (Microsoft): Forecasting Best Practices

The 2020 Guide to Creating Quality Technical Screencasts, Presentations, and Remote Meetings

$
0
0

Being effective when presenting remotelyI've had a lot of people ask me to write up a guide to creating great technical screencasts. This is an update to my 2011 post on the same topic.

What are you doing? STOP and reassert your assumptions

Hang on. You're doing a screencast or sharing your screen in some way for a meeting, presentation, or YouTube. What does that mean and why did I suggest you stop.

This isn't a stage presentation or even a talk in a conference room. Screencasts and remote meetings have an intimacy to them. You're in someone's ear, in their headphones, you're 18 inches from their face. Consider how you want to be seen, how you want to be heard, and what is on your screen.

Try to apply a level of intentionality and deliberate practice. I'm not saying to micromanage, but I am saying don't just "share your screen." Put your empathy hat on and consider your audience and how it'll look and feel for them.

Initial setup and tools

You can use any number of tools for screen capture. They are largely the same. My preferred tool is Camtasia. Other valid tools are CamStudio (a free and open source tool) and Expression Encoder Screen Capture. You can also use OBS to record your screen and webcam.

When you're using Skype/Zoom/Teams to record live, you're already set as those tools will share for you as well as record.

Windows Look at Feel

At the risk of sounding uptight, how you setup Windows and your environment is the difference between a professional and an amateurish screencast. It's shocking how many folks will start recording a screencast without changing a thing, then wonder why their 1600x1200 screencast looks bad on YouTube at 360p or low bandwidth on a phone. If you find yourself doing screencasts a lot, considering making a custom user (maybe named Screencast?) on your machine with these settings already applied. That way you can login as Screencast and your settings will stick.

Resolution and Aspect

First, decide on your aspect ratio. Your laptop may have a ratio of width to height that is 3:2 or 4:3 but MOST people have a 16:9 Widescreen system? A VERY safe resolution in 2020 is 1280x720 (also known as 720p). That means that you'll be visible on everything from a low-end Android, any tablet, up to a desktop.

That said, statistics show that many folks now have 1920x1080 (1080p) capable systems. But again, consider your audience. If I was presenting to a rural school district, I'd use 720 or a lower resolution. It will be smoother and use less bandwidth and you'll never have issue with things being too small. If I was presenting in a professional environment I'd use 1080p. I don't present at 4k, especially if the audience is overseas from where I am. You're pushing millions of pixels that aren't needed, slowing your message and adding no additional value.

On Windows, consider your scale factor. At 1080p, 125% DPI is reasonable. At 720p (or 1366x768, using 100% scaling is reasonable).

Background Wallpaper and Icons

Choose a standard looking background photo. I prefer to use one from http://unsplash.com or the defaults that come with Windows 10 or your Mac. Avoid complex backgrounds as they don't compress well during encoding. Avoid using pictures of your kids or family unless it feeds your spirit and you don't mind mixing the professional and personal. Again - be intentional. I am neither for nor against - just be conscious and decide. Don't just accept the defaults.

Hide your desktop icons. Right click your desktop and hit View | Show Desktop Items. Also consider whether we need to see your desktop at all. If it doesn’t add value, don’t show it on the screencast.

Fonts

Try to use standard fonts and themes. While your preferred font and colors/themes offer personality, they can be distracting. Consider the message you want to present.

If you're using Visual Studio or Visual Studio Code, remember that your audience likely hasn't changed their defaults, and if you show them something fancy, they'll be thinking about how they get that fancy widget rather than your content. In Visual Studio proper, go to Tools | Options | Environment | Fonts and Colors and click "Use Defaults."

In all your text editors, consider change your fonts to Consolas Size 15. It may seem counter-intuitive to have such large fonts but in fact this will make your code viewable even on an iPhone or Tablet. 

Remember, most video sites, including YouTube, restrict the embedded video player size to a maximum of around 560p height, unless you go full-screen or use a pop-out. Use the font size recommended here, and use Camtasia’s zoom and highlight features during editing to call out key bits of code.

Don’t highlight code in the editor by selecting it with the mouse UNLESS you've deliberately change the selection background color. Defaults are typically hard to read editor selections in video. Instead, zoom and highlight in post production, or use ZoomIt and practice zooming and emphasizing on screen elements.

Browser Setup

Unless your screencast is about using different browsers, pick a browser and stick to it. Hide your toolbars, clear your cache, history, and your autocomplete history. You'd be surprised how many inappropriate sites and autocomplete suggestions are published on the web forever and not noticed until it's too late. Don't view pr0n on your screencast machine. Be aware.

Toolbars

Your browser shouldn't show any, and this is a good time to uninstall or hide whatever coupon-offering nonsense or McAffee pixel waster that you've stopped being able to see after all these years. Remember, default is the word of the day. Disable any Browser Extensions that aren't adding value.

If you are using Visual Studio or an IDE (Eclipse, Photoshop, etc) be aware of your toolbars. If you have made extensive customizations to your toolbars and you use them in the screencast, you are doing a great disservice to your audience. Put things to the default. If you use hotkeys, tell the audience, and use them for a reason.

Toast

You've got mail! Yay. Yes, but not during your screencast. Turn off Outlook Gmail, GChat, Twitter, Messenger, Skype, and anything else that can "pop toast" during your screencast.

Clock and Notifications

Go to Start on Windows 10, and search for System Icons and turn off the Clock temporarily. Why? You can't easily edit a screencast if there's a convenient time code in the corner that jumps around during your edits. Also, no one needs to know you're doing your work at 3am.

Clean out your taskbar and notification area. Anything that visually distracts, or just hide the taskbar.

Audio and Voice

Use a decent microphone. I use a Samson C01U. You can also use a USB headset-style microphone but be aware that breathing and "cotton mouth" really shows up on these. Test it! Listen to yourself! Try moving the microphone above your nose so you aren't exhaling onto it directly. Use a pop filter to help eliminate 'plosives (p's and t's). You can get them cheap at a music store.

Be aware of your keyboard clicks. Some folks feel strongly about whether or not your keyboard can be heard during a screencast. Ultimately it's your choice, but you have to be aware of it first, then make a conscious decision. Don't just let whatever happens happen. Think about your keyboard sound, your typing style and your microphone, and listen to it a few times and see if you like how it comes together.

Avoid prolonged silence. There should be ebb and flow of "I'm saying this, I'm doing that" but not 10 seconds of "watch my mouse." Speak in an upbeat but authentic tone. Be real.

Also be calm and quiet. Remember you are a foot from them and you're their ear. It's a conversation with a friend, not a presentation to thousands (even if it is).

Don’t apologize or make excuses for mistakes – either work them in as something to learn from, or remove them completely.

If you are editing the presentation - If you make a mistake when speaking or demonstrating, clap your hands or cough loudly into the mic and wait a second before starting that portion over. When editing, the mistakes will show up as loud audio spikes, making it easy to find them.

Camtasia has decent automatic noise reduction. Use it. You’ll be surprised how much background noise your room has that you, but not your audience, will easily tune out.

If you must overdub a portion of the audio, sit in the same position you did while recording the original, and have the mic in the same spot. You want your voice to blend in seamlessly.

Preferred Video Output for Prerecords

Your screen capture tool should be produced at the highest reasonable quality as it will be compressed later when it's uploaded. Think of it like producing JPEGs. You can make a 5 megabyte JPG, but often a 500k one will do. You can make a 10 gig screen capture if you use uncompressed AVI encoding, but often a high bit rate MP4 will do.

The trick is to remember that your compressed screencast will be recompressed (copies of copies) when it is run through the encoding process.

Edit your screencast, if you do, in its recorded native resolution which hopefully is what you'll publish to as well. That means, record at 1080p, edit at 1080p, and publish at 1080p. Let YouTube or your final destination do the squishing to smaller resolutions.

Personally, I like to know what's going on in my production process so I always select things like "Custom production settings" in Camtasia rather than presets. Ultimately you'll need to try and find what works for you. Use an H.264 encoder with a high bitrate for the video and 44.1kHz/441000Hz 16 bit mono for the audio. Basically make a decently sized MP4 and it should work everywhere.

Do you have enough bandwidth?

In my opinion, if you are doing a live call with Video and Screensharing and you want it to be high definition, you'll need 4 Mbps upstream from your connection. You can check this at http://speedtest.net. If you have 5-6 Mbps you've got a little more headroom. However, if someone in the house decides to get on Netflix, you could have an issue. Know your bandwidth limitations ahead of time. If it's an important stream, can you dedicate your bandwidth to just your one machine? Check out QoS (quality of service) on your router, or better yet, take your kids' iPads away! ;)

Conclusion

Take some time. I put about an hour of work into a 15 min screencast. Your mileage may vary. Watch your video! Listen to it, and have your friends listen to it. Does it look smooth? Sound smooth? Is it viewable on a small device AND a big screen? Does it FEEL good?


Sponsor: Have you tried yet? This fast and feature-rich cross-platform IDE improves your code for .NET, ASP.NET, .NET Core, Xamarin, and Unity applications on Windows, Mac, and Linux.


© 2020 Scott Hanselman. All rights reserved.
     

Enhanced Features Support Fleets as Delivery Demand Surges Amid COVID-19

$
0
0

The demand for deliveries has surged because of the COVID-19 pandemic. People are staying home and getting their groceries and other essentials delivered to their doorsteps. With this increase in demand comes a greater need for effective multi-stop route planning for delivery drivers. Launched in May 2019, the Bing Maps Multi-Itinerary Optimization (MIO) API automates route planning for multiple agents travelling between multiple locations. Since launch, we have listened to customer feedback and made a series of enhancements to meet the growing need.

We're happy to announce that the MIO API now supports up to 50 agents and 500 itinerary locations (versus 10 agents and 100 locations at the initial launch).

Multi-Itinerary Optimization API Screenshot

On top of the rich features introduced in the previous Bing Blog, we have also added some new features to the MIO API to support more scenarios. The following table summarizes the previously supported features and newly added ones.

Features Supported at Launch New Features Added Since Launch
 
  • Multi-day route planning
  • Multiple agents and multiple shifts
  • Service time windows
  • Priority of stops
  • Dwell time (i.e., how long an agent needs to be at a location
  • Predicted Traffic
 
  • Vehicle capacity
  • Quantity (to be picked up or dropped off) at each itinerary location
  • Pick up and drop off location sequencing dependencies
  • Depot location which can be visited multiple times to pick up loads as needed

We encourage you to try the MIO API demo to see how the API handles optimization for the sample scenarios and selected parameters.

In this blog, we will further explain how the new features work using some new sample scenarios below. For simplicity of interpreting the optimization results, we will use single agent examples to demonstrate how the optional parameters capacity, quantity, depot, and dropOffFrom can be used, respectively.

Scenario 1: Food delivery courier picking up food from restaurants and delivering to customers

This scenario will make use of capacity, quantity, and dropOffFrom options. A food delivery carrier named “Sam” has a thermal bag which can carry up to 12 food containers. He needs to pick up the food orders from some restaurants before delivering the orders to customers. To define this sequence of constraints, we’ll use the dropOffFrom parameter.

Agents

Agent Shift Start Start Location Shift End End Location Capacity
Carrier_Sam 2020-01-09T08:00:00 47.694117,-122.378189 2020-01-09T19:00:00 47.707079,-122.355227 12

Itinerary Items

Location Name Opening Closing Dwell Priority Location Quantity Drop Off
Customer 1 2020-01-09T18:00:00 2020-01-09T20:00:00 0:02:00 1 47.679810,-122.383036 -1 Pizza Place
Customer 2 2020-01-09T17:30:00 2020-01-09T19:00:00 0:02:00 1 47.677159,-122.365525 -1 Mexican Food
Customer 3 2020-01-09T18:00:00 2020-01-09T20:00:00 0:02:00 1 47.684664,-122.364840 -2 Pizza Place
Customer 4 2020-01-09T17:30:00 2020-01-09T19:00:00 0:02:00 1 47.686744,-122.354712 -1 Mexican Food
Customer 5 2020-01-09T18:00:00 2020-01-09T20:00:00 0:02:00 1 47.696219,-122.342180 -1 Pizza Place
Customer 6 2020-01-09T18:00:00 2020-01-09T19:00:00 0:02:00 1 47.692430,-122.391997 -1 Pizza Place
Pizza Place 2020-01-09T18:00:00 2020-01-09T20:00:00 0:10:00 1 47.670204,-122.382122 5  
Mexican Food 2020-01-09T17:30:00 2020-01-09T20:00:00 0:10:00 1 47.694184,-122.355996 2  

Note that quantity is an optional parameter defined by numeric values that represents the load quantity in terms of volume, weight or amount (i.e., pallet, case or passenger counts), etc. that the vehicle delivers to or picks up from each location. In this scenario, it can be used to define the number of food containers the carrier can carry. A negative value of quantity indicates dropping off loads at a location, while a positive value of quantity indicates picking up loads from a location. The table below summarizes the optimized itinerary for Carrier_Sam for the above itinerary items.

Optimized Itinerary

Location Index  Agent  Start Time Duration  End Time Location Name Priority  Location Quantity Drop
Off
1 Carrier_Sam Shift 1 Start: 2020-01-09T17:21:50       1 47.694117,-122.378189    
2 Carrier_Sam 2020-01-09T17:30:00 00:10:00 2020-01-09T17:40:00 Mexican Food 1 47.694184,-122.355996 2  
3 Carrier_Sam 2020-01-09T17:47:39 00:02:00 2020-01-09T17:49:39 Customer 2 1 47.677159,-122.365525 -1 Mexican Food
4 Carrier_Sam 2020-01-09T18:00:00 00:10:00 2020-01-09T18:10:00 Pizza Place 1 47.670204,-122.382122 5  
 
5 Carrier_Sam 2020-01-09T18:17:14 00:02:00 2020-01-09T18:19:14 Customer 1 1 47.679810,-122.383036 -1 Pizza Place
6 Carrier_Sam 2020-01-09T18:26:16 00:02:00 2020-01-09T18:28:16 Customer 6 1 47.692430,-122.391997 -1 Pizza Place
7 Carrier_Sam 2020-01-09T18:37:29 00:02:00 2020-01-09T18:39:29 Customer 3 1 47.684664,-122.364840 -2 Pizza Place
8 Carrier_Sam 2020-01-09T18:42:06 00:02:00 2020-01-09T18:44:06 Customer 4 1 47.686744,-122.354712 -1 Mexican Food
9 Carrier_Sam 2020-01-09T18:48:56 00:02:00 2020-01-09T18:50:56 Customer 5 1 47.696219,-122.342180 -1 Pizza Place
10 Carrier_Sam     Shift 1 End: 2020-01-09T18:55:53   1 47.707079,-122.355227    

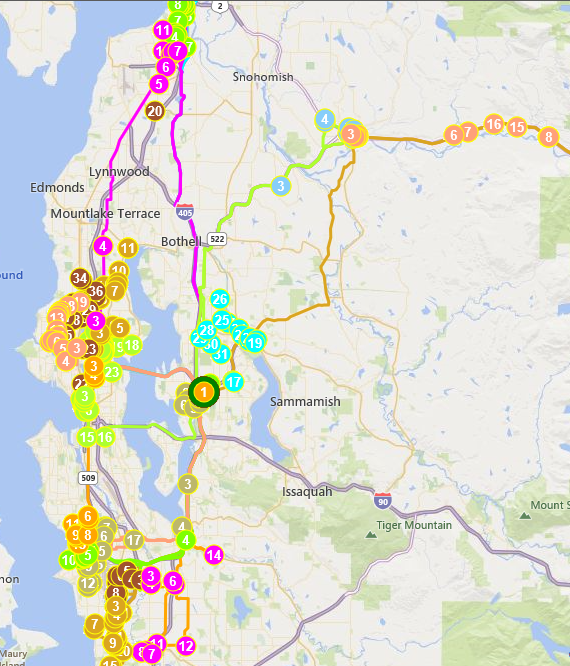
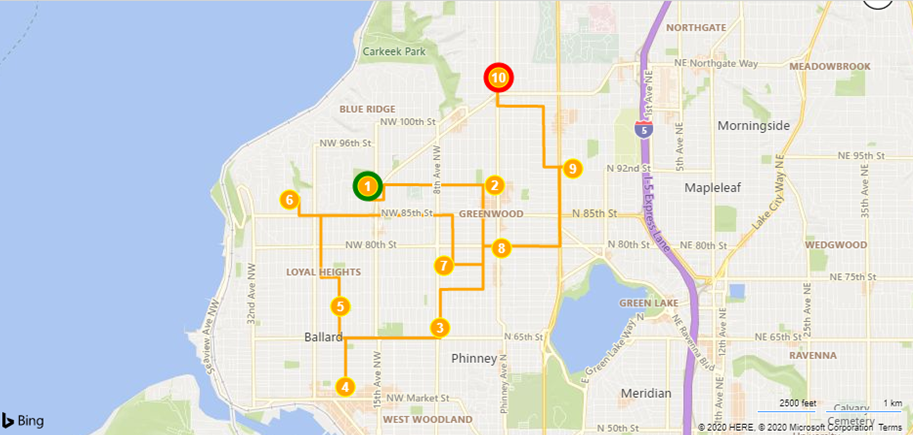
The itinerary for Carrier_Sam is illustrated in the map below. Location 1 is where the agent starts his shift and Location 10 is where his shifts ends.

Note that Carrier_Sam first picks up two orders from “Mexican Food” at Location 2 and then makes his first Mexican Food delivery to “Customer 2” at Location 3. After that, he picks up all orders from “Pizza Place” at Location 4 and completes the route with four “Pizza Place” deliveries at different locations as well as another Mexican Food delivery at “Customer 4” at Location 8.

Multi-Itinerary Optimization API - Scenario 1 Screenshot

Scenario 2: Home delivery service picking up orders from the warehouse and delivering to customers during different time slots.

This scenario will make use of the capacity, quantity, and depot parameter options. A delivery driver “John” needs to pick up some large objects like home appliances and furniture from a warehouse and have them delivered to customers at different locations. Each customer has a specified time window for delivery.

If the delivery quantity is large and exceeds the capacity of the agent’s vehicle, the agent needs to be able to make multiple trips during the day to reload at the "Warehouse" and deliver all goods. In the MIO API request, we can define the “Warehouse” as depot to allow the location to be visited more than once. In this example, quantity can be used to represent the volume in square meters.

Agents

Agent Shift Start Start Location Shift End End Location Capacity
driver_John 2020-01-09T08:00:00 47.663181,-122.299885 2020-01-09T18:00:00 47.663181,-122.299885 16

Itinerary Items

Location Name Opening Closing Dwell Priority Location Quantity Depot
Warehouse 2020-01-09T08:00:00 2020-01-09T18:00:00 00:30:00 undefined 47.664275,-122.300303 100 True
Customer 5 2020-01-09T08:00:00 2020-01-09T11:00:00 00:10:00 undefined 47.696219,-122.342180 -1  
Customer 6 2020-01-09T13:00:00 2020-01-09T18:00:00 00:10:00 undefined 47.692430,-122.391997 -2  
Customer 1 2020-01-09T10:00:00 2020-01-09T14:00:00 00:10:00 undefined 47.679810,-122.383036 -4  
Customer 2 2020-01-09T08:00:00 2020-01-09T12:00:00 00:10:00 undefined 47.677159,-122.365525 -1  
Customer 3 2020-01-09T13:00:00 2020-01-09T18:00:00 00:10:00 undefined 47.684664,-122.364840 -2  
Customer 4 2020-01-09T08:00:00 2020-01-09T18:00:00 00:10:00 undefined 47.686744,-122.354712 -5  
Customer 7 2020-01-09T08:00:00 2020-01-09T11:00:00 00:10:00 undefined 47.687759,-122.302118 -3  
Customer 8 2020-01-09T12:00:00 2020-01-09T17:00:00 00:10:00 undefined 47.701393,-122.295252 -2  
Customer 9 2020-01-09T08:00:00 2020-01-09T11:00:00 00:10:00 undefined 47.660018,-122.356535 -6  
Customer 10 2020-01-09T14:00:00 2020-01-09T18:00:00 00:10:00 undefined 47.700006,-122.363230 -1  
Customer 11 2020-01-09T10:00:00 2020-01-09T18:00:00 00:10:00 undefined 47.673312,-122.329413 -2  
Customer 12 2020-01-09T08:00:00 2020-01-09T18:00:00 00:10:00 undefined 47.691688,-122.323233 -3  
Customer 13 2020-01-09T13:00:00 2020-01-09T17:00:00 00:10:00 undefined 47.680131,-122.350699 -3  

The table below summarizes the optimized itinerary for driver_John for the above itinerary items.

Optimized Itinerary

Location Index Agent Start Time Duration  End Time Location Name Priority  Location Quantity  Depot
1 driver_John Shift 1 Start: 2020-01-09T08:00:00       1 47.664100,-122.300928    
2 driver_John 2020-01-09T08:01:16 00:30:00 2020-01-09T08:31:16 Warehouse 1 47.664275,-122.300303 16 True
3 driver_John 2020-01-09T08:40:28 00:10:00 2020-01-09T08:50:28 Customer 12 1 47.691688,-122.323233 -3  
4 driver_John 2020-01-09T08:55:15 00:10:00 2020-01-09T09:05:15 Customer 5 1 47.696219,-122.342180 -1  
5 driver_John 2020-01-09T09:08:24 00:10:00 2020-01-09T09:18:24 Customer 4 1 47.686744,-122.354712 -5  
6 driver_John 2020-01-09T09:22:14 00:10:00 2020-01-09T09:32:14 Customer 2 1 47.677159,-122.365525 -1  
7 driver_John 2020-01-09T09:36:57 00:10:00 2020-01-09T09:46:57 Customer 9 1 47.660018,-122.356535 -6  
8 driver_John 2020-01-09T09:56:31 00:30:00 2020-01-09T10:26:31 Warehouse 1 47.664275,-122.300303 3 True
9 driver_John 2020-01-09T10:32:41 00:10:00 2020-01-09T10:42:41 Customer 7 1 47.687759,-122.302118 -3  
10 driver_John 2020-01-09T10:49:02 00:30:00 2020-01-09T11:19:02 Warehouse 1 47.664275,-122.300303 16 True
11 driver_John 2020-01-09T11:26:10 00:10:00 2020-01-09T11:36:10 Customer 11 1 47.673312,-122.329413 -2  
12 driver_John 2020-01-09T13:00:00 00:10:00 2020-01-09T13:10:00 Customer 13 1 47.680131,-122.350699 -3  
13 driver_John 2020-01-09T13:15:32 00:10:00 2020-01-09T13:25:32 Customer 3 1 47.684664,-122.364840 -2  
14 driver_John 2020-01-09T13:32:33 00:10:00 2020-01-09T13:42:33 Customer 1 1 47.679810,-122.383036 -4  
15 driver_John 2020-01-09T13:48:19 00:10:00 2020-01-09T13:58:19 Customer 6 1 47.692430,-122.391997 -2  
16 driver_John 2020-01-09T14:03:59 00:10:00 2020-01-09T14:13:59 Customer 10 1 47.700006,-122.363230 -1  
17 driver_John 2020-01-09T14:26:41 00:10:00 2020-01-09T14:36:41 Customer 8 1 47.701393,-122.295252 -2  
18 driver_John     Shift 1 End: 2020-01-09T14:46:18   1 47.664100,-122.300928    

The itinerary for driver_John is illustrated in the map below. With a capacity constraint of 16, driver_John needs to return to the “Warehouse” several times to pick up more quantity to fulfil the delivery requests from all the customers with a total quantity of 35.

On the map, Location 1 denotes where the agent starts his shift. Location 2, Location 8 and Location 10 all overlap with Location 1, as the driver needs to load several times from the “Warehouse." By setting "depot": true in the JSON request, the API allows the truck to visit an itinerary location more than once.

Multi-Itinerary Optimization API - Scenario 2 Screenshot

Learn More

To learn more about using the MIO API to develop a multi-itinerary optimization solution, please refer to the MIO API documentation. This documentation has details including various options, how each scenario works, supported methods, sample Request Body and Response, how a transaction is calculated and more.

For details about all of the Bing Maps APIs that are part of the Bing Maps Platform and how to get licensed, please visit microsoft.com/maps.

As we continue to enhance and expand on our APIs, we encourage you to connect with us on the Bing Maps Forum to share your thoughts and let us know what features you would like to see us add in the future.

- Bing Maps

Get an edge while working from home

$
0
0

Working at an office probably wasn’t something you expected to miss in 2020. I know I didn’t. But if you’re reading this from home due to the global health crisis, it’s understandable that you might miss impromptu hallway conversations over the news ticker running through your head while working at the kitchen table. There’s a level of comfort and ease to working from an office, so here are some helpful tips to try out with the new Microsoft Edge as you settle in at home.

Tip #1 – Use your own device if your work computer didn’t get the “work from home” memo

While we may be working from home, that doesn’t guarantee our work machines came with us (let’s hope they’re at least digital distancing while back at the office). In lieu of these devices, you might need to work on your personal one. With Legacy Microsoft Edge, that meant needing a Windows 10 device—not ideal if you own a MacBook or an older device. The new Microsoft Edge addresses that. It supports Windows 10, but also down-level Windows and macOS, so you can set up your work profile and go. And when you head back to work? Sign-in there too and smoothly sync your favorites, settings, and passwords.

How to: Visit the Microsoft Edge website and download the app for your device’s platform. Sign-in with your work credentials and sync across multiple devices!

Pro Tip: If you’re a Mac user, check out some of the cool experiences enabled to make Microsoft Edge feel perfect for you.

Tip #2 – Turn on the Enterprise new tab page

Screenshot showing the Enterprise new tab page in Microsoft Edge

I’m terrible at finding files. If you’re like me, your only hope is to memorize digital breadcrumbs to find what you need, and even then, it’s 50/50. The Enterprise new tab page is the tool I didn’t know I needed, but now can’t live without. Open a new tab in Microsoft Edge and you can see recent and shared Office 365 files only a click away. Frustration now becomes focus.

How to: If you’re signed into Microsoft Edge and Office 3651 with your work credentials, just open a new tab and click the gear icon in the top right corner. In the flyout menu, select ‘Office 365’ under ‘Page Content’.

Pro Tip: Right click on the files you use most from the Enterprise new tab page and pin them—they’ll stay put under the “Pinned” tab and save you even more time.

Tip #3 – Find the answers you need when no one is around

Screenshot showing organizational search results via Microsoft Search

Files are the proverbial “tip of the iceberg” when it comes to internal information you regularly need to access. And while at home, asking your “work neighbor” for a contact in HR might only return a puzzled look from your dog. Instead, leverage Bing to help you find the internal information that you need. Documents, sites, people, HR benefits—just search from any new tab you open to get both Bing results and work results. Click into the work results box at the top of the page to see personalized results informed by the Microsoft Graph.

How to: If your organization has an Office 365 ProPlus subscription, just sign-in to Bing.com with your work account and search on Bing.com or when you open a new tab.

Pro Tip: Set Bing as your default search engine and search from your address bar too!

Tip #4 – Set boundaries while working from home (especially between personal and work browsing)

Taking breaks during the day is more important now than ever. Back in 2019, I would relax with a different browser because I didn’t want “Top 10 animal videos” to auto-fill in my work search results. But with the new Microsoft Edge, you can create separate profiles for work and personal—your browsing states are kept separate so you don’t mix work and personal unless you want to.

How to: Click on your profile picture and select “add a profile”. To open a personal browsing session, click the profile icon again and select the personal account.

Pro Tip: Microsoft Edge indicates which profile is active by using your account profile pictures over the Microsoft Edge app icon on the Windows 10 task bar. Use two different photos so you can easily tell which is which!

We hope these tips have been helpful. Everyone is facing new challenges – most of which fall outside the browser – and we all need kindness, support, and generosity from others. We empathize with your desire to give back to those impacted by COVID-19, even while we’re sheltering at home.

And so, the last tip:

Tip #5 – Make a difference in the world and Give with Bing

Screenshot showing Give Mode in Bing

Did you know that just by searching with Bing, you can participate in effortless giving? With a Microsoft Rewards account, switch on Give Mode and search the web like normal to accumulate points. These points are then automatically donated to a nonprofit of your choice. There are over 1 million to choose from, including the CDC! Now, just by searching, you can do a little bit to help.

How to: Switch to Give Mode when signed-in with your personal account on Bing.com. Then select a non-profit and search.

Pro Tip: Stay curious. Search more, give more.

– Eric Van Aelstyn, Product Marketing Manager, Microsoft Edge

1Office 365 subscription required

The post Get an edge while working from home appeared first on Microsoft Edge Blog.


See What’s New in Visual Studio 2019 v16.6 Preview 3!

$
0
0

Today we are excited to reveal some new features in Visual Studio 2019 version 16.6 Preview 3. Despite our challenges of learning how to work from home such as interruptions by kids, pets and internet blips, we continue to deliver new features to you. We are also eagerly preparing for our first virtual Build 2020 conference in May. We’d love to hear from where in the world you’ll be watching! Until the start of the conference, we hope these new features will keep you busy creating the software your imagination designs. Thank you for downloading our preview version, and, as always, we value your feedback through Developer Community.


Version Control

First up in our new feature list is continual expansion of Git functionality in Visual Studio 2019. To access these additional updates, you can toggle the Preview Feature for New Git user experience under the Tools > Options menu. Unlike the prior experience, when you clone a repository with one solution, Visual Studio 2019 will automatically load the solution after the clone completes. Consequently, this saves you valuable time.

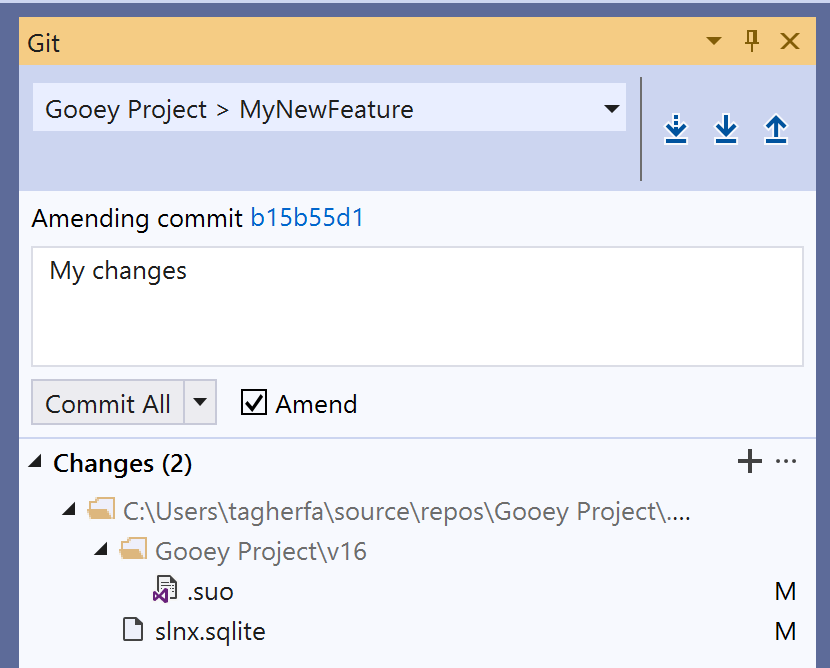
We have also updated the user interface for committing and stashing with an enhanced amend experience for commits. Furthermore, we listened to your Developer Community feedback about remote branch management. Specifically, we have added the requested functionality into the branch dropdown. In addition, you can now create a new branch commit in your repository history.

Finally, we have added several new commands in the top-level Git menu for easy keyboard access. These include Clone repository, view branch history, open repository in file explorer or command prompt, manage remotes, and Git global repository settings.

Git - Remotes - origin/Branch A
New Git user Experience in Visual Studio 2019 version 16.6 Preview 3


Git - Amending commit - Commit All - Changes
New Git User Experience in Visual Studio 2019 v16.6 Preview 3
Visual Studio Terminal

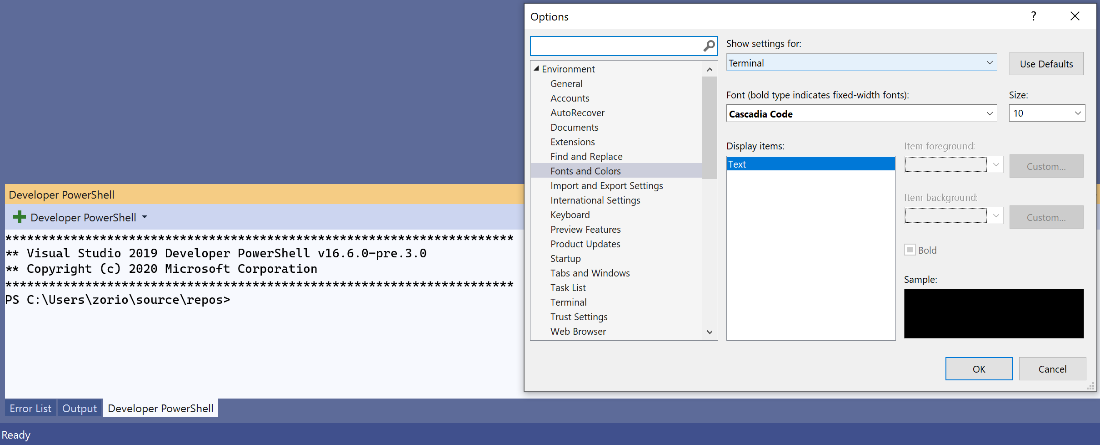
Within the terminal, we have added the ability to change the font face and size via the Fonts and Colors dialog.

Terminal Options - Fonts and Colors
Fonts and Colors Option in Visual Studio 2019 v16.6 Preview 3


Mobile Developer Tools

On the mobile front, XAML Hot Reload is now even faster and maintains more state on your page when you make a change. Your XAML change no longer makes the full-page refresh thanks to the Changes Only Reload setting in Tools > Options > Xamarin > Hot Reload. In Preview, this new reload method can be turned on or off at any time. If you chose to turn it on, you’ll also get the new Live Visual Tree during debugging. Therefore, this lets you see what controls are on the page of your running app!

Additionally, Xamarin.Android developers will notice their UI edits getting easier with new updates to make Android Apply Changes faster.

Microsoft Fakes for .NET Core and SDK-Style Projects

As explained in our documentation, Microsoft Fakes is a mocking framework that helps isolate your tests by “mocking” certain parts of your code with stubs or shims. This mocking helps untangle a test from your product code so it can focus on testing only what it is relevant in each test. Microsoft Fakes now supports .NET Core! You can enable this feature in Tools > Options > Preview  Features. You may find you want to migrate your apps and testing suites to .NET Core, and now a large portion of that work is possible.

Wishing You and Yours the Best

As this post concludes, I am reminded of a developer who reached out on LinkedIn. He shared how the release of new features made his time of social isolation bearable. Like many of us, he’d rather create through trying new things. In this spirit, we will continue to prioritize making our product more reliable while still capturing the innovative ideas and suggestions shared on Developer Community. Please feel welcome to participate in our online forums. As always, we wish health and safety to you and those closest to you.

The post See What’s New in Visual Studio 2019 v16.6 Preview 3! appeared first on Visual Studio Blog.

Using .NET Core to provide Power Query for Excel on Mac

$
0
0

Power Query is a data connection technology that enables you to discover, connect, combine, and refine data sources to meet your analysis needs. Features in Power Query are available in Excel and Power BI Desktop. Power Query was developed for windows and is written in C# targeting .NET Framework. The Power Query product has been in development for many years, it has a considerably large codebase, and is being used by millions of existing customers.

Originally Power Query was distributed as an Excel 2013 Add-In. However, as part of Excel 2016 it was natively integrated into Excel. Due to the dependency on .NET Framework, Power Query has been traditionally a Windows only feature of Excel and has been one of the top requests by our Mac community.

When .NET Core 2.1 was released it became a perfect opportunity for us to add Mac support for Power Query.

In this article I will share with you our journey from a Windows only to a cross platform product:

Excel For Mac

Requirements and constraints

The following depicts the different areas of work in this project and their relationships:

Areas Of Work

Making this cross platform came with a set of challenges:

  1. The Power Query codebase is written in C# and targets .NET Framework 3.5.
  2. The UI framework is based on WinForms, Internet Explorer, and COM interop.
  3. The Data Access layer uses COM based OLEDB as the means to move data between Power Query and Excel.
  4. Power Query provides a large set of connectors to external data sources. Many of these connectors use native Windows libraries (for example Microsoft Access connector) and may be extremely hard to make cross platform.
  5. The build and testing infrastructure were developed to run on Windows machines. For RPC it depends on Remoting, and some WCF features which are not natively supported by .NET Core.

It is quite obvious this turned out to be quite an undertaking and would require multiple man years to get done. Thus, we made a project management decision to split the project into two major sub projects:

  1. Refresh only: Use Windows to author Excel workbooks with Power Query queries inside them, and then allow our Mac users to refresh these workbooks using Excel for Mac. This covers a large use case, as it allows data analysts to create workbooks once, and have Mac users consume these workbooks and refresh the data as it updates.
  2. Authoring: Port the authoring UI to Mac.

This blog will focus on the refresh scenario leaving the authoring (UI) parts for future posts.

Power Query Refresh

The refresh project requires minimal user interface and would lay the groundwork needed for the rest of the project. We set for ourselves two major requirements:

  1. Whatever we do, do not break our existing Windows users :). This basically means we need to maintain the existing .NET Framework 3.5 build side by side to the .NET Core version.
  2. Keep the work cross platform. Our long term goal is to have a single cross platform codebase, running on the same .NET on all platforms, with minimal platform specific code.

The .NET API Portability analyzer

Any effort to port to .NET Core needs to start with running the API portability analyzer. Running this on the existing Power Query codebase, produced a long list of APIs being used which are not supported in .NET Core. A small subset is shown here:

API Compatibility Tool

Based on this, we had to create a plan to refactor the codebase. We needed to identify where we might find .NET Core alternatives, third party alternatives (like Newtonsoft.Json), or where we needed to implement our own replacements.

One thing to note is that this tool is by no means bulletproof. The tool will not identify the following unsupported usage of APIs:

  • Some APIs are missing the underlying implementations for non-Windows platforms.
  • Some low-level marshalling types are not supported in .NET Core and/or in Mac specifically. For example marshalling arrays as SafeArrays.
  • DllImport and ComImport are supported by .NET Core (ComImport in Windows only). But the native libraries imported are not cross platform. We had to manually identify all the native libraries being used in the product.

Based on all this, we needed to come up with a plan to fix all the non-portable APIs being used.

Porting the code

One of the biggest challenges porting such a large codebase, was maintaining our existing .NET Framework 3.5 version side by side with the new code. In addition, we wanted our .NET Core implementation to target both Windows and Mac. We wanted to achieve this in a clean and maintainable way, with minimal risk to our existing customers.

We used two types of techniques throughout the project to achieve these requirements: Partial Classes and Safe Re-implementation.

Partial Classes

Many of our classes use platform specific code. In such cases we needed to write our own alternatives for Mac. Our hope was to minimize these cases. We also tried to move a lot of such code into a PAL assembly and hide these details from the rest of the application. This was not always possible though.
In some cases, we also needed to use different APIs for .NET Framework 3.5 and .NET Core. One example would be the use of System.Web.Script.Serialization for .NET Framework 3.5 while using System.Text.Json for .NET Core.

Eventually, we use partial classes following this pattern in most cases:

Partial Classes

Following the pattern above, allows us to share code inside Foo.cs while still making platform or framework specific adjustments inside the separate partial classes. Special care needs to be made not to eagerly use this pattern. It can make the code quite messy.

Safe Re-implementation

Another approach we took where we could, was to re-implement things completely using APIs available both for .NET Framework 3.5 and .NET Core. One example was our native interop layer between Power Query and Excel. This was using SafeArrays and other Marshalling types not supported by .NET Core. Same was done to replace our OLEDB provider which was COM based. We replaced that with a p/invoke based implementation and C++ wrappers in the native code to hide the fact that we are not using COM.

In cases where we replaced the implementation completely, we needed to make sure we do this safely, without breaking our existing customers. We abstracted the public API of the component with an interface. We then implemented both the old and new implementations and choose at runtime, based on a feature switch, which to use. This allows us to gradually release and test the new implementation with our existing Windows customers. A great additional value here is that it allowed us to test our ideas way before we released to Mac using our Windows audience.

Abstract By Interface

Porting large codebases

When porting a large legacy codebase, you need to understand that there is a lot of risk being taken. You cannot compile, run, and test your code until you finish doing all the porting. This makes these types of projects inherently waterfall like, by nature. It’s very hard to estimate how long it will take. Another issue is that you need to port your projects one at a time based on the project dependency tree – from leaf projects up to the root. This can make it sometimes harder to parallelize the work.

We all agree that having good test coverage is really important. However, in this project I learned how important it is to have good unit test coverage. Our project has a very extensive end to end test suite. This is really good, but the downside is that we could only run it once the entire porting effort is done – i.e. all projects have been converted to .NET Core. In addition, the end to end tests rely on the product UI which did not exist in the initial feature. Having an extensive suite of unit and integration tests in this case is essential to reduce project risk.

If possible, you should convert each project, together with its corresponding unit test project and make sure these tests are passing. This is important so you catch runtime issues sooner rather than later.

Microsoft.DotNet.Analyzers.Compatibility

One thing the .NET API Portability analyzer does not tell you, is which APIs you are using that are not supported in platforms other than Windows. This is really important and not something which was obvious to our team from the start. Turns out that some of the APIs are only implemented for Windows and while they compile, when you try running your app on Mac or Linux, they will throw a runtime PlatformNotSupported Exception. We only found out about this once we completed the entire porting of the code and started to test on Mac.

Turns out there is another tool that can be used – Microsoft.DotNet.Analyzers.Compatibility. This is a Roslyn based analyzer that runs while compiling your code. It will flag APIs used that do not support the platform you are targeting. Once integrated into our build system, this helped us identify many cases that would have thrown exceptions at runtime.

Although this analyzer is super important, it does have some caveats. It runs as part of your compile phase. So, you need to get to a stage where your project is compiling (i.e. you ported all its dependencies) to benefit from it. This is still quite late in the game and would have definitely been more beneficial to have this information during the planning phase of the project. Second, it is not bullet proof. For instance, it cannot handle polymorphism well. If your code is calling an abstract method, then the analyzer would not be able to know that the concrete instance you are using would throw a PlatformNotSupported exception. For example, if you are calling WaitHandle.WaitAny (or WaitAll) and pass an instance of a Named Mutex, it will throw an exception in runtime. The compatibility analyzer cannot know this in advance.

Cross platform IPC

The Power Query application relies heavily on Inter Process Communication (IPC) objects to synchronize between multiple engine containers that perform the data crunching and the Excel host. These include (the named variants for) Mutex, Event, Semaphore, Shared Memory, and pipes. Due to the need for a standard .NET API, the .NET team made the decision to keep the existing .NET APIs. The problem is that these APIs are truly designed around Windows. It was virtually impossible to create a robust implementation for all platforms around the .NET Standard 2.0 APIs, and eventually, the .NET team decided not to support these on platforms other than Windows.

Fortunately, although creating a general purpose robust implementation of these APIs is very hard, once you bring in application specific constraints, it was possible for us to come up with a cross platform API that allows us to implement all the required IPC constructs. This means that we had to create our own cross platform IPC library with implementations for Windows and Mac/Unix.

Mac Sandbox and MHR

At the time we started this project, the .NET Core runtime was mainly being used for services and did not have any support for running from within a Sandbox in Mac. Office is released to the Apple App store and has the Mojave Hardened runtime enabled so it can be notarized by Apple. These posed additional requirements which needed to be addressed for our application to work properly. Most of the limitations and requirements were able to be addressed from within our codebase. However, some of the issues stemmed from the runtime itself, and required us to contribute changes back to the project in GitHub.

One of the main issues was debugging. The .NET debugger assumes that there will be semaphore files and a pipe inside the /tmp directory which will be used to communicate between the application and the debugger host. The problem is, that applications running inside the sandbox, don’t have access to the /tmp folder. We needed to move these files into a shared (application group) folder which our application does have access. We also needed to be able to tell the Visual Studio debugger host where this folder is located and to use this instead.

A similar issue was with the implementation of named Mutex files. These would store files in the /tmp folder too, and we needed to make fixes to the runtime PAL layer for Mac to be configured to work inside an application group shared folder.

We also had to update our own application to take sandboxing into account. For example, the Process class in .NET uses fork/exec to spawn new processes. This way of launching applications works great for console apps but is not how macOS launches sandboxed applications. Instead we needed to use the [NSWorkspace launchAtApplicationUrl] objective C API. Obviously, this required adding a native interop layer. We also needed to deal with security scoped bookmarks so would could share file permissions between the main Excel process and the child engine processes.

Sandbox

Supporting the Mojave Hardening runtime also required additional changes to the .NET Core runtime. These are mainly on how memory pages are allocated. Since .NET uses JIT compiling, we need to marge these pages as such with MMAP_JIT when allocating them. Fortunately, .NET Core 3.1 was released with support for this and we can accommodate our Mac customers with the extra security MHR provides.

Future plans and Conclusion

The introduction of .NET Core enabled us to have a path for making Power Query cross platform. While it was not a small project and the porting effort posed many challenges, the other alternatives would have been much more expensive.

With the introduction of .NET 5.0 and consolidation efforts of the different frameworks, porting to .NET Core (now just .NET 5.0) is not a question of when – it is just a question of how. I hope this post shed some light on the things you need to consider when choosing to port your Windows desktop app and make them cross platform.

The initial refresh feature is now in production and can be used by installing the Office 365 version of Excel. We are now actively working on adding the UI layer for this so we can support authoring. This is a huge effort and definitely requires a separate blog post – so stay tuned.

The post Using .NET Core to provide Power Query for Excel on Mac appeared first on .NET Blog.

GSL 3.0.0 Release

$
0
0

GSL 3.0.0 Release

Version 3.0.0 of Microsoft’s implementation of the C++ Core Guidelines Support Library (GSL) is now available for you to download on the releases page. Microsoft’s implementation of gsl::span has played a pivotal role in the standardization of span for C++20. However, the standard does not provide any runtime checking guarantees for memory bounds safety. The bounds safety provided by gsl::span has been very successful in preventing security issues in Microsoft products. This release maintains the safety guarantees that we have always offered but modernizes our implementation to align with C++20 span.

What changed in this release?

  • New implementations of gsl::span and gsl::span_iterator that align to the C++ 20 standard.
  • Changes to contract violation behavior.
  • Additional CMake support.
  • Deprecation of gsl::multi_span and gsl::strided_span.

When should I use gsl::span instead of std::span?

By default, use std::span which is shipping in VS2019 16.6 (with additional interface changes in 16.7, see release notes) if you have enabled C++20 mode and do not need runtime bounds checking guarantees. Use gsl::span if you need support for a version of C++ lower than C++20 (gsl::span supports C++14 and higher) or runtime bounds checking guarantees (all operations performed on gsl::span and its iterators have explicit bounds safety checks.)  

gsl::span

With the standardization of span nearing completion, we decided it was time to align our implementation with the design changes in the standard. The new implementation provides full bounds checking, guaranteeing bounds safety if the underlying data is valid.

General changes

gsl::span was rewritten to have its interface align to std::span. The biggest change is that span’s Extent is now unsigned. It is now implemented as std::size_t whereas previously it was std::ptrdiff_t. By extension, dynamic_extent is now defined as static_cast<std::size_t>(-1) instead of just -1.

  • The field span::index_type was removed, superseded by span::size_type.
  • Addition of Class Template Argument Deduction (CTAD) support.

Interface alignment

These are the changes required to align gsl::span to the interface of std::span.

Removed functions

  • span::operator()
  • span::at
  • span::cbegin
  • span::cend
  • span::crbegin
  • span::crend

Added functions

  • span::front
  • span::back

Renamed functions

  • span::as_writeable_bytes was renamed to span::as_writable_bytes

gsl::span_iterator

General changes

Our implementation of span_iterator has been completely rewritten to be more range-like. Previously, the implementation consisted of a span pointer and an offset. The new implementation is a set of three pointers: begin, end, and current.

Benefits of our new implementation

The new implementation can perform all of the bounds checks by itself, instead of calling into the span. By relying on pointers to the underlying data, rather than a pointer to the span, the new span_iterator can outlive the underlying span.

The new <gsl/span_ext> header

The <gsl/span_ext> header was created to support our customers who rely on portions of the old span implementation that no longer exist in the standard definition of span.

Elements moved from <gsl/span> and inserted into <gsl/span_ext>

  • span comparison operators
  • gsl::make_span
  • span specialization of gsl::at
  • gsl::begin
  • gsl::rbegin
  • gsl::crbegin
  • gsl::end
  • gsl::rend
  • gsl::crend

Contract violations

Contract violations are no longer configurable. Contract violations always result in termination, rather than providing a compile-time option to throw or disregard the contract violation. This is subject to change in the future. Some concerns over this decision have been raised and the conversation continues here: CppCoreGuidelines#1561. As a side note, the removal of the throwing behavior required the migration of our test infrastructure from Catch2 to Google Test, whose support of death tests easily enabled testing of contract violation behavior.

CMake improvements

This release now supports find_package. Once installed, use find_package(Microsoft.GSL CONFIG) to easily consume the GSL.

Deprecation of multi_span and strided_span

To more closely align Microsoft’s GSL to the C++ Core Guidelines, we decided to deprecate our implementation of gsl::multi_span and gsl::strided_span. For the time being, we will continue to provide these headers, but they will not be actively worked on or maintained unless the C++ Core Guidelines identifies a need for them.

Improvement changecausing potential build breaks and mitigations 

Change: The change from signed std::ptrdiff_t to unsigned std::size_t in gsl::span may introduce signed/unsigned mismatches.

Mitigation: Use static_cast or gsl::narrow_cast to resolve mismatches.


Change: gsl::multi_span and gsl::strided_span have been deprecated.

Mitigation: Pass multi-dimensional arrays as constant references instead of gsl::multi_span.


Change: Code that makes use of moved span helper functions will generate compiler errors. Examples of these functions include span comparison operators, gsl::make_span, etc.

Mitigation: Include <gsl/span_ext> instead of <gsl/span> in files where you use these functions.


Change: Throwing contract violation behavior is removed.
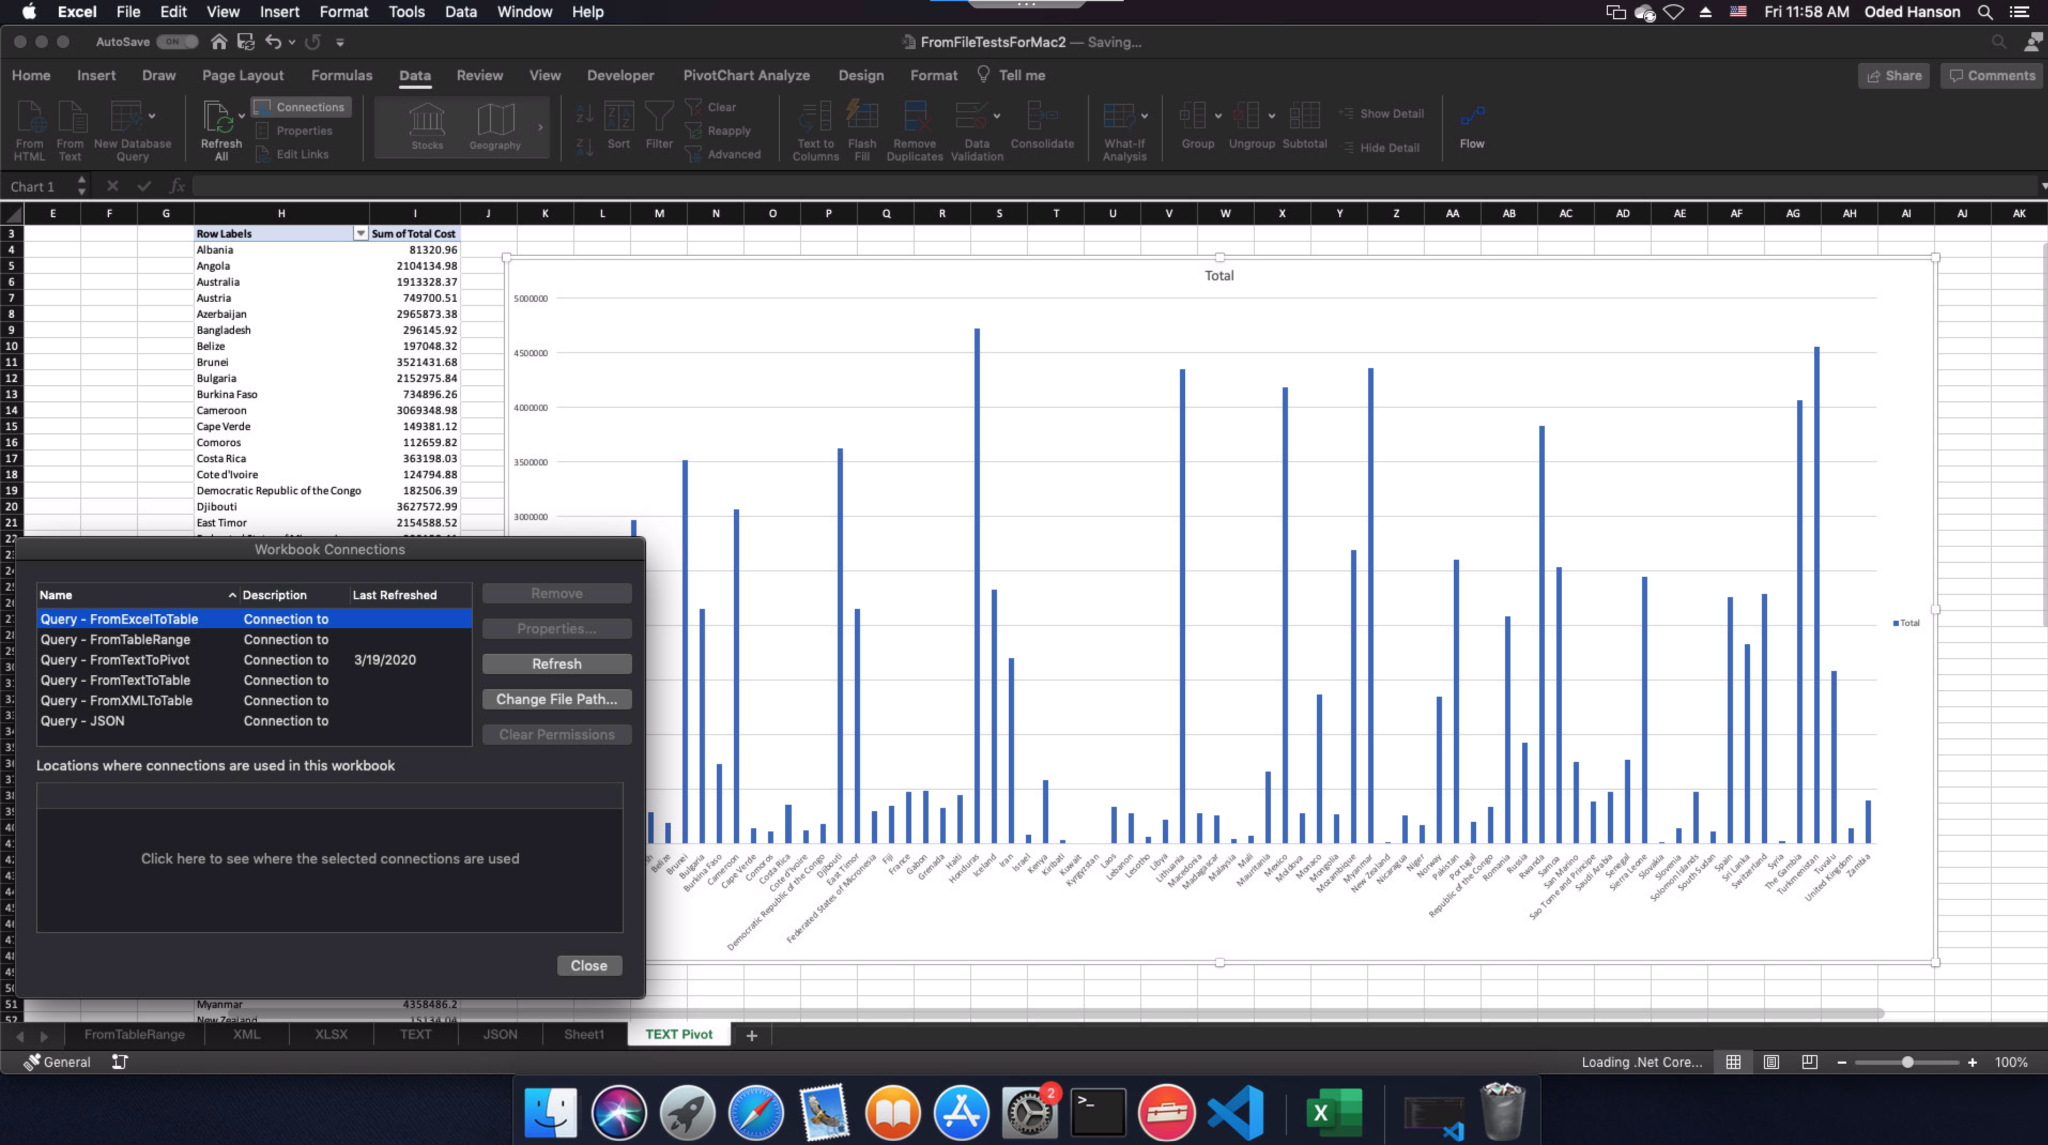
Mitigation: Use a terminate handler to log relevant information before termination executes for debugging. Relying on throwing behavior does not guarantee safety.
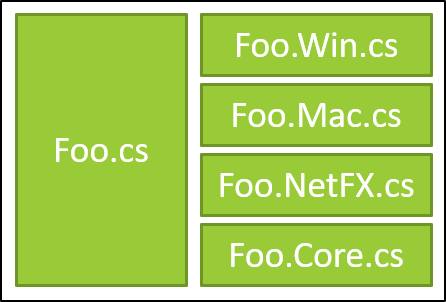
Upcoming changes

The paper P1976R2 that came out of the WG21 Prague meeting has yet to be implemented in GSL. A minor release will be issued when this is added to GSL.

Feedback

We look forward to hearing your feedback. If you would like to reach us, please use the comments below or email visualcpp@microsoft.com. Visit our page on GitHub if you would like to file issues or contribute to the project.

The post GSL 3.0.0 Release appeared first on C++ Team Blog.

Blazor WebAssembly 3.2.0 Preview 4 release now available

$
0
0

A new preview update of Blazor WebAssembly is now available! Here’s what’s new in this release:

  • Access host environment during startup
  • Logging improvements
  • Brotli precompression
  • Load assemblies and runtime in parallel
  • Simplify IL linker config for apps
  • Localization support
  • API docs in IntelliSense

Get started

To get started with Blazor WebAssembly 3.2.0 Preview 4 install the latest .NET Core 3.1 SDK.

NOTE: Version 3.1.201 or later of the .NET Core SDK is required to use this Blazor WebAssembly release! Make sure you have the correct .NET Core SDK version by running dotnet --version from a command prompt.

Once you have the appropriate .NET Core SDK installed, run the following command to install the updated Blazor WebAssembly template:

dotnet new -i Microsoft.AspNetCore.Components.WebAssembly.Templates::3.2.0-preview4.20210.8

If you’re on Windows using Visual Studio, we recommend installing the latest preview of Visual Studio 2019 16.6. For this preview you should still install the template from the command-line as described above to ensure that the Blazor WebAssembly template shows up correctly in Visual Studio and on the command-line.

That’s it! You can find additional docs and samples on https://blazor.net.

Upgrade an existing project

To upgrade an existing Blazor WebAssembly app from 3.2.0 Preview 3 to 3.2.0 Preview 4:

  • Update all Microsoft.AspNetCore.Components.WebAssembly.* package references to version 3.2.0-preview4.20210.8.
  • Update any Microsoft.AspNetCore.Components.WebAssembly.Runtime package references to version 3.2.0-preview5.20210.1
  • Replace package references to Microsoft.AspNetCore.Blazor.HttpClient with System.Net.Http.Json and update all existing System.Net.Http.Json package references to 3.2.0-preview5.20210.3.
  • Add @using System.Net.Http.Json to your _Imports.razor file and update your code as follows:

    Microsoft.AspNetCore.Blazor.HttpClient System.Net.Http.Json
    GetJsonAsync GetFromJsonAsync
    PostJsonAsync PostAsJsonAsync
    PutJsonAsync PutAsJsonAsync

    Calls to PostAsJsonAsync and PutAsJsonAsync return an HttpResponseMessage instead of the deserialized response content. To deserialize the JSON content from the response message, use the ReadFromJsonAsync<T> extension method: response.content.ReadFromJsonAsync<WeatherForecast>().

  • Replace calls to AddBaseAddressHttpClient in Program.cs with builder.Services.AddSingleton(new HttpClient { BaseAddress = new Uri(builder.HostEnvironment.BaseAddress) });.

You’re all set!

Access host environment during startup

The WebAssemblyHostBuilder now exposes IWebAssemblyHostEnvironment through the HostEnvironment property, which surfaces details about the app environment (Development, Staging, Production, etc.) during startup. If the app is hosted in an ASP.NET Core app, the environment reflects the ASP.NET Core environment. If the app is a standalone Blazor WebAssembly app, the environment is specified using the blazor-environment HTTP header, which is set to Development when served by the Blazor dev server. Otherwise, the default environment is Production.

New convenience extension methods on IWebAssemblyHostEnvironment make it easy to check the current environment: IsProduction(), IsDevelopment(), IsStaging(). We’ve also added a BaseAddress property to IWebAssemblyHostEnvironment for getting the app base address during startup when the NavigationManager service isn’t yet readily available.

Logging improvements

The WebAssemblyHostBuilder now exposes a Logging property of type ILoggingBuilder that can be used to configure logging for the app, similar to how you would configure Logging in an ASP.NET Core app on the server. You can use the ILoggingBuilder to set the minimum logging level and configure custom logging providers using extension methods in the Microsoft.Extensions.Logging namespace.

Brotli precompression

When you publish a Blazor WebAssembly app, the published and linked output is now precompressed using Brotli at the highest level to further reduce the app size and remove the need for runtime compression. ASP.NET Core hosted apps seamlessly take advantage of these precompressed files. For standalone apps, you can configure the host server to redirect requests to the precompressed files. Using the precompressed files, a published Blazor WebAssembly is now 1.8MB, down from 2MB in the previous preview. A minimal app without Bootstrap CSS reduces to 1.6MB.

Load assemblies and runtime in parallel

Blazor WebAssembly apps now load the assemblies and runtime in parallel saving some precious milliseconds off the app load time.

Simplify .NET IL linker config for apps

You can optionally provide a .NET IL linker config file for a Blazor WebAssembly app to customize the behavior of the linker. Previously, specifying a linker config file for your app would override the customizations built into Blazor that are necessary for apps to function property. App specific linker configuration is now treated as additive to the linker configuration provided by Blazor.

Localization support

Blazor WebAssembly apps now support localization using .NET resource files (.resx) and satellite assemblies. Blazor WebAssembly apps set the current culture using the user’s language preference. The appropriate satellite assemblies are then loaded from the server. Components can then be localized using the ASP.NET Core localization APIs, like IStringLocalizer<TResource> and friends. For more details on localizing Blazor WebAssembly apps, see Globalization and localization.

API docs in IntelliSense

The API docs for the various Blazor WebAssembly APIs are now available through IntelliSense:

API docs in IntelliSense

Known issues

Debugging limitations

Thank you everyone who has been trying out the new Blazor WebAssembly debugging support and sending us your feedback! We’ve made some progress in this release, but there are still a number of limitations with the current debugging experience in Visual Studio and Visual Studio Code. The following debugging features are still not yet fully implemented:

  • Inspecting arrays
  • Hovering to inspect members
  • Step debugging into or out of managed code
  • Full support for inspecting value types
  • Breaking on unhandled exceptions
  • Hitting breakpoints during app startup

We expect to continue to improve the debugging experience in future releases.

Help improve the Blazor docs!

We’ve received a some feedback from the in-product Blazor survey that the Blazor docs could use some improvement. Thank you for this feedback! We know that docs are a critical part of any software development framework, and we are committed to making the Blazor docs as helpful as we can.

We need your help to understand how to best improve the Blazor docs! If you’d like to help make the Blazor docs better, please do the following:

  • As you read the Blazor docs, let us know where we should focus our efforts by telling us if you find a topic helpful or not using the helpfulness widget at the top of each doc page:

    Doc helpfulness

  • Use the Feedback section at the bottom of each doc page to let us know when a particular topic is unclear, inaccurate, or incomplete.

    Doc feedback

  • Comment on our Improve the Blazor docs GitHub issue with your suggestions for new content and ways to improve the existing content.

Feedback

We hope you enjoy the new features in this preview release of Blazor WebAssembly! Please let us know what you think by filing issues on GitHub.

Thanks for trying out Blazor!

The post Blazor WebAssembly 3.2.0 Preview 4 release now available appeared first on ASP.NET Blog.

Sign Up For Pure Virtual C++ Conference 2020

$
0
0

Pure Virtual C++ 2020 is a free single-track one-day virtual conference for the whole C++ community. It is taking place on Thursday 30th April 2020 from 14:30 to 23:00 UTC. Sign up on the event website.

All talks will be pre-recorded and streamed on YouTube Live with a live Q&A session with the speakers. After the event, the talks will be available to watch online for free.

The Pure Virtual C++ conference organized by Microsoft will be run under the Berlin Code of Conduct.

The preliminary schedule is (all times UTC):

  • 14:30-15:30 – Dynamic Polymorphism with Metaclasses and Code Injection by Sy Brand
  • 16:00-16:30 – Optimize Your C++ Development While Working From Home by Nick Uhlenhuth
  • 16:30-17:00 – C++ Cross-Platform Development with Visual Studio and WSL by Erika Sweet
  • 17:30-18:30 – Lucky 7 – Designing Text Encodings for C++ by JeanHeyd Meneide
  • 19:00-20:00 – C++ Development with Visual Studio Code by Julia Reid
  • 20:30-21:00 – Peeking Safely at a Table with Concepts by Gabriel Dos Reis
  • 21:00-21:30 – Practical C++20 Modules and the Future of Tooling Around C++ Modules by Cameron DaCamara
  • 22:00-23:00 – Update on MSVC’s implementation of the C++20 Standard Library by Mahmoud Saleh

Get involved in the conversation on Twitter using the #purevirtualcpp hashtag.

The post Sign Up For Pure Virtual C++ Conference 2020 appeared first on C++ Team Blog.

Viewing all 5971 articles
Browse latest View live


<script src="https://jsc.adskeeper.com/r/s/rssing.com.1596347.js" async> </script>