Quantcast
Channel: Category Name
Viewing all 5971 articles
Browse latest View live

Improved cloud service performance through ASIC acceleration

$
0
0

Delivering new, transformational capabilities increasingly requires that we develop for ourselves competencies which we’d previously turned to our suppliers for. Our experience building Azure public cloud services over the last several years bears this out. We’re now developing our own server infrastructure and investing in innovative silicon technologies, such as field-programmable gate arrays (FPGAs), to accelerate our workloads — things that would have been unheard of years ago.

At the Open Compute Project 2019 conference, we unveiled Project Zipline. Project Zipline is comprised of a new, cutting-edge compression and encryption pipeline and the contribution to open source of the register transfer language (RTL), which is used to implement it in hardware. Azure's dramatic growth has rapidly increased our need for optimized data processing and storage systems. Zipline enables compression without compromise by simultaneously delivering higher compression ratios, higher throughput, and lower latency than other solutions available today.

Today, we announce the companion technology to Project Zipline — Project Corsica. Over two years in the making, Corsica is our ASIC implementation of Zipline technology. It delivers Zipline’s first rate performance in compression, encryption, and data authentication, all accelerated in a special purpose ASIC developed by Microsoft in collaboration with Broadcom.

Internal innovations in data storage and encryption

A massive surge in demand for data is taking place, straining the industry’s storage capacities and data management capabilities. At the same time, security and privacy concerns have increased, making large-scale encryption an essential piece of the equation.

A few years ago, we started looking at scale challenges in the cloud centered on data growth and the future of storage needs. In a digitized world where artificial intelligence drives business processes, customer engagements, and autonomous infrastructure, we need to create and store more information than ever before.

Enter Project Corsica, which has the potential to be as transformative to our data storage capabilities as any singular technology we’ve deployed to date. Fundamentally, data is at the heart of digital transformation, leveraged by companies to improve customer experiences and differentiate their products and services.

Project Corsica was designed specifically with Azure’s data storage needs and service quality guarantees in mind. Corsica can help to remove data processing bottlenecks by shifting compression and encryption away from the CPU and onto a dedicated hardware accelerator that’s purpose built for these functions.

Corsica’s performance is stellar. It enables our cloud platform to:

  • Compress and encrypt data streams at SSD transfer rates, delivering extremely low latency.
  • Combine multiple Zipline pipelines to deliver data throughput of 100Gbps, mitigating system bottlenecks.
  • Perform encryption in-line with compression, enabling pervasive encryption with zero system impact.

A comparison of disk writing with Corsica vs CPU.

The Zipline compression algorithm used by Corsica yields dramatically better results than other algorithms for cloud data sets, more than 20 percent higher compression ratios versus the commonly used Zlib-L4 64KB model.

A look at compression rates of cloud data from application services, IoT text files, and system logs

At its core, Corsica is a cutting-edge compression technology optimized for a large variety of datasets. Our release of RTL allows hardware vendors to use the reference design to produce chips that harness the algorithm’s compression, cost, and power benefits. Corsica is available to the Open Compute Project (OCP) ecosystem, enabling future contributors to further benefit the entire ecosystem, including Azure and our customers.

Project Zipline partners and ecosystem

As a leader in the cloud storage space, I'm particularly proud that we're able to take all the investment and innovation we've created and share it through OCP so our partners can provide better solutions for their customers. The following industry collaborators have expressed their support for the Project Zipline technology that underpins Corsica.

A list of companies who support Project Zipline and Corsica.

I look forward to seeing more of the industry joining OCP and collaborating so their customers can also see the benefit.

You can follow these links to learn more about our open source hardware development or Microsoft's Project Zipline contribution on GitHub.


Azure SQL Data Warehouse releases new capabilities for performance and security

$
0
0

As the amount of data stored and queried continues to rise, it becomes increasingly important to have the most price-performant data warehouse. While we’re excited about being the industry leader in both of Gigaom’s TPC-H and TPC-DS benchmark reports, we don’t plan to stop innovating on behalf of our customers.

As Rohan Kumar mentioned in his blog on Monday, we’re excited to introduce several new features that will continue to make Azure SQL Data Warehouse the unmatched industry leader in price-performance, flexibility, and security.

To enable customers to continue improving the performance of their applications without adding any additional cost, we’re announcing preview availability of result-set caching, materialized views, and ordered clustered columnstore indexes.

In addition to price-performance enhancements, we’ve added new capabilities that enable customers to be more agile and flexible. The first is workload importance, which is a new feature that enables users to decide how workloads with conflicting needs get prioritized. Second, our new support for automatic statistics maintenance (auto-update statistics) means that manageability and maintenance of Azure SQL Data Warehouse just got easier and more effective. And finally, we’re also adding support for managing and querying JSON data. Users can now load JSON data directly into their data warehouses and mix it with other relational data, leading to faster and easier insights.

Our last announcement focuses on security and privacy. As you know, deploying data warehousing solutions in the cloud demands sophisticated and robust security. While Azure SQL Data Warehouse already enables an advanced security model to be deployed, today we’re announcing support for Dynamic Data Masking (DDM). DDM allows you to protect private data, through user-defined policies, ensuring it’s visible only to those that have permission to see it.

Azure SQL Data Warehouse is a critical piece of the big data pipeline.

In the sections below, we’ll dive into these new features and the benefits that each provide.

Price-performance

Price-performance is a reoccurring theme in our releases because it ensures we provide one of the fastest analytics services at incredible value. With new functionalities announced today, we continue to demonstrate our commitment towards offering the leading price-performance platform.

Interactive dashboarding with result-set caching (preview)

Interactive dashboards come with predictable and repetitive query patterns. Result-set caching, now available in preview, helps with this scenario as it enables instant query response times while reducing time-to-insight for business analysts and reporting users.

With result-set caching enabled, Azure SQL Data Warehouse automatically caches results from repetitive queries, causing subsequent query executions to return results from the persisted cache that omits full query execution. In addition to saving compute cycles, queries satisfied by result-set cache do not use any concurrency slots and thus do not count against existing concurrency limits. For security reasons, only users with the appropriate security credentials can access the result sets in cache.

Materialized views to improve performance (preview)

Another new feature that greatly enhances query performance for a wide set of queries is materialized view support, now available in preview. A materialized view improves the performance of complex queries (typically queries with joins and aggregations) while offering simple maintenance operations.

When materialized views are created, Azure SQL Data Warehouse query optimizer transparently and automatically rewrites user queries to leverage deployed materialized views, leading to improved query performance. Best of all, as the data gets loaded into base tables, Azure SQL Data Warehouse automatically maintains and refreshes materialized views, providing a simplified view of maintenance and management. As the user queries leverage materialized views, queries run significantly faster and use less system resources. The more complex and expensive the query within the view is, the bigger potential there is for execution time savings.

Fast scans with ordered clustered columnstore indexes (preview)

Columnstore is a key enabler for storing and efficiently querying large amounts of data. For each table, it divides incoming data into row groups and each column of a row group forms a segment on a disk. When querying columnstore indexes, only the column segments that are relevant to user queries are read from the disk. Ordered clustered columnstore indexes further optimize query execution by enabling efficient segment elimination.

Due to pre-ordered data, you can drastically reduce the number of segments that are read from the disk, leading to faster query processing. Ordered clustered columnstore indexes is now available in preview, and queries containing filters and predicates can greatly benefit from this feature.

Flexibility

As business requirements evolve, the ability to change and adapt solution behavior is one of the key benefits of a modern data warehousing product. The ability to handle and manage heterogeneous data that enterprises have while offering ease of use and management is critical. To support these needs, Azure SQL Data Warehouse is introducing the following new functionalities to help you deal with ever-evolving requirements.

Prioritize workloads with workload importance (general availability)

Running mixed workloads on your analytics solution is often a necessity to effectively and quickly execute business processes. In situations where resources are constrained, the capability to decide which workloads need to be executed first is critical, as it helps with overall solution cost management. For instance, executive dashboard reports may be more important than ad-hoc queries. Workload importance now enables this scenario. Requests with higher importance are guaranteed quicker access to resources, which helps meet predefined SLAs and ensures important requests are prioritized.

Workload classification concept

To define workload priority, various requests must be classified. Azure SQL Data Warehouse supports flexible classification policies that can be set for a SQL query, a database user, database role, Azure Active Directory login, or Azure Active Directory group. Workload classification is achieved using the new CREATE WORKLOAD CLASSIFIER syntax.

The diagram below illustrates the workload classification and importance function:

The classifier assigns incoming requests to a workload group and assigns importance based on the parameters specified in the classifier statement definition.

Workload importance concept

Workload importance is established through classification. Importance influences a requester's access to system resources  including memory, CPU, and IO and locks. A request can be assigned one of these five levels of importance: low, below_normal, normal, above_normal, and high. If a request with above_normal importance is scheduled, it gets access to resources before a request with the default normal importance.

With workload importance, you can easily ensure that important queries immediately get access to resources.

Manage and query JSON data (preview)

Organizations are increasingly faced with dealing with multiple data sources and heterogeneous file formats, JSON being among the top ones, aside from CSV files. To speed up time to insight and minimize unnecessary data transformation processes, Azure SQL Data Warehouse now enables support for querying JSON data. This feature is now available in preview.

Business analysts can now use the familiar T-SQL language to query and manipulate documents that are formatted as JSON data. JSON functions, such as JSON_VALUE, JSON_QUERY, JSON_MODIFY, and OPENJSON are now supported in Azure SQL Data Warehouse. Azure SQL Data Warehouse can now effectively support both relational and non-relational data, including joins between the two, while enabling users to use their traditional BI tools, such as Power BI.

Automatic statistics maintenance and update (preview)

Azure SQL Data Warehouse implements a cost-based optimizer to ensure optimal execution plans are being generated and used. For any cost-based optimizer to be effective, column level statistics are needed. When these statistics are stale, there is potential for selecting a non-optimal plan, leading to slower query performance.

Today, we’re extending that support for auto statistics creation by adding the ability to automatically refresh and maintain statistics. As data warehouse tables get loaded and updated, the system can now automatically detect and update out-of-date statistics. With the auto-update statistics capability now available in preview, Azure SQL Data Warehouse delivers full statistics management capabilities while simplifying statistics maintenance processes. You no longer need to manually maintain statistics, which leads to a simplified and more cost-effective data warehouse deployment.

Security

Azure SQL Data Warehouse provides one of the most advanced security and privacy features in the market. This is achieved through using proven SQL Server technology. SQL Server, as the core technology and component of Azure SQL Data Warehouse, has been the least vulnerable databases over the last eight years according to the NIST national vulnerabilities database. To expand existing Azure SQL Data Warehouse's security and privacy features, we’re announcing Dynamic Data Masking (DDM) support is now available in preview.

Protect sensitive data with dynamic data masking (preview)

Dynamic data masking (DDM) enables administrators and data developers to control access to their company’s data, allowing sensitive data to be safe and restricted. It prevents unauthorized access to private data by obscuring the data on-the-fly. Based on user-defined data masking policies, Azure SQL Data Warehouse can dynamically obfuscate data as the queries execute, and before results are shown to users.

Dynamic Data Masking with Azure SQL Data Warehouse prevents unauthorized access to private data by obscuring the data on-the-fly.

Azure SQL Data Warehouse implements the DDM capability directly inside the engine. When creating tables with DDM, policies are stored in the system's metadata and then enforced by the engine as queries get executed. This centralized policy enforcement process simplifies data masking rules management as access control is not implemented and repeated at the application layer. As various users access queries tables, policies are automatically honored and applied while protecting sensitive data. DDM comes with flexible policies and you can choose to define a partial mask, which exposes some of the data in the selected columns, or a full mask that obfuscates the data completely. Azure SQL Data Warehouse also provides built-in masking functions that users can choose from.

Next steps

Please note that the preview features mentioned in this blog are being rolled out to all regions. Check the version deployed to your instance and review the latest Azure SQL Data Warehouse release notes to learn more. For preview questions, please contact AskADWPreview@microsoft.com.

Signing into Azure DevOps using your GitHub credentials

$
0
0

Across all of Microsoft, we are focusing on empowering developers to build better apps, faster. One way we are accomplishing that is by providing a range of products and services covering all stages of the software development lifecycle. This includes IDEs and DevOps tools, application and data platforms on the cloud, operating systems, Artificial Intelligence and IoT solutions, and more. All of these are centered around developers, both as individuals working in teams and organizations, and as members of developer communities.

GitHub is one of the largest developer communities, and for millions of developers around the world their GitHub identity has become a critical aspect of their digital life. Recognizing that, we’re excited to announce improvements that will help GitHub users get started more easily with our developer services, including Azure DevOps and Azure.

Your GitHub credentials can now log you in to Microsoft services

Today, we are enabling developers to sign in with their existing GitHub account to Microsoft online services, on any Microsoft log in page. Using your GitHub credentials, you can now sign in via OAuth anywhere a personal Microsoft account does, including Azure DevOps and Azure.

GitHub sign in button in Microsoft login page

You will see the option to sign in with your GitHub account by clicking on “Sign in with GitHub”.

After signing into GitHub and authorizing the Microsoft application, you will get a new Microsoft account that is linked to your GitHub identity. During this process, you also have the opportunity to link it to an existing Microsoft account if you already have one.

Sign-in to Azure DevOps

Azure DevOps offers a suite of services for developers to help them plan, build, and ship, any app. With support for GitHub authentication, we are making it easier to get started with services such Continuous Integration and Continuous Delivery (Azure Pipelines); agile planning (Azure Boards); and storage for private packages such as modules for NuGet, npm, PyPi, etc (Azure Artifacts). The Azure DevOps suite is free for individuals and small teams of up to five.

To get started with Azure DevOps using your GitHub account, click on “Start free using GitHub” in the Azure DevOps page.

Azure DevOps sign in with GitHub

Once you complete the sign-in process, you will be taken directly to the last Azure DevOps organization you visited. If you’re brand new to Azure DevOps, you’ll land to a new organization created for you.

Access all of Microsoft online services

In addition to accessing developer services such as Azure DevOps and Azure, your GitHub account can be used to access all Microsoft online services, from Excel Online to Xbox.

When authenticating with those services, you can find your GitHub account after clicking on “Sign-in options”.

Click on Sign-in options in the login page for non-developer Microsoft services

Our commitment to your privacy

When you first use your GitHub account to sign in with Microsoft, GitHub will ask for permission to release your profile information.

If you consent, GitHub will share the email addresses on your GitHub account (both public and private) as well as profile information, like your name. We’ll use this data to check if you already have an account with us or to create a new account if you don’t. Connecting your GitHub identity to a Microsoft one does not give Microsoft access to your repositories in GitHub. Apps like Azure DevOps or Visual Studio will request access to your repositories separately if they need to work with your code, which you’ll need to consent to separately.

While your GitHub account is used to log into your Microsoft account, they’re still separate entities – one just uses the other as a login method. Changes you make to your GitHub account (like changing the password or enabling two-factor authentication) won’t change your Microsoft account, and vice versa. You can manage the connection between your GitHub and Microsoft identities in your account management page, under the Security tab.

Start exploring Azure DevOps now

Go to the Azure DevOps page and click “Start Free with GitHub” to get started.

If you have questions, check out this support page. Let us know what you think in the comments below. As always, we’d love to hear any feedback or suggestions you have.

The post Signing into Azure DevOps using your GitHub credentials appeared first on Azure DevOps Blog.

Introducing diagnostics improvements in .NET Core 3.0

$
0
0

In .NET Core 3.0, we are introducing a suite of tools that utilize new features in the .NET runtime that make it easier to diagnose and solve performance problems.

These runtime features help you answer some common diagnostic questions you may have:

  1. Is my application healthy?
  2. Why does my application have anomalous behavior?
  3. Why did my application crash?

Is my application healthy?

Often times an application can slowly start leaking memory and eventually result in an out of memory exception. Other times, certain problematic code paths may result in a spike in CPU utilization. These are just some of the classes of problem you can pro-actively identify with metrics.

Metrics

Metrics are a representation of data measures over intervals of time. Metrics (or time-series) data allow you to observe the state of your system at a high-level. Unlike the .NET Framework on Windows, .NET Core doesn’t emit perf counters. Instead, we had introduced a new way of emitting metrics in .NET Core via the EventCounter API.

EventCounters offer an improvement over Windows perf counters as these are now usable on all OSes where .NET Core is supported. Additionally, unlike perf counters, they are also usable in low privilege environments (like xcopy deployments). Unfortunately, the lack of a tool like Performance Monitor (perfmon) made it difficult to consume these metrics in real time.

dotnet-counters

In 3.0-preview5, we are introducing a new command-line tool for observing metrics emitted by .NET Core Applications in real time.

You can install this .NET global tool by running the following command

dotnet tool install --global dotnet-counters --version 1.0.3-preview5.19251.2

In the example below, we see the CPU utilization and working set memory of our application jump up when we point a load generator at our web application.

For detailed instructions on how to use this tool, look at the dotnet-counters readme. For known limitations with dotnet-counters, look at the open issues on GitHub.

Why does my application have anomalous behavior?

While metrics help identify the occurence of anomalous behavior, they offer little visibility into what went wrong. To answer the question why your application has anomalous behavior you need to collect additional information via traces. As an example, CPU profiles collected via tracing can help you identify the hot path in your code.

Tracing

Traces are immutable timestamped records of discrete events. Traces contain local context that allow you to better infer the fate of a system. Traditionally, the .NET Framework (and frameworks like ASP.NET) emitted diagnostic traces about its internals via Event Tracing for Windows (ETW). In .NET Core, these trace were written to ETW on Windows and LTTng on Linux.

dotnet-trace

In 3.0-preview5, every .NET Core application opens a duplex pipe named EventPipe (Unix domain socket on *nix/named pipe on Windows) over which it can emit events. While we’re still working on the controller protocol, dotnet-trace implements the preview version of this protocol.

You can install this .NET global tool by running the following command

dotnet tool install --global dotnet-trace--version 1.0.3-preview5.19251.2

In the example above, I’m running dotnet trace with the default profile which enables the CPU profiler events and the .NET runtime events.

In addition to the default events, you can enable additional providers based on the investigation you are trying to perform.

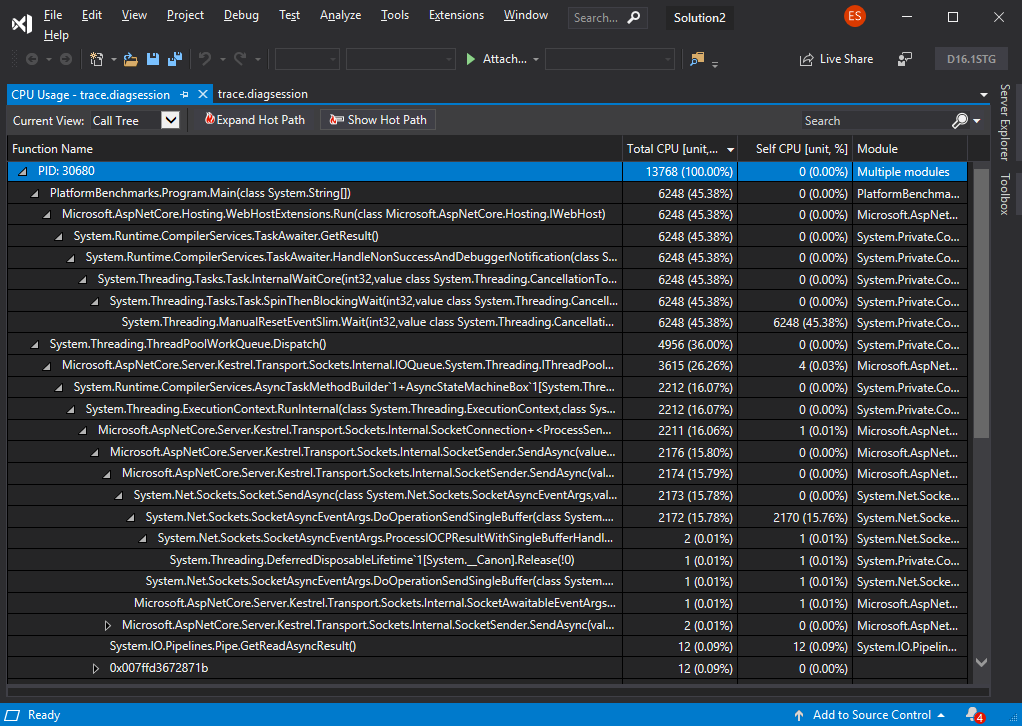
As a result of running dotnet trace you are presented with a .netperf file. This file contains both the runtime events and sampled CPU stacks that can be visualized in perfview. The next update of Visual Studio (16.1) will also add support for visualizing these traces.

VS visualization

If you’re running on OS X or Linux when you capture a trace, you can choose to convert these .netperf files to .speedscope.json files that can be visualized with Speedscope.app.

You can convert an existing trace by running the following command

dotnet trace convert <input-netperf-file>

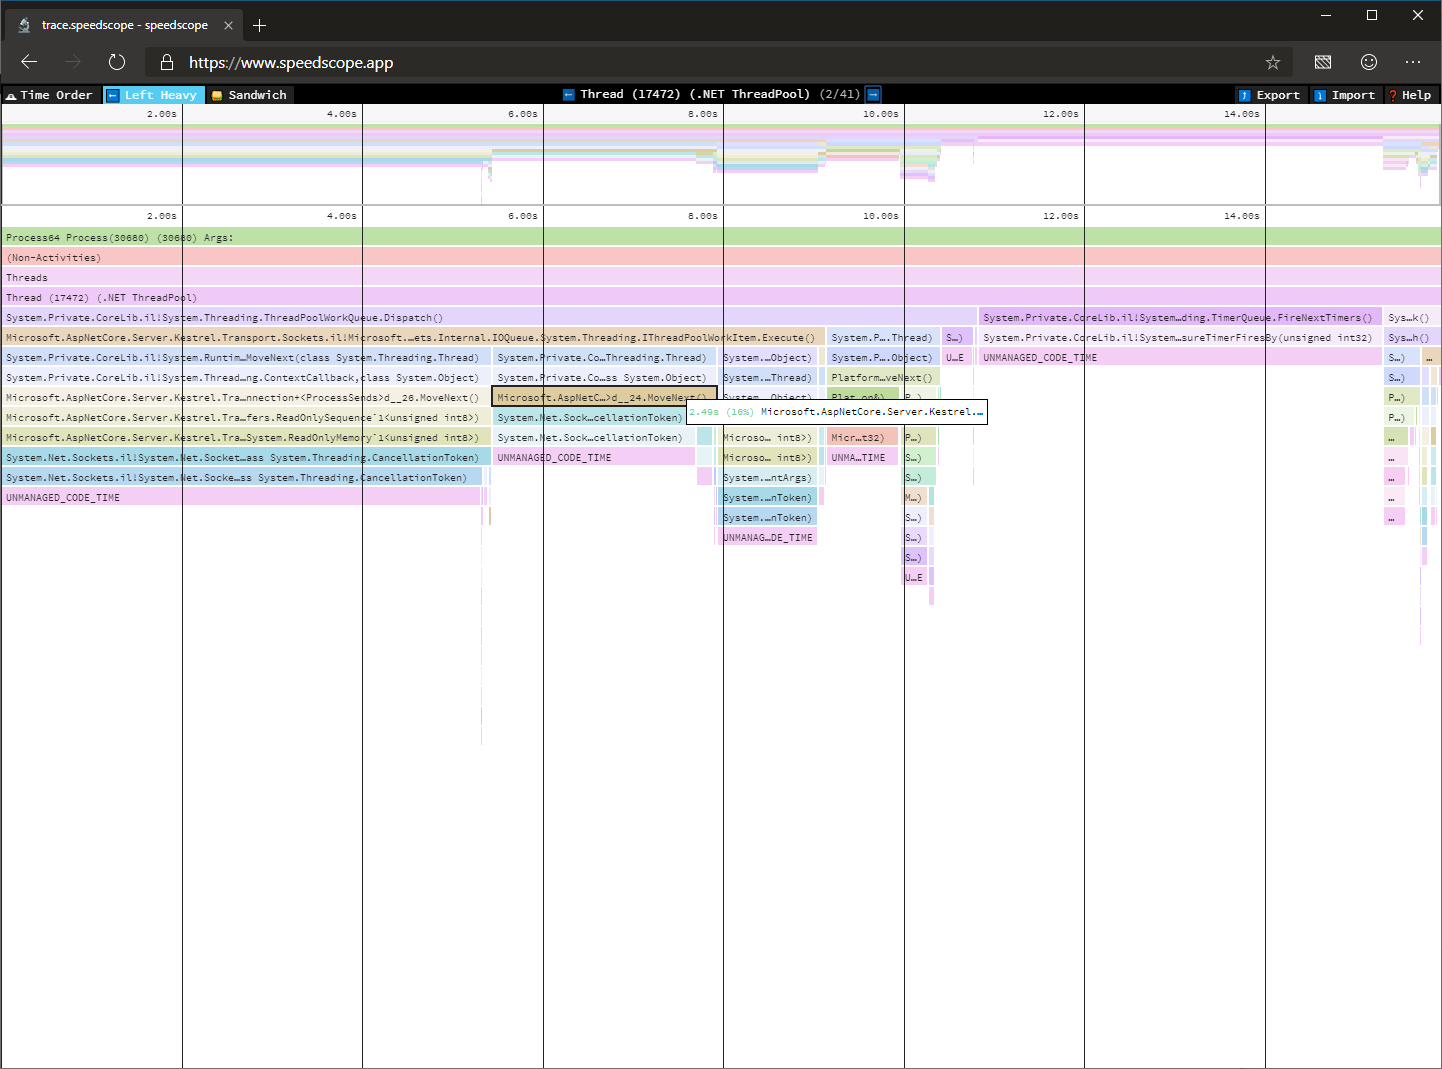
The image below shows the icicle chart visualizing the trace we just captured in speedscope.

icicle

For detailed instructions on how to use this tool, look at the dotnet-trace readme. For known limitations with dotnet-trace, look at the open issues on GitHub.

Why did my application crash?

In some cases, it is not possible to ascertain what caused anomalous behavior by just tracing the process. In the event that the process crashed or situations where we may need more information like access to entire process heap, a process dump may be more suitable for analysis.

Dump Analysis

A dump is a recording of the state of working virtual memory of a process usually captured when the process has terminated unexpectedly. Diagnosing core dump is commonly used to identify the causes of application crashes or unexpected behavior.

Traditionally, you relied on your operating system to capture a dump on application crash (e.g., Windows Error Reporting) or used a tool like procdump to capture a dump when certain trigger criteria are met.

The challenge thus far with capturing dumps with .NET on Linux was capturing dumps with gcore or a debugger resulted extremely large dumps as the existing tools didn’t know what virtual memory pages to trim in a .NET Core process.

Additionally, it was challenging to analyze these dumps even after you had collected them as it required acquiring a debugger and configuring it to load sos, a debugger extension for .NET.

dotnet-dump

3.0.0-preview5, we’re introducing a new tool that allows you to capture and analyze process dumps on both Windows and Linux.

dotnet-dump is still under active development and the table below shows what functionality is currently supported on what operating systems.

Windows OS X Linux
Collect
✅
❌
✅
Analyze
❌
❌
✅

You can install this .NET global tool by running the following command

dotnet tool install --global dotnet-dump --version 1.0.3-preview5.19251.2

Once you’ve installed dotnet dump, you can capture a process dump by running the following command

sudo $HOME/.dotnet/tools/dotnet-dump collect -p <pid>

On Linux, the resulting dump can be analyzed by loading the resulting dump by running the following command

dotnet dump analyze <dump-name>

In the following example, I try to determine ASP.NET Core Hosting Environment of a crashed dump by walking the heap.

For detailed instructions on how to use this tool, look at the dotnet-dump readme. For known limitations with dotnet-dump, look at the open issues on GitHub.

Closing

Thanks for trying out the new diagnostics tools in .NET Core 3.0. Please continue to give us feedback, either in the comments or on GitHub. We are listening carefully and will continue to make changes based on your feedback.

The post Introducing diagnostics improvements in .NET Core 3.0 appeared first on .NET Blog.

AddressSanitizer (ASan) for the Linux Workload in Visual Studio 2019

$
0
0

In Visual Studio 2019 version 16.1 Preview 3 we have integrated AddressSanitizer (ASan) into Visual Studio for Linux projects. ASan is a runtime memory error detector for C/C++ that catches the following errors:

  • Use after free (dangling pointer reference)
  • Heap buffer overflow
  • Stack buffer overflow
  • Use after return
  • Use after scope
  • Initialization order bugs

You can enable ASan for MSBuild-based Linux projects and CMake projects that target a remote Linux system or WSL (Windows Subsystem for Linux). If you are just getting started with cross-platform development, I recommend following this walk-through to get started with Visual Studio’s native support for WSL.

ASan detects errors that are encountered during program execution and stops execution on the first detected error. When you run a program that has ASan enabled under the debugger, you will see the following error message (detailing the type of error and location) at the line where the error occurred:

AddressSanitizer error

You can also view the full ASan output (including where the corrupted memory was allocated/deallocated) in the Debug pane of the output window.

Getting started with ASan in Visual Studio

In order to use ASan in Visual Studio, you need to install the debug symbols for ASan (libasan-dbg) on your remote Linux machine or WSL installation. The version of libasan-dbg that you load depends on the version of GCC you have installed on your Linux machine:

ASan version GCC version
libasan0 gcc-4.8
libasan2 gcc-5
libasan3 gcc-6
libasan4 gcc-7
libasan5 gcc-8


You can determine the version of GCC you have on your Linux machine or WSL installation with the following command:

gcc --version

You can also view the version of libasan-dbg you will need by looking at the Debug pane of the output window. The version of ASan that is loaded corresponds to the version of libasan-dbg you will need on your Linux machine. You can search for the following line (ctrl + F) in the Debug pane of the output window:

Loaded '/usr/lib/x86_64-linux-gnu/libasan.so.4'. Symbols loaded.

In this example, my Linux machine (Ubuntu 18.04) is using libasan4.

You can install the ASan debug bits on Linux distros that use apt with the following command (this command installs version 4):

sudo apt-get install libasan4-dbg

If you have enabled ASan in Visual Studio, then we will prompt you to install the debug symbols for ASan at the top of the Debug pane of the output window.

Enable ASan for MSBuild-based Linux projects

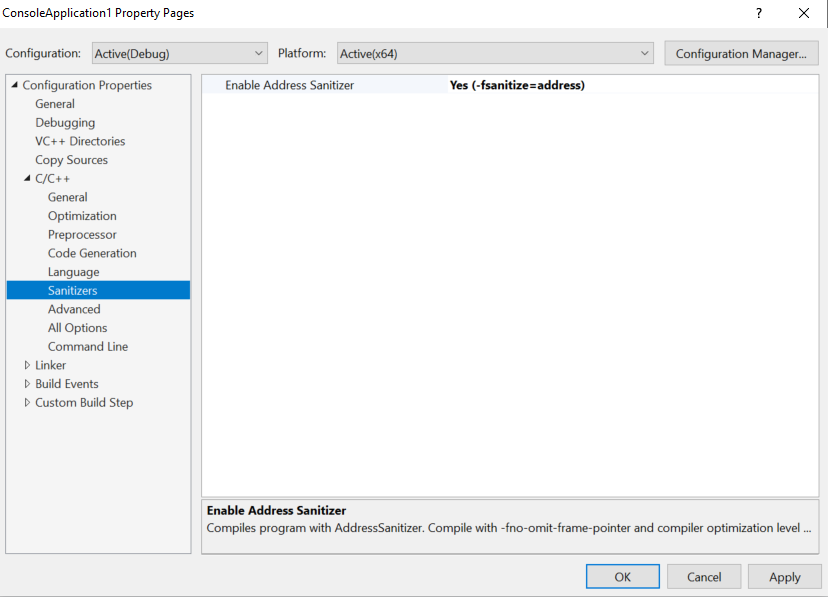
You can enable ASan for MSBuild-based Linux projects in the project’s Property Pages. Right-click on the project in the Solution Explorer and select “Properties” to open the project’s Property Pages, then navigate to Configuration Properties > C/C++ > Sanitizers. ASan is enabled via compiler and linker flags and requires recompilation in order to work.

Enable ASan for MSBuild-based projects via the project's Property Pages

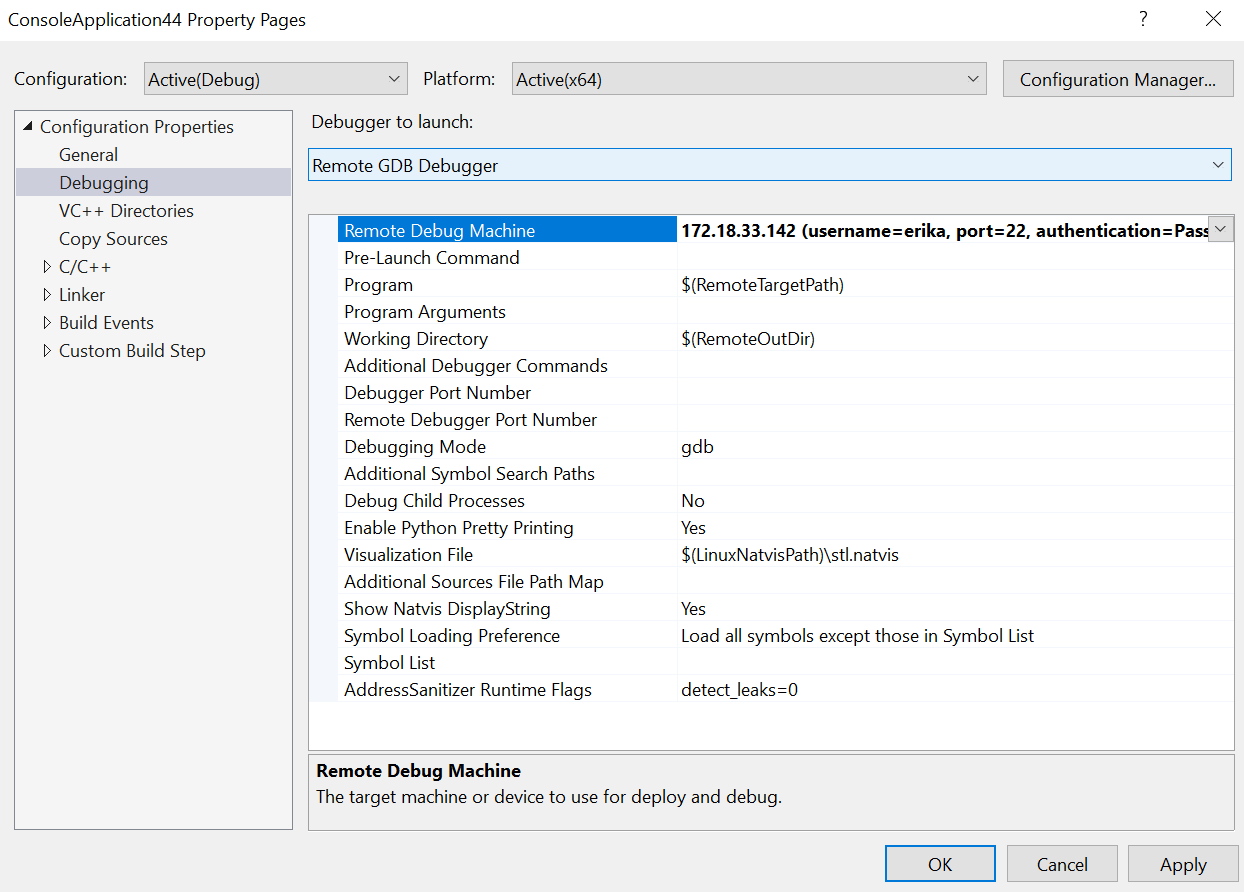
You can also pass optional ASan runtime flags by navigating to Configuration Properties > Debugging > AddressSanitizer Runtime Flags.

Enable ASan for Visual Studio CMake projects

You can enable ASan for CMake configurations targeting a remote Linux machine or WSL in the CMake Settings Editor. In the “General” section of the editor you will see the following two properties to enable ASan and pass optional runtime flags: Enable ASan for CMake projects via the CMake Settings Editor

Again, ASan is enabled via compiler and linker flags and requires recompilation in order to work.

Give us your feedback!

If you have feedback on ASan for the Linux Workload or anything regarding our Linux support in Visual Studio, we would love to hear from you. We can be reached via the comments below or via email (visualcpp@microsoft.com). If you encounter other problems with Visual Studio or MSVC or have a suggestion, you can use the Report a Problem tool in Visual Studio or head over to Visual Studio Developer Community. You can also find us on Twitter (@VisualC) and (@erikasweet_).

The post AddressSanitizer (ASan) for the Linux Workload in Visual Studio 2019 appeared first on C++ Team Blog.

Pay-per-GB pricing and more Azure Artifacts updates

$
0
0

Azure Artifacts is the one place for all of the packages, binaries, tools, and scripts your software team needs. It’s part of Azure DevOps, a suite of tools that helps teams plan, build, and ship software. For Microsoft Build 2019, we’re excited to announce some long-requested changes to the service.

Until now, a separate, additional license was required for anyone using Azure Artifacts, beyond the Azure DevOps Basic license. We heard your feedback that this was inflexible, hard to manage, and often not cost-effective, and we’ve removed it. Now, Azure Artifacts charges only for the storage you use, so that every user in your organization can access and share packages.

Every organization gets 2 GB of free storage. Additional storage usage is charged according to tiered rates starting at $2 per GB and decreasing to $0.25 per GB. Full details can be found on our pricing page.

Python and Universal Packages are GA

We’ve had support for Python packages, as well as our own Universal Packages, in public preview for some time. As of now, both are generally available and ready for all of your production workloads.

What’s next: public feeds

If you’re developing an open source project using a public Azure Repo or a repo on GitHub, you might want to share nightly or pre-release versions of your packages with your project team. Azure Artifacts public feeds will enable you to do just that, backed by the same scale and reliability guarantees as the private feeds you use for internal development. Interested in joining the preview? Get in touch (@alexmullans on Twitter).

Capabilities of Azure Artifacts

With Azure Artifacts, your teams can manage all of their artifacts in one place, with easy-to-configure permissions that help you share packages across the entire organization, or just with people you choose. Azure Artifacts hosts common package types:

  • Maven (for Java development)
  • npm (for Node.js and JavaScript development)
  • NuGet (for .NET, C#, etc. development)
  • Python

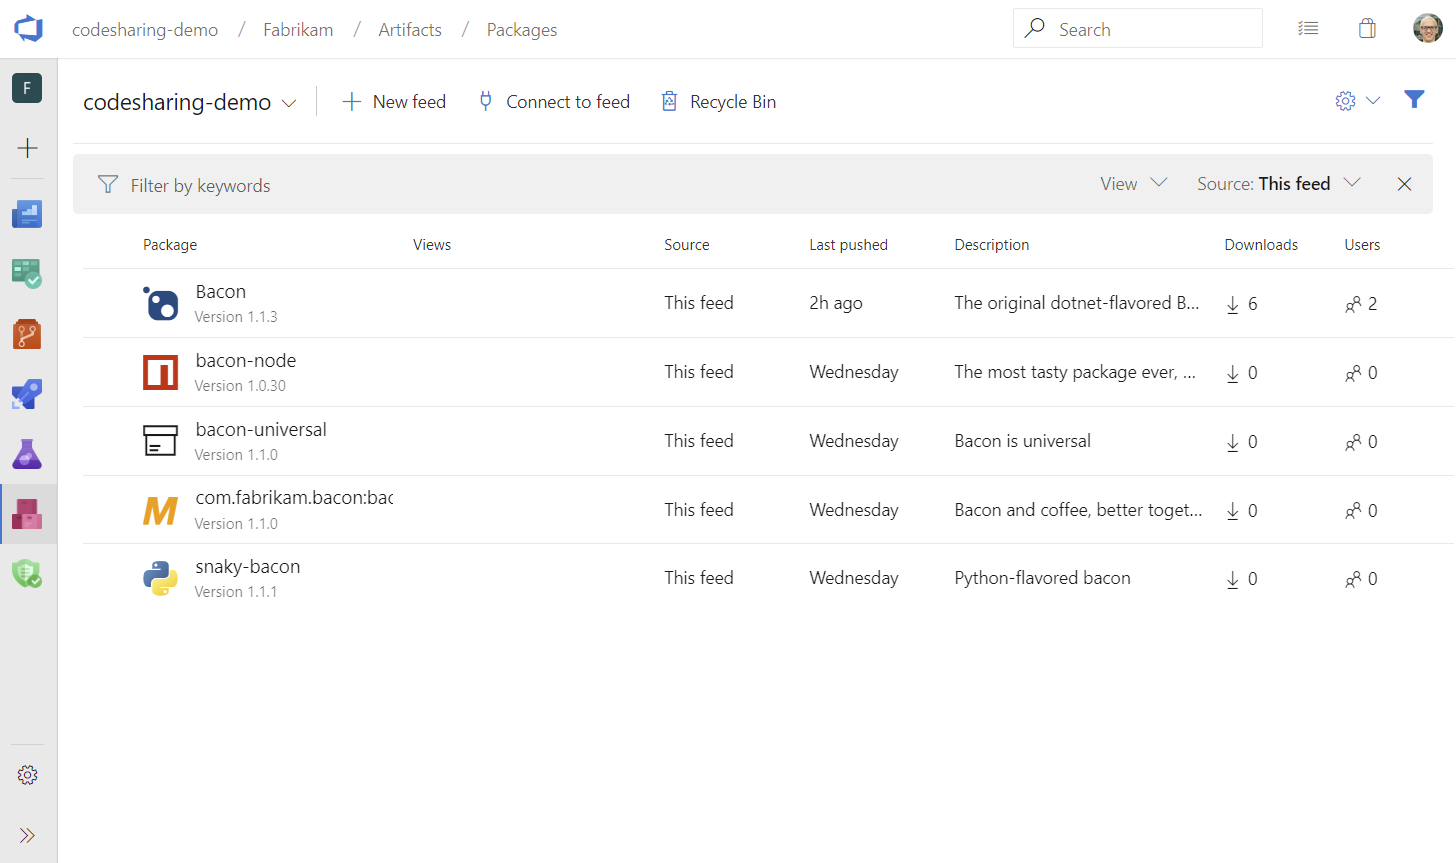
Screenshot of Azure Artifacts

If none of those are what you need, Azure Artifacts provides Universal Packages, an easy-to-use and lightweight package format that can take any file or set of files and version them as a single entity. Universal Packages are fast, using deduplication to minimize the amount of content you upload to the service.

Azure Artifacts is also a symbol server. Publishing your symbols to Azure Artifacts enables engineers in the next room or on the next continent to easily debug the packages you share.

Artifacts are most commonly used as part of DevOps processes and pipelines, so we’ve naturally integrated Azure Artifacts with Azure Pipelines. It’s easy to consume and publish packages to Azure Artifacts in your builds and releases.

We’re excited for you to try Azure Artifacts. If you’ve got questions, comments, or feature suggestions, get in touch on Twitter (@alexmullans) or leave a comment.

The post Pay-per-GB pricing and more Azure Artifacts updates appeared first on Azure DevOps Blog.

Announcing Entity Framework 6.3 Preview with .NET Core Support

$
0
0

The first preview of the EF 6.3 runtime is now available in NuGet.

Note that the package is versioned as 6.3.0-preview5. We plan to continue releasing previews of EF 6.3 every month in alignment with the .NET Core 3.0 previews, until we ship the final version.

What is new in EF 6.3?

While Entity Framework Core was built from the ground up to work on .NET Core, 6.3 will be the first version of EF 6 that can run on .NET Core and work cross-platform. In fact, the main goal of this release is to facilitate migrating existing applications that use EF 6 to .NET Core 3.0.

When completed, EF 6.3 will also have support for:

  • NuGet PackageReferences (this implies working smoothly without any EF entries in application config files)
  • Migration commands running on projects using the the new .NET project system

Besides these improvements, around 10 other bug fixes and community contributions are included in this preview that apply when running on both .NET Core and .NET Framework. You can see a list of fixed issues in our issue tracker.

Known limitations

Although this preview makes it possible to start using the EF 6 runtime on .NET Core 3.0, it still has major limitations. For example:

  • Migration commands cannot be executed on projects not targeting .NET Framework.
  • There is no EF designer support for projects not targeting .NET Framework.
  • There is no support for building and running with models based on EDMX files on .NET Core. On .NET Framework, this depends on a build task that splits and embeds the contents of the EDMX file into the final executable file, and that task is not available for .NET Core.
  • Running code first projects in .NET Core is easier but still requires additional steps, like registering DbProviderFactories programmatically, and either passing the connection string explicitly, or setting up a DbConnectionFactory in a DbConfiguration.
  • Only the SQL Server provider, based on System.Data.SqlClient, works on .NET Core. Other EF6 providers with support for .NET Core haven’t been released yet.

Besides these temporary limitations, there will be some longer term limitations on .NET Core:

  • We have no plans to support the SQL Server Compact provider on .NET Core. There is no ADO.NET provider for SQL Server Compact on .NET Core.
  • SQL Server spatial types and HierarchyID aren’t available on .NET Core.

Getting started using EF 6.3 on .NET Core 3.0

You will need to download and install the .NET Core 3.0 preview 5 SDK. Once you have done that, you can use Visual Studio to create a Console .NET Core 3.0 application and install the EF 6.3 preview package from NuGet:

PM> Install-Package EntityFramework -pre

Next, edit the Program.cs file in the application to look like this:

using System;
using System.Linq;
using System.Data.Entity;
using System.Data.Common;
using System.Data.SqlClient;

namespace TryEF6OnCore
{
    class Program
    {
        static void Main(string[] args)
        {
            var cs = @"server=(localdb)mssqllocaldb; database=MyContext; Integrated Security=true";

            // workaround:
            DbProviderFactories.RegisterFactory("System.Data.SqlClient", SqlClientFactory.Instance);

            using (var db = new MyContext(cs))
            {

                db.Database.CreateIfNotExists();
                db.People.Add(new Person { Name = "Diego" });
                db.SaveChanges();
            }

            using (var db = new MyContext(cs))
            {
                Console.WriteLine($"{db.People.First()?.Name} wrote this sample");
            }
        }
    }

    public class MyContext : DbContext
    {
        public MyContext(string nameOrConnectionString) : base(nameOrConnectionString)
        {
        }

        public DbSet People { get; set; }
    }

    public class Person
    {
        public int Id { get; set; }
        public string Name { get; set; }
    }

}

Closing

We would like to encourage you to download the preview package and try the code first experience on .NET Core and the complete set of scenarios on .NET Framework. Please, report any issues you find to our issue tracker.

The post Announcing Entity Framework 6.3 Preview with .NET Core Support appeared first on .NET Blog.

Introducing the new Microsoft.Data.SqlClient

$
0
0

Those of you who have been following .NET development closely have very likely seen Scott Hunter’s latest blog post, .NET Core is the Future of .NET. The change in focus of .NET Framework towards stability and new feature development moving to .NET Core means SQL Server needs to change in order to continue to provide the latest SQL features to .NET developers in the same timely manner that we have done in the past.

System.Data.SqlClient is the ADO.NET provider you use to access SQL Server or Azure SQL Databases. Historically SQL has used System.Data.SqlClient in .NET Framework as the starting point for client-side development when proving our new SQL features, and then propagating those designs to other drivers. We would still like to do this going forward but at the same time those same new features should be available in .NET Core, too.

Right now, we have two code bases and two different ways SqlClient is delivered to an application. In .NET Framework, versions are installed globally in Windows. In .NET Core, an application can pick a specific SqlClient version and ship with that. Wouldn’t it be nice if the .NET Core model of SqlClient delivery worked for .NET Framework, too?

We couldn’t just ship a new package that replaces System.Data.SqlClient. That would conflict with what lives inside .NET Framework now. Which brings us to our chosen solution…

Microsoft.Data.SqlClient

The Microsoft.Data.SqlClient package, now available in preview on NuGet, will be the flagship data access driver for SQL Server going forward.

This new package supports both .NET Core and .NET Framework. Creating a new SqlClient in a new namespace allows both the old System.Data.SqlClient and new Microsoft.Data.SqlClient to live side-by-side. While not automatic, there is a pretty straightforward path for applications to move from the old to the new. Simply add a NuGet dependency on Microsoft.Data.SqlClient and update any using references or qualified references.

In keeping with our plans to accelerate feature delivery in this new model, we are happy to offer support for two new SQL Server features on both .NET Framework and .NET Core, along with bug fixes and performance improvements:

  • Data Classification – Available in Azure SQL Database and Microsoft SQL Server 2019 since CTP 2.0.
  • UTF-8 support – Available in Microsoft SQL Server SQL Server 2019 since CTP 2.3.

Likewise, we have updated the .NET Core version of the provider with the long awaited support for Always Encrypted, including support for Enclaves:

  • Always Encrypted is available in Microsoft SQL Server 2016 and higher.
  • Enclave support was introduced in Microsoft SQL Server 2019 CTP 2.0.

The binaries in the new package are based on the same code from System.Data.SqlClient in .NET Core and .NET Framework. This means there are multiple binaries in the package. In addition to the different binaries you would expect for supporting different operating systems, there are different binaries when you target .NET Framework versus when you target .NET Core. There was no magic code merge behind the scenes: we still have divergent code bases from .NET Framework and .NET Core (for now). This also means we still have divergent feature support between SqlClient targeting .NET Framework and SqlClient targeting .NET Core. If you want to migrate from .NET Framework to .NET Core but you are blocked because .NET Core does not yet support a feature (aside from Always Encrypted), the first preview release may not change that. But our top priority is bringing feature parity across those targets.

What is the roadmap for Microsoft.Data.SqlClient?

Our roadmap has more frequent releases lighting up features in Core as fast as we can implement them. The long-term goal is a single code base and it will come to that over time, but the immediate need is feature support in SqlClient on .NET Core, so that is what we are focusing on, while still being able to deliver new SQL features to .NET Framework applications, too.

Feature Roadmap Engineering Roadmap
– Azure Active Directory authentication providers (Core) – Merge .NET Framework and .NET Core code bases
– Active Directory Password – Open source assembly
– Managed Service Identity – Move to GitHub
– Active Directory Integrated


While we do not have dates for the above features, our goal is to have multiple releases throughout 2019. We anticipate Microsoft.Data.SqlClient moving from Preview to general availability sometime prior to the RTM releases of both SQL Server 2019 and .NET Core 3.0.

What does this mean for System.Data.SqlClient?

It means the development focus has changed. We have no intention of dropping support for System.Data.SqlClient any time soon. It will remain as-is and we will fix important bugs and security issues as they arise. If you have a typical application that doesn’t use any of the newest SQL features, then you will still be well served by a stable and reliable System.Data.SqlClient for many years.

However, Microsoft.Data.SqlClient will be the only place we will be implementing new features going forward. We would encourage you to evaluate your needs and options and choose the right time for you to migrate your application or library from System.Data.SqlClient to Microsoft.Data.SqlClient.

Closing

Please, try the preview bits by installing the Microsoft.Data.SqlClient package. We want to hear from you! Although we haven’t finished preparing the source code for publishing, you can already use the issue tracker at https://github.com/dotnet/SqlClient to report any issues.

Keep in mind that object-relational mappers such as EF Core, EF 6, or Dapper, and other non-Microsoft libraries, haven’t yet made the transition to the new provider, so you won’t be able to use the new features through any of these libraries. An updated versions of EF Core with support for Microsoft.Data.SqlClient are expected in an upcoming preview.

We also encourage you to visit our Frequently Asked Questions and Release Notes pages in our GitHub repository. They contain additional information about the features available, how to get started, and our plans for the release.

This post was written by Vicky Harp, Program Manager on SqlClient and SQL Server Tools.

The post Introducing the new Microsoft.Data.SqlClient appeared first on .NET Blog.


Simplifying AI with automated ML no-code web interface

Take your machine learning models to production with new MLOps capabilities

$
0
0

This blog post was authored by Jordan Edwards, Senior Program Manager, Microsoft Azure.

At Microsoft Build 2019 we announced MLOps capabilities in Azure Machine Learning service. MLOps, also known as DevOps for machine learning, is the practice of collaboration and communication between data scientists and DevOps professionals to help manage the production of the machine learning (ML) lifecycle.

Azure Machine Learning service’s MLOps capabilities provide customers with asset management and orchestration services, enabling effective ML lifecycle management. With this announcement, Azure is reaffirming its commitment to help customers safely bring their machine learning models to production and solve their business’s key problems faster and more accurately than ever before.

 
Quote from Eric Boyed, VP of C+AI - "We have heard from customers everywhere that they want to adopt ML but struggle to actually get modles into production. With the new MLOps capabilities in Azure Machine Learning, bringing ML to add calue to your business has become better, faster, and more reliable than ever before."

An Image showing Azure MLOps.


Here is a quick look at some of the new features:

Azure Machine Learning Command Line Interface (CLI) 

Azure Machine Learning’s management plane has historically been via the Python SDK. With the new Azure Machine Learning CLI, you can easily perform a variety of automated tasks against the ML workspace including:

  • Compute target management
  • Experiment submission
  • Model registration and deployment

Management capabilities

Azure Machine Learning service introduced new capabilities to help manage the code, data, and environments used in your ML lifecycle.

An Image showing the ML lifecycle: Train Model to Package Model to Validate Model to Deploy Model to Monitor Model, to Retrain Model.

Code management

Git repositories are commonly used in industry for source control management and as key assets in the software development lifecycle. We are including our first version of Git repository tracking – any time you submit code artifacts to Azure Machine Learning service, you can specify a Git repository reference. This is done automatically when you are running from a CI/CD solution such as Azure Pipelines.

Data set management

With Azure Machine Learning data sets you can version, profile, and snapshot your data to enable you to reproduce your training process by having access to the same data. You can also compare data set profiles and determine how much your data has changed or if you need to retrain your model.

Environment management

Azure Machine Learning Environments are shared across Azure Machine Learning scenarios, from data preparation to model training to inferencing. Shared environments help to simplify handoff from training to inferencing as well as the ability to reproduce a training environment locally.

Environments provide automatic Docker image management (and caching!), plus tracking to streamline reproducibility.

Simplified model debugging and deployment

Some data scientists have difficulty getting an ML model prepared to run in a production system. To alleviate this, we have introduced new capabilities to help you package and debug your ML models locally, prior to pushing them to the cloud. This should greatly reduce the inner loop time required to iterate and arrive at a satisfactory inferencing service, prior to the packaged model reaching the datacenter.

Model validation and profiling 

Another challenge that data scientists commonly face is guaranteeing that models will perform as expected once they are deployed to the cloud or the edge. With the new model validation and profiling capabilities, you can provide sample input queries to your model. We will automatically deploy and test the packaged model on a variety of inference CPU/memory configurations to determine the optimal performance profile. We also check that the inference service is responding correctly to these types of queries.

Model interpretability

Data scientists want to know why models predict in a specific manner. With the new model interpretability capabilities, we can explain why a model is behaving a certain way during both training and inferencing.

ML audit trail

Azure Machine Learning is used for managing all of the artifacts in your model training and deployment process. With new audit trail capabilities, we are enabling automatic tracking of the experiments and datasets that corresponds to your registered ML model. This helps to answer the question, “What code/data was used to create this model?”

Azure DevOps extension for machine learning

Azure DevOps provides commonly used tools data scientists leverage to manage code, work items, and CI/CD pipelines. With the Azure DevOps extension for machine learning, we are introducing new capabilities to make it easy to manage your ML CI/CD pipelines with the same tools you use for software development processes. The extension includes the abilities to trigger Azure Pipelines release on model registration, easily connect an Azure Machine Learning Workspace to an Azure DevOps project, and perform a series of tasks designed to help interaction with Azure Machine Learning as easy as possible from the existing automation tooling.

Get started today

These new MLOps features in the Azure Machine Learning service aim to enable users to bring their ML scenarios to production by supporting reproducibility, auditability, and automation of the end-to-end ML lifecycle. We’ll be publishing more blogs that go in-depth with these features in the following weeks, so follow along for the latest updates and releases.

Windows 10 SDK Preview Build 18890 available now!

$
0
0

Today, we released a new Windows 10 Preview Build of the SDK to be used in conjunction with Windows 10 Insider Preview (Build 18890 or greater). The Preview SDK Build 18890 contains bug fixes and under development changes to the API surface area.

The Preview SDK can be downloaded from the developer section on Windows Insider.

For feedback and updates to the known issues, please see the developer forum. For new developer feature requests, head over to our Windows Platform UserVoice.

Things to note:

  • This build works in conjunction with previously released SDKs and Visual Studio 2017 and 2019. You can install this SDK and still also continue to submit your apps that target Windows 10 build 1903 or earlier to the Microsoft Store.
  • The Windows SDK will now formally only be supported by Visual Studio 2017 and greater. You can download the Visual Studio 2019 here.
  • This build of the Windows SDK will install ONLY on Windows 10 Insider Preview builds.
  • In order to assist with script access to the SDK, the ISO will also be able to be accessed through the following static URL: https://software-download.microsoft.com/download/sg/Windows_InsiderPreview_SDK_en-us_18890_1.iso.

Tools Updates

Message Compiler (mc.exe)

  • Now detects the Unicode byte order mark (BOM) in .mc files. If the If the .mc file starts with a UTF-8 BOM, it will be read as a UTF-8 file. If it starts with a UTF-16LE BOM, it will be read as a UTF-16LE file. Otherwise, if the -u parameter was specified, it will be read as a UTF-16LE file. Otherwise, it will be read using the current code page (CP_ACP).
  • Now avoids one-definition-rule (ODR) problems in MC-generated C/C++ ETW helpers caused by conflicting configuration macros (e.g. when two .cpp files with conflicting definitions of MCGEN_EVENTWRITETRANSFER are linked into the same binary, the MC-generated ETW helpers will now respect the definition of MCGEN_EVENTWRITETRANSFER in each .cpp file instead of arbitrarily picking one or the other).

Windows Trace Preprocessor (tracewpp.exe)

  • Now supports Unicode input (.ini, .tpl, and source code) files. Input files starting with a UTF-8 or UTF-16 byte order mark (BOM) will be read as Unicode. Input files that do not start with a BOM will be read using the current code page (CP_ACP). For backwards-compatibility, if the -UnicodeIgnore command-line parameter is specified, files starting with a UTF-16 BOM will be treated as empty.
  • Now supports Unicode output (.tmh) files. By default, output files will be encoded using the current code page (CP_ACP). Use command-line parameters -cp:UTF-8 or -cp:UTF-16 to generate Unicode output files.
  • Behavior change: tracewpp now converts all input text to Unicode, performs processing in Unicode, and converts output text to the specified output encoding. Earlier versions of tracewpp avoided Unicode conversions and performed text processing assuming a single-byte character set. This may lead to behavior changes in cases where the input files do not conform to the current code page. In cases where this is a problem, consider converting the input files to UTF-8 (with BOM) and/or using the -cp:UTF-8 command-line parameter to avoid encoding ambiguity.

TraceLoggingProvider.h

  • Now avoids one-definition-rule (ODR) problems caused by conflicting configuration macros (e.g. when two .cpp files with conflicting definitions of TLG_EVENT_WRITE_TRANSFER are linked into the same binary, the TraceLoggingProvider.h helpers will now respect the definition of TLG_EVENT_WRITE_TRANSFER in each .cpp file instead of arbitrarily picking one or the other).
  • In C++ code, the TraceLoggingWrite macro has been updated to enable better code sharing between similar events using variadic templates.

Breaking Changes

Removal of IRPROPS.LIB

In this release irprops.lib has been removed from the Windows SDK. Apps that were linking against irprops.lib can switch to bthprops.lib as a drop-in replacement.

API Updates, Additions and Removals

The following APIs have been added to the platform since the release of Windows 10 SDK, version 1903, build 18362.

Additions:


namespace Windows.Foundation.Metadata {
  public sealed class AttributeNameAttribute : Attribute
  public sealed class FastAbiAttribute : Attribute
  public sealed class NoExceptionAttribute : Attribute
}
namespace Windows.UI.Composition.Particles {
  public sealed class ParticleAttractor : CompositionObject
  public sealed class ParticleAttractorCollection : CompositionObject, IIterable<ParticleAttractor>, IVector<ParticleAttractor>
  public class ParticleBaseBehavior : CompositionObject
  public sealed class ParticleBehaviors : CompositionObject
  public sealed class ParticleColorBehavior : ParticleBaseBehavior
  public struct ParticleColorBinding
  public sealed class ParticleColorBindingCollection : CompositionObject, IIterable<IKeyValuePair<float, ParticleColorBinding>>, IMap<float, ParticleColorBinding>
  public enum ParticleEmitFrom
  public sealed class ParticleEmitterVisual : ContainerVisual
  public sealed class ParticleGenerator : CompositionObject
  public enum ParticleInputSource
  public enum ParticleReferenceFrame
  public sealed class ParticleScalarBehavior : ParticleBaseBehavior
  public struct ParticleScalarBinding
  public sealed class ParticleScalarBindingCollection : CompositionObject, IIterable<IKeyValuePair<float, ParticleScalarBinding>>, IMap<float, ParticleScalarBinding>
  public enum ParticleSortMode
  public sealed class ParticleVector2Behavior : ParticleBaseBehavior
  public struct ParticleVector2Binding
  public sealed class ParticleVector2BindingCollection : CompositionObject, IIterable<IKeyValuePair<float, ParticleVector2Binding>>, IMap<float, ParticleVector2Binding>
  public sealed class ParticleVector3Behavior : ParticleBaseBehavior
  public struct ParticleVector3Binding
  public sealed class ParticleVector3BindingCollection : CompositionObject, IIterable<IKeyValuePair<float, ParticleVector3Binding>>, IMap<float, ParticleVector3Binding>
  public sealed class ParticleVector4Behavior : ParticleBaseBehavior
  public struct ParticleVector4Binding
  public sealed class ParticleVector4BindingCollection : CompositionObject, IIterable<IKeyValuePair<float, ParticleVector4Binding>>, IMap<float, ParticleVector4Binding>
}

The post Windows 10 SDK Preview Build 18890 available now! appeared first on Windows Developer Blog.

Announcing TraceProcessor Preview 0.1.0

$
0
0

Process ETW traces in .NET.

Background

Event Tracing for Windows (ETW) is a powerful trace collection system built-in to the Windows operating system. Windows has deep integration with ETW, including data on system behavior all the way down to the kernel for events like context switches, memory allocation, process create and exit, and many more. The system-wide data available from ETW makes it a good fit for end-to-end performance analysis or other questions that require looking at the interaction between by many components throughout the system.

Unlike text logging, ETW provides structured events designed for automated data processing. Microsoft has built powerful tools on top of these structured events, including Windows Performance Analyzer (WPA), which provides a graphical interface for visualizing and exploring the trace data captured in a ETW trace file (.etl).

Inside Microsoft, we heavily use ETW traces to measure the performance of new builds of Windows. Given the volume of data produced the Windows engineering system, automated analysis is essential. For our automated trace analysis, we heavily use C# and .NET, so we created a package that provides a .NET API for accessing many kinds of ETW trace data. This technology is also used inside Windows Performance Analyzer to power several of its tables. We are happy to release a preview of this package that we use to analyze Windows so that you can use it to analyze your own applications and systems as well.

Getting Started

This package is available from NuGet with the following package ID:

Microsoft.Windows.EventTracing.Processing.All

After installing this package, the following console application lists all the process command lines in a trace:


using Microsoft.Windows.EventTracing;
using Microsoft.Windows.EventTracing.Processes;
using System;

class Program
{
    static void Main(string[] args)
    {
        if (args.Length != 1)
        {
            Console.Error.WriteLine("Usage: <trace.etl>");
            return;
        }

        using (ITraceProcessor trace = TraceProcessor.Create(args[0]))
        {
            IPendingResult<IProcessDataSource> pendingProcessData = trace.UseProcesses();
            trace.Process();
            IProcessDataSource processData = pendingProcessData.Result;

            foreach (IProcess process in processData.Processes)
            {
                Console.WriteLine(process.CommandLine);
            }
        }
    }
}

The core interface is ITraceProcessor, and using this interface follows a pattern of first, tell the processor what data you want to use from a trace; second, process the trace; and finally, access the results. Telling the processor what kinds of data you want up front means you do not need to spend time processing large volumes of all possible kinds of trace data. Instead, TraceProcessor just does the work needed to provide the specific kinds of data you request.

Data Sources

Process information is just one of many kinds of data that can be stored in an ETW trace. Note that which data is in an .etl file depends on what providers were enabled when the trace was captured. The following list shows the kinds of trace data available from TraceProcessor:

Code

Description

Related WPA Items

trace.UseClassicEvents() Provides classic ETW events from a trace, which do not include schema information. Generic Events table (when Event Type is Classic or WPP)
trace.UseConnectedStandbyData() Provides data from a trace about the system entering and exiting connected standby. CS Summary table
trace.UseCpuIdleStates() Provides data from a trace about CPU C-states. CPU Idle States table (when Type is Actual)
trace.UseCpuSamplingData() Provides data from a trace about CPU usage based on periodic sampling of the instruction pointer. CPU Usage (Sampled) table
trace.UseCpuSchedulingData() Provides data from a trace about CPU thread scheduling, including context switches and ready thread events. CPU Usage (Precise) table
trace.UseDevicePowerData() Provides data from a trace about device D-states. Device DState table
trace.UseDirectXData() Provides data from a trace about DirectX activity. GPU Utilization table
traceUseDiskIOData() Provides data from a trace about Disk I/O activity. Disk Usage table
trace.UseEnergyEstimationData() Provides data from a trace about estimated per-process energy usage from Energy Estimation Engine. Energy Estimation Engine Summary (by Process) table
trace.UseEnergyMeterData() Provides data from a trace about measured energy usage from Energy Meter Interface (EMI). Energy Estimation Engine (by Emi) table
trace.UseFileIOData() Provides data from a trace about File I/O activity. File I/O table
trace.UseGenericEvents() Provides manifested and TraceLogging events from a trace. Generic Events table (when Event Type is Manifested or TraceLogging)
trace.UseHandles() Provides partial data from a trace about active kernel handles. Handles table
trace.UseHardFaults() Provides data from a trace about hard page faults. Hard Faults table
trace.UseHeapSnapshots() Provides data from a trace about process heap usage. Heap Snapshot table
trace.UseHypercalls() Provides data about Hyper-V hypercalls that occured during a trace.
trace.UseImageSections() Provides data from a trace about the sections of an image. Section Name column of the CPU Usage (Sampled) table
trace.UseInterruptHandlingData() Provides data from a trace about Interrupt Service Routine (ISR) and Deferred Procedure Call (DPC) activity. DPC/ISR table
trace.UseMarks() Provides the marks (labeled timestamps) from a trace. Marks table
trace.UseMemoryUtilizationData() Provides data from a trace about total system memory utilization. Memory Utilization table
trace.UseMetadata() Provides trace metadata available without further processing. System Configuration, Traces and General
trace.UsePlatformIdleStates() Provides data from a trace about the target and actual platform idle states of a system. Platform Idle State table
trace.UsePoolAllocations() Provides data from a trace about kernel pool memory usage. Pool Summary table
trace.UsePowerConfigurationData() Provides data from a trace about system power configuration. System Configuration, Power Settings
trace.UsePowerDependencyCoordinatorData() Provides data from a trace about active power dependency coordinator phases. Notification Phase Summary table
trace.UseProcesses() Provides data about processes active during a trace as well as their images and PDBs. Processes table
Images table
Symbols Hub
trace.UseProcessorCounters() Provides data from a trace about processor performance counter values from Processor Counter Monitor (PCM).
trace.UseProcessorFrequencyData() Provides data from a trace about the frequency at which processors ran. Processor Frequency table (when Type is Actual)
trace.UseProcessorProfileData() Provides data from a trace about the active processor power profile. Processor Profiles table
trace.UseProcessorParkingData() Provides data from a trace about which processors were parked or unparked. Processor Parking State table
trace.UseProcessorParkingLimits() Provides data from a trace about the maximum allowed number of unparked processors. Core Parking Cap State table
trace.UseProcessorQualityOfServiceData() Provides data from a trace about the quality of service level for each processor. Processor Qos Class table
trace.UseProcessorThrottlingData() Provides data from a trace about processor maximum frequency throttling. Processor Constraints table
trace.UseReadyBootData() Provides data from a trace about boot prefetching activity from Ready Boot. Ready Boot Events table
trace.UseReferenceSetData() Provides data from a trace about pages of virtual memory used by each process. Reference Set table
trace.UseRegionsOfInterest() Provides named regions of interest intervals from a trace as specified in an xml configuration file. Regions of Interest table
trace.UseRegistryData() Provides data about registry activity during a trace. Registry table
trace.UseResidentSetData() Provides data from a trace about the pages of virtual memory for each process that were resident in physical memory. Resident Set table
trace.UseRundownData() Provides data from a trace about intervals during which trace rundown data collection occurred. Shaded regions in the graph timeline
trace.UseScheduledTasks() Provides data about scheduled tasks that ran during a trace. Scheduled Tasks table
trace.UseServices() Provides data about services that were active or had their state captured during a trace. Services table
System Configuration, Services
trace.UseStacks() Provides data about stacks recorded during a trace. Stacks table
trace.UseStackEvents() Provides data about events associated with stacks recorded during a trace. Stacks table
trace.UseStackTags() Provides a mapper that groups stacks from a trace into stack tags as specified in an XML configuration file. Columns such as Stack Tag and Stack (Frame Tags)
trace.UseSymbols() Provides the ability to load symbols for a trace. Configure Symbol Paths
Load Symbols
trace.UseSyscalls() Provides data about syscalls that occurred during a trace. Syscalls table
trace.UseSystemMetadata() Provides general, system-wide metadata from a trace. System Configuration
trace.UseSystemPowerSourceData() Provides data from a trace about the active system power source (AC vs DC). System Power Source table
trace.UseSystemSleepData() Provides data from a trace about overall system power state. Power Transition table
trace.UseTargetCpuIdleStates() Provides data from a trace about target CPU C-states. CPU Idle States table (when Type is Target)
trace.UseTargetProcessorFrequencyData() Provides data from a trace about target processor frequencies. Processor Frequency table (when Type is Target)
trace.UseThreads() Provides data about threads active during a trace. Thread Lifetimes table
trace.UseTraceStatistics() Provides statistics about the events in a trace. System Configuration, Trace Statistics
trace.UseUtcData() Provides data from a trace about Microsoft telemetry activity using Universal Telemetry Client (UTC). Utc table
trace.UseWindowInFocus() Provides data from a trace about changes to the active UI window in focus. Window in Focus table
trace.UseWindowsTracePreprocessorEvents() Provides Windows software trace preprocessor (WPP) events from a trace. WPP Trace table
Generic Events table (when Event Type is WPP)
trace.UseWinINetData() Provides data from a trace about internet activity via Windows Internet (WinINet). Download Details table
trace.UseWorkingSetData() Provides data from a trace about pages of virtual memory that were in the working set for each process or kernel category. Virtual Memory Snapshots table

Extensibility

Many kinds of trace data have built-in support TraceProcessor, but if you have your other providers that you would like to analyze (including your own custom providers), that data is also available from the trace live while processing occurs.

For example, here is a simple way to get the list of providers IDs in a trace:


HashSet<Guid> providerIds = new HashSet<Guid>();
trace.Use((e) => providerIds.Add(e.ProviderId));
trace.Process();

foreach (Guid providerId in providerIds)
{
    Console.WriteLine(providerId);
}

The following example shows a simplified custom data source:


CustomDataSource customDataSource = new CustomDataSource();
trace.Use(customDataSource);
trace.Process();
Console.WriteLine(customDataSource.Count);

…

class CustomDataSource : IFilteredEventConsumer
{
    public IReadOnlyList<Guid> ProviderIds { get; } = new Guid[] { new Guid("your provider ID") };

    public int Count { get; private set; }

    public void Process(EventContext eventContext)
    {
        ++Count;
    }
}

Feedback

The documentation for TraceProcessor is currently limited to partial IntelliSense support, though we would like to add more reference documentation as well as samples. (Documentation is a work-in-progress).

This release is a preview to gauge interest, so if this package is useful to you, please let us know. We would also appreciate feedback on what areas we invest in further, such as:

  • Expanding IntelliSense documentation
  • Adding TraceProcessor API reference documentation to docs.microsoft.com
  • Adding samples
  • Removing the requirement for msis in the bin directory
  • Adding additional data to TraceProcessor that is currently present in WPA
  • Stabilizing on a GA/v1 release

For questions using this package, you can post on StackOverflow with the tag .net-traceprocessing, and feedback can also be sent via email to traceprocessing@microsoft.com.

The post Announcing TraceProcessor Preview 0.1.0 appeared first on Windows Developer Blog.

What’s new in R 3.6.0

$
0
0

A major update to the open-source R language, R 3.6.0, was released on April 26 and is now available for download for Windows, Mac and Linux. As a major update, it has many new features, user-visible changes and bug fixes. You can read the details in the release announcement, and in this blog post I'll highlight the most significant ones.

Changes to random number generation. R 3.6.0 changes the method used to generate random integers in the sample function. In prior versions, the probability of generating each integer could vary from equal by up to 0.04% (or possibly more if generating more than a million different integers). This change will mainly be relevant to people who do large-scale simulations, and it also means that scripts using the sample function will generate different results in R 3.6.0 than they did in prior versions of R. If you need to keep the results the same (for reproducibility or for automated testing), you can revert to the old behavior by adding RNGkind(sample.kind="Rounding")) to the top of your script.

Changes to R's serialization format. If you want to save R data to disk with R 3.6.0 and read it back with R version 3.4.4 or earlier, you'll need to use readRDS("mydata.Rd",version=2) to save your data in the old serialization format, which has been updated to Version 3 for this release. (The same applies to the functions save, serialize, and byte-compiled R code.)  The R 3.5 series had forwards-compatibility in mind, and can already read data serialized in the Version 3 format.

Improvements to base graphics. You now have more options the appearance of axis labels (and perpendicular labels no longer overlap), better control over text positioning, a formula specification for barplots, and color palettes with better visual perception.

Improvements to package installation and loading, which should eliminate problems with partially-installed packages and reduce the space required for installed packages.

More functions now support vectors with more than 2 billion elements, including which and pmin/pmax.

Various speed improvements to functions including outer, substring, stopifnot, and the $ operator for data frames.

Improvements to statistical functions, including standard errors for T tests and better influence measures for multivariate models.

R now uses less memory, thanks to improvements to functions like drop, unclass and seq to use the ALTREP system to avoid duplicating data.

More control over R's memory usage, including the ability limit the amount of memory R will use for data. (Attempting to exceed this limit will generate a "cannot allocate memory" error.) This is particularly useful when R is being used in production, to limit the impact of a wayward R process on other applications in a shared system.

Better consistency between platforms. This has been an ongoing process, but R now has fewer instances of functions (or function arguments) that are only available on limited platforms (e.g. on Windows but not on Linux). The documentation is now more consistent between platforms, too. This should mean fewer instances of finding R code that doesn't run on your machine because it was written on a different platform.

There are many other specialized changes as well, which you can find in the release notes. Other than the issues raised above, most code from prior versions of R should run fine in R 3.6.0, but you will need to re-install any R packages you use, as they won't carry over from your R 3.5.x installation. Now that a couple of weeks have passed since the release, most packages should be readily available on CRAN for R 3.6.0.

As R enters its 20th year of continuous stable releases, please do take a moment to reflect on the ongoing commitment of the R Core Team for their diligence in improving the R engine multiple times a year. Thank you to everyone who has contributed. If you'd like to support the R project, here's some information on contributing to the R Foundation.

Final note: the code name for R 3.6.0 is "Planting of a Tree". The R code-names generally refer to Peanuts comics: if anyone can identify what the R 3.6.0 codename is referring to, please let us know in the comments!

R-announce mailing list: R 3.6.0 is released

Linux Development with C++ in Visual Studio 2019: WSL, ASan for Linux, Separation of Build and Debug

$
0
0

In Visual Studio 2019 you can target both Windows and Linux from the comfort of a single IDE. In Visual Studio 2019 version 16.1 Preview 3 we announced several new features specific to the Linux Workload: native support for the Windows Subsystem for Linux (WSL), AddressSanitizer integration, and the ability to separate build and debug targets. If you’re just getting started with cross-platform development, I recommend trying our native support for WSL.

Native support for the Windows Subsystem for Linux (WSL)

Visual Studio now provides native support for using C++ with WSL. WSL lets you run a lightweight Linux environment directly on Windows, including most command-line tools, utilities, and applications. In Visual Studio you no longer need to add a remote connection or configure SSH in order to build and debug on your local WSL installation. Check out our post on native support for WSL in Visual Studio to learn more and follow a step-by-step guide on getting started.

AddressSanitizer for the Linux Workload

In Visual Studio 2019 version 16.1 Preview 3 we have integrated AddressSanitizer (ASan) into Visual Studio for Linux projects. ASan is a runtime memory error detector for C/C++. You can enable ASan for MSBuild-based Linux projects and CMake projects that target a remote Linux machine or WSL. Check out our post on AddressSanitizer for the Linux Workload in Visual Studio for more information.

Separate build and debug targets for Linux projects

You can now separate your remote build machine from your remote debug machine for both MSBuild-based Linux projects and CMake projects that target a remote Linux machine. For example, you can now cross-compile on x64 and deploy to an ARM device when targeting IoT scenarios.

For a MSBuild-based Linux project, you can specify a new remote debug machine in the project’s Property Pages (Configuration Properties > Debugging > Remote Debug Machine). By default, this value is synchronized with your remote build machine (Configuration Properties > General > Remote Build Machine).

The drop-down menu is populated with all established remote connections. To add a new remote connection, navigate to Tools > Options > Cross Platform > Connection Manager or search for “Connection Manager” in the search bar at the top of your screen. You can also specify a new remote deploy directory in the project’s Property Pages (Configuration Properties > General > Remote Deploy Directory).

By default, only the files necessary for the process to debug will be deployed to the remote debug machine. You can view/configure which source files will be deployed via the Solution Explorer. When you click on a source file, you will see a preview of its File Properties directly below the Solution Explorer. You can also right-click on a source file and select “Properties.”

The “Content” property specifies whether the file will be deployed to the remote debug machine. You can also disable deployment entirely by navigating to Property Pages > Configuration Manager and unchecking “Deploy” for the desired configuration.

If you want complete control over your project’s deployment (e.g. some files you want to deploy are outside of your solution or you want to customize your remote deploy directory per file/directory), then you can append the following code block(s) to your .vcxproj file:

<ItemGroup>
   <RemoteDeploy Include="__example.cpp">
<!-- This is the source Linux machine, can be empty if DeploymentType is LocalRemote -->
      <SourceMachine>$(RemoteTarget)</SourceMachine>
      <TargetMachine>$(RemoteDebuggingTarget)</TargetMachine>
      <SourcePath>~/example.cpp</SourcePath>
      <TargetPath>~/example.cpp</TargetPath>
<!-- DeploymentType can be LocalRemote, in which case SourceMachine will be empty and SourcePath is a local file on Windows -->
      <DeploymentType>RemoteRemote</DeploymentType>
<!-- Indicates whether the deployment contains executables -->
      <Executable>true</Executable>
   </RemoteDeploy>
</ItemGroup>

For CMake projects that target a remote Linux machine, you can specify a new remote debug machine via launch.vs.json. By default, the value of “remoteMachineName” will be synchronized with the “remoteMachineName” property in CMakeSettings.json, which corresponds to your remote build machine. These properties no longer need to match, and the value of “remoteMachineName” in launch.vs.json will dictate the remote machine used for deploy and debug.

IntelliSense will suggest all a list of all established remote connections, but you can add a new remote connection by navigating to Tools > Options > Cross Platform > Connection Manager or searching for “Connection Manager” in the search bar at the top of your screen.

If you want complete control over your deployment, you can append the following code block(s) to launch.vs.json:

"disableDeploy": false,
"deployDirectory": "~foo",
"deploy" : [
   {
      "sourceMachine": "127.0.0.1 (username=example1, port=22, authentication=Password)",
      "targetMachine": "192.0.0.1 (username=example2, port=22, authentication=Password)",
      "sourcePath": "~/example.cpp",
      "targetPath": "~/example.cpp",
      "executable": "false"
   }
]

Resolved issues

The best way to report a problem or suggest a feature to the C++ team is via Developer Community. The following feedback tickets related to C++ cross-platform development have been recently resolved in Visual Studio 2019 16.1 Preview 2 or Preview 3:

No configurations when using CppProperties.json

Unable to attach process of linux vm

cmake linux binary deployment fails with WSL

Infobar appears when open existing CMake cache fails

VS2017 crashes if SSH has connection error while building remote Linux CMake project

CTest timeout feature doesn’t work in test explorer

CMake: Any minor change to CMakeLists.txt triggers a full cache regeneration

CMake + Intellisense: Preprocessor definitions in CMakeLists do not work with quoted strings

Intellisense problem for Linux Makefile project

Talk to us!

Do you have feedback on our Linux tooling in Visual Studio? Pick a time to chat with the C++ cross-platform team and share your experiences – the good and the bad – to help us prioritize and build the right features for you! We can also be reached via the comments below, email (visualcpp@microsoft.com), and Twitter (@VisualC) and (@erikasweet_).

The post Linux Development with C++ in Visual Studio 2019: WSL, ASan for Linux, Separation of Build and Debug appeared first on C++ Team Blog.

Top Stories from Microsoft Build – 2019.05.10

$
0
0

Whew, what a week! Microsoft Build 2019 has come and gone, and what an amazing conference it was. There were so many great announcements for Microsoft products, and for Azure and DevOps in particular. I absolutely cannot wait to get home and start playing with the new features. (And I hope you’re excited, too!) And a very special thanks to everybody who took the time to came visit us at our booths on the expo floor.

But if you weren’t able to make it to the conference, don’t worry, the conference can come to you. This week instead of the usual top stories from the community, I wanted to link to all the great content at Build that focused on DevOps.

Scott Guthrie and Donovan Brown announced some of the new features in Azure DevOps in Scott’s keynote, and then we had a number of great breakout sessions to dive more in-depth and look more closely at how Azure DevOps is used by actual customers.

Breakout Sessions

From Zero to DevOps Superhero: The Container Edition by Jessica Deen

Ship it to every platform with Azure Pipelines by Edward Thomson

Using AI and automation to build resiliency into Azure DevOps by Rob Jahn

End to end application development and DevOps on Azure Kubernetes Service by Atul Malaviya, Sean McKenna, and John Stallo

DevOps for applications running on Windows by Oren Novotny and Ricardo Minguez Pablos

Columbia Sportswear’s CI practices, processes, and automation to accelerate Azure PaaS adoption by Scott Nasello

Microsoft’s journey to becoming an open source enterprise with GitHub by Matthew McCullough and Jared Parsons

.NET Application Modernization with Pivotal and Azure DevOps by Ning Kuang and Shawn Neal

Breaking the Wall between Data Scientists and App Developers with MLOps by David Aronchick and Jordan Edwards

Building Python Web Applications with Visual Studio Code, Docker, and Azure by Dan Taylor

Implementing control at scale in a cloud & devops centric environment using policy and blueprints by Joseph Chan and Liz Kim

No more last mile problems! Quickly deploy .NET, Python, Java and Node apps on Azure App Service by Stefan Schackow and Andrew Westgarth

Theater Sessions

If you’re crunched for time, don’t miss Damian Brady’s amazing theater sessions End to End Azure DevOps and DevOps – Where to start?.

Build On-Demand Sessions

The Azure DevOps team got into the studios ahead of the Build conference to show you some of the new features.

YAML Release Pipelines in Azure DevOps with Sasha Rosenbaum

Integrating GitHub and Azure Boards by Edward Thomson

(Re-)Introducing Azure Artifacts featuring Alex Mullans

Build Live

Of course, the breakout and theater sessions aren’t the only time we’re talking about DevOps. The Channel 9 team brought in a stage for Build Live, talking right to the engineering teams working on features. Be sure to watch:

Moving Fastify to Azure Pipelines with Damian Brady and Matteo Collina

Azure Pipelines and DevOps featuring Damian Brady, Edward Thomson and Abel Wang

MLOps: How to Bring Your Data Science to Production with David Aronchick and Shivani Patel

We’ll be back to the normal top stories round-up next week. As always, if you’ve written an article about Azure DevOps or find some great content about DevOps on Azure then let me know! I’m @ethomson on Twitter.

The post Top Stories from Microsoft Build – 2019.05.10 appeared first on Azure DevOps Blog.


Systems Thinking as important as ever for new coders

$
0
0

Two programmers having a chatI was at the Microsoft BUILD conference last week and spent some time with a young university student who came prepared. I was walking between talks and he had a sheet of paper organized with questions. We sat down and went through the sheet.

One of his main questions that followed a larger theme was, since his class in South Africa was learning .NET Framework on Windows, should he be worried? Shouldn't they be learning the latest .NET Core and the latest C#? Would they be able to get jobs later if they aren't on the cutting edge? He was a little concerned.

I thought for a minute. This isn't a question one should just start talking about and see when their mouth takes them. I needed to absorb and breathe before answering. I'm still learning myself and I often need a refresher to confirm my understanding of systems.

It doesn't matter if you're a 21 year old university student learning C# from a book dated 2012, or a 45 year old senior engineer doing WinForms at a small company in the midwest. You want to make sure you are valuable, that your skills are appreciated, and that you'll be able to provide value at any company.

I told this young person to try not to focus on the syntax of C# and the details of the .NET Framework, and rather to think about the problems that it solves and the system around it.

This advice was .NET specific, but it can also apply to someone learning Rails 3 talking to someone who knows Rails 5, or someone who learned original Node and is now reentering the industry with modern JavaScript and Node 12.

Do you understand how your system talks to the file system? To the network? Do you understand latency and how it can affect your system? Do you have a general understanding of "the stack" from when your backend gets data from the database makes anglebrackets or curly braces, sends them over the network to a client/browser, and what that next system does with the info?

Squeezing an analogy, I'm not asking you to be able to build a car from scratch, or even rebuild an engine. But I am asking you for a passing familiarity with internal combustion engines, how to change a tire, or generally how to change your oil. Or at least know that these things exist so you can google them.

If you type Google.com into a browser, generally what happens? If your toaster breaks, do you buy a new toaster or do you check the power at the outlet, then the fuse, then call the neighbor to see if the power is out for your neighborhood? Think about systems and how they interoperate. Systems Thinking is more important than coding.

If your programming language or system is a magical black box to you, then I ask that you demystify it. Dig inside to understand it. Crack it open. Look in folders and directories you haven't before. Break things. Fix them.

Know what artifacts your system makes and what's needed for it to run. Know what kinds of things its good at and what it's bad at - in a non-zealous and non-egotistical way.

You don't need to know it all. In fact, you may dig in, look around inside the hood of a car and decide to take a ride-sharing or public transport the rest of your life, but you will at least know what's under the hood!

For the young person I spoke to, yes .NET Core may be a little different from .NET Framework, and they might both be different from Ruby or JavaScript, but strings are strings, loops are loops, memory is memory, disk I/O is what it is, and we all share the same networks. Processes and threads, ports, TCP/IP, and DNS - understanding the basic building blocks are important.

Drive a Honda or a Jeep, you'll still need to replace your tires and think about the road you're driving on, on the way to the grocery store.

What advice would you give to a young person who is not sure if what they are learning in school will serve them well in the next 10 years? Let us know in the comments.


Sponsor: Manage GitHub Pull Requests right from the IDE with the latest JetBrains Rider. An integrated performance profiler on Windows comes to the rescue as well.


© 2018 Scott Hanselman. All rights reserved.
     

Azure.Source – Volume 82.

Announcing the Azure Pipelines app for Microsoft Teams

$
0
0

As developers, we spend considerable time and energy on monitoring builds and releases. To help us be more efficient, we are excited to announce the availability of the Azure Pipelines app for Microsoft Teams. If you use Microsoft Teams, you can now set up subscriptions to receive notifications for completed builds, releases, pending approvals and much more in your channels. You can also approve releases from within your channel.

For details, please take a look at the documentation here. To install the app, visit the Microsoft Store and search for Azure Pipelines.

We will be continuously improving the app. Please give the app a try and send us your feedback using the ‘@azure pipelines feedback’ command in the app or on Developer Community.

The post Announcing the Azure Pipelines app for Microsoft Teams appeared first on Azure DevOps Blog.

Azure SQL Database Edge: Enabling intelligent data at the edge

$
0
0

The world of data changes at a rapid pace, with more and more data being projected to be stored and processed at the edge. Microsoft has enabled enterprises with the capability of adopting a common programming surface area in their data centers with Microsoft SQL Server and in the cloud with Azure SQL Database. We note that latency, data governance and network connectivity continue to gravitate data compute needs towards the edge. New sensors and chip innovation with analytical capabilities at a lower cost enable more edge compute scenarios to drive higher agility for business.

At Microsoft Build 2019, we announced Azure SQL Database Edge, available in preview, to help address the requirements of data and analytics at the edge using the performant, highly available and secure SQL engine. Developers will now be able to adopt a consistent programming surface area to develop on a SQL database and run the same code on-premises, in the cloud, or at the edge.

Azure SQL Database Edge offers:

  • Small footprint allows the database engine to run on ARM and x64 devices via the use of containers on interactive devices, edge gateways, and edge servers.
  • Develop once and deploy anywhere scenarios through a common programming surface area across Azure SQL Database, SQL Server, and Azure SQL Database Edge
  • Combines data streaming and time-series, with in-database machine learning to enable low latency analytics
  • Industry leading security capabilities of Azure SQL Database to protect data-at-rest and in- motion on edge devices and edge gateways, and allows management from a central management portal from Azure IoT.
  • Cloud connected, and fully disconnected edge scenarios with local compute and storage.
  • Supports existing business intelligence (BI) tools for creating powerful visualizations with Power BI and third-party BI tools.
  • Bi-directional data movement between the edge to on-premises or the cloud.
  • Compatible with popular T-SQL language, developers can implement complex analytics using R, Python, Java, and Spark, delivering instant analytics without data movement, and real-time faster insights

T-SQL Language logos

  • Provides support for processing and storing graph, JSON, and time series data in the database, coupled with the ability to apply our analytics and in-database machine learning capabilities on non-relational datatypes.

For example, manufacturers that employ the use of robotics or automated work processes can achieve optimal efficiencies by using Azure SQL Database Edge for analytics and machine learning at the edge. These real-world environments can leverage in-database machine learning for immediate scoring, initiating corrective actions, and detecting anomalies.

Key benefits:

  • A consistent programming surface area as Azure SQL Database and SQL Server, the SQL engine at the edge allows engineers to build once for on-premises, in the cloud, or at the edge.
  • The streaming capability enables instant analysis of the incoming data for intelligent insights.
  • In-Database AI capabilities enables scenarios like anomaly detection, predictive maintenance and other analytical scenarios without having to move data.

Choice of platform diagram detailing the possible options for in-database capabilities

Train in the cloud and score at the edge

Supporting a consistent Programming Surface Area across on-premises, in the cloud, or at the edge, developers can use identical methods for securing data-in-motion and at-rest while enabling high availability and disaster recovery architectures equal to those used in Azure SQL Database and SQL Server. Giving seamless transition of the application from the various locations means a cloud data warehouse could train an algorithm and push the machine learning model to Azure SQL Database Edge and allow it to run scoring locally, giving real-time scoring using a single codebase.

Intelligent store and forward

The engine provides proficiencies to take streaming datasets and replicate them directly to the cloud, coupled with enabling an intelligent store-and-forward pattern. In duality, the edge can leverage its analytical capabilities while processing streaming data or applying machine learning using in-database machine learning. Fundamentally, the engine can process data locally and upload using native replication to a central datacenter or cloud for aggregated analysis across multiple different edge hubs.

Flow chart display of Azure SQL Database Edge engine running on interactive devices as well as edge gateways and servers

Unlock additional insights for your data that resides at the edge. Join the Early Adopter Program to access the preview and get started building your next intelligent edge solution.

Lenovo’s new ThinkBook S series—built for business

Viewing all 5971 articles
Browse latest View live


<script src="https://jsc.adskeeper.com/r/s/rssing.com.1596347.js" async> </script>